

 PDF
PDF ePub
ePub Citation
 Print
Print


INTRODUCTION
MR T1-weighted images (T1WI) are mainly used to the anatomical details and pathological abnormalities of the intracranial lesions. Spin-echo (SE) technique has been the most commonly used pulse sequence for T1WI (1). T1-weighted fluid-attenuated inversion recovery (T1FLAIR) is a relatively new pulse sequence and it provides higher tissue contrast between the gray and white matter (WM) of the brain than T1-weighted SE (T1SE) sequence (2, 3, 4, 5). However, there has been controversy for the evaluation of enhancing brain tumors with T1FLAIR compared to T1SE. Al-Saeed et al. (3) and Rydberg et al. (4) reported that T1FLAIR demonstrated greater sensitivity for contrast enhancement and provided superior contrast between lesions and background compared with T1SE. However, other investigators (1, 6, 7) showed converse results.
The purpose of the present study was to compare T1FLAIR and T1SE sequences for the evaluation of enhancing intracranial tumors.
MATERIALS AND METHODS
Patients
From March 2012 to July 2012, fifty-two patients with seventy-nine tumors (31 primaries, 48 metastases) prospectively underwent T1SE and T1FLAIR MR imaging during the same imaging session. There were 19 males and 33 females, aged from 32 to 77 years (mean, 57.2 years). 28 patients had primary tumors and 24 patients had metastatic tumors from the remote sites. The primary tumors consisted of meningiomas (n=14), schwannomas (n=6), glioblastomas (n=5), oligodendroglioma (n=1), hemangioblastoma (n=1), and pineal tumor (n=1), respectively. The primary neoplasms of the metastatic tumors were lung cancer (n=18), breast cancer (n=3), rectal cancer (n=2), and ovarian cancer (n=1), respectively. Diagnoses were made on the basis of biopsy results (n=12) or clinical and radiologic findings (n=40). Two of 28 patients with primary tumors had multiple tumors. Among 24 patients with metastatic tumors, 14 had multiple tumors. In cases of multiple tumors in a patient, only the largest three of them were selected and evaluated.
Imaging parameters
1.5 Tesla MR scanners were used in all patients (Magnetom Avanto/Sonata; Siemens Healthcare, Erlangen, Germany). Imaging studies included contrast-enhanced (CE) axial T1SE images (TR/TE, 414 ms/11 ms; acquisition time, 1 minute 33 seconds; slice thickness/gap, 5 mm/1-1.5 mm) and CE axial T1FLAIR images (TR/TEeff, 2000 ms/8.8 ms; inversion time, 860 ms; acquisition time, 1 minute 54 seconds; slice thickness/gap, 5 mm/1-1.5 mm).
Scans were started 5 minutes after intravenous administration of gadobutrol (Gadovist; Bayer HealthCare, Berlin, Germany), adapted to the body weight of the patient (0.1 mmol/kg) as a bolus injection. T1SE and T1FLAIR were used alternately as the first CE sequence to avoid delayed contrast enhancement effects of the lesions. The first CE sequence was T1SE in 19 patients (30 tumors) and T1FLAIR in 33 patients (49 tumors), respectively.
Quantitative evaluation
Region-of-interest (ROI) analysis was performed for CE T1SE and CE T1FLAIR images by a single investigator. For quantitative assessment, we measured signal intensities (SIs) by a ROI analysis of the tumor, WM, cortical GM, and cerebrospinal fluid (CSF), respectively. SI was also measured in the air space for the measurement of image noise. SI of the tumor was measured within a homogeneously enhancing solid portion. The gray and WM SIs were measured in normal appearing areas adjacent to the tumor, which showed no edema or atrophy. The CSF SI was measured in a homogeneous region within the lateral ventricles. The ROI areas [mean ± standard deviation (SD)] of the tumor, WM, cortical GM, CSF, and air space for the measurement of image noise were 3.2 ± 1.5, 27.2 ± 8.1, 5.4 ± 1.2, 38.4 ± 6.3, and 76.2 ± 10.5 mm2, respectively.
Eight quantitative criteria were calculated: lesion-to-WM contrast ratio (CR) and contrast-to-noise ratio (CNR), lesion-to-GM CR and CNR, lesion-to-CSF CR and CNR, and WM-to-GM CR and CNR. The lesion-to-WM CR was defined as the difference between the lesion and WM SIs divided by the WM SI [CRlesion-to-WM = (SIlesion - SIWM) / SIWM] and the lesion-to-WM CNR was defined as the difference between the signals from the lesion and WM divided by the standard deviation (SD) of measured image noise [CNRlesion-to-WM = (SIlesion - SIWM) / SDbackground noise]. Similar calculations were performed for lesion-to-GM CR and CNR, lesion-to-CSF CR and CNR, and WM-to-GM CR and CNR. The paired sample t-test was used for comparison of quantitative data between T1SE sequence and T1 FLAIR sequence. A P value of less than 0.05 was considered statistically significant.
Qualitative evaluation
Two independent radiologists (a neuroradiologist with 20 years experience and a third-year resident) performed the qualitative analysis of lesion conspicuity on CE T1SE and CE T1FLAIR sequences. A three-scale was used to grade the lesion conspicuity: 1, CE T1SE superior; 2, sequences equal; 3, CE T1FLAIR superior.
RESULTS
A total of 79 enhancing tumors (31 primaries, 48 metastases) in 52 patients were evaluated. The size of the tumors was 0.3 - 6.3 cm (mean, 1.8) in the longest diameter. In all patients, both CE T1SE and CE T1FLAIR were able to demonstrate the same lesions.
Quantitative results
The quantitative results of lesion-to-WM, lesion-to-GM, lesion-to-CSF, and WM-to-GM CRs and CNRs are summarized in Tables 1 and 2. The T1FLAIR lesion-to-GM CR and CNR, lesion-to-CSF CR and CNR, WM-to-GM CR and CNR values were higher than those of the T1SE images and they showed statistically significant differences (p < 0.001 in all). However, lesion-to-WM CR and CNR were similar on both two sequences without statistically significant difference (p = 0.061, 0.662, respectively). There was no significant difference in CR and CNR values between T1FLAIR performed before and T1FLAIR performed after T1SE imaging. This suggests that delays in contrast medium administration did not affect findings.
Qualitative results
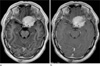
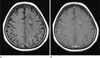
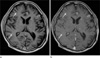
For the qualitative comparison of lesion conspicuity between T1FLAIR and T1SE imaging, the grading scales (mean ± SD) of both radiologists were 2.69 ± 0.55 and 2.69 ± 0.59, respectively, which means T1FLAIR images were superior to T1SE images for the evaluation of lesion conspicuity (Figs. 1, 2, 3).
DISCUSSION
T1FLAIR image provides superior contrast between the gray and WM and between the WM and CSF compared with T1SE image (2, 3, 4, 5). However, T1FLAIR sequence has not been widely used in clinical practice because of the much longer acquisition time (1). With recent advances in MR technology, the acquisition time of T1FLAIR sequence has been decreased. In the present study, we could acquire T1FLAIR images of the whole brain within 2 minutes, which could be acceptable for routine practice.
Inversion recovery sequence is characterized by an additional 180 degrees RF pulse (inversion pulse) with a time interval (inversion time, TI) prior to the SE pulse sequence. Magnetization in equilibrium state (Mo) becomes - Mo by a 180 degrees RF pulse, and T1 relaxation is done with time. This means increased T1 contrast by twofold as compared with Mo. Thus, FLAIR pulse sequence provides image with increased T1 contrast than that from SE pulse sequence (3).
Previous investigators have insisted that T1FLAIR provided superior contrast between the CSF and WM, between the WM and GM, and between the lesions and background (3, 4, 5). According to the report of Rydberg et al. (4), who evaluated enhancing brain lesions with T1FLAIR and T1SE, T1FLAIR images were quantitatively comparable or superior for lesion-to-background (WM) contrast and CNR compared with T1SE images. Gray-to-WM and CSF-to-WM contrast and CNRs were statistically superior in T1FLAIR images. Qualitatively, T1FLAIR technique provided improved lesion conspicuity and superior image contrast compared with T1SE images. Al-Saeed et al. (3) also proved that T1FLAIR image provided improved gray-to-WM contrast and lesion-to-background contrast.
The results of our study were similar to those of the previous reports. On both of quantitative and qualitative analyses, T1FLAIR sequence showed superior lesion-to-GM, lesion-to-CSF, and WM-to-GM contrast and lesion conspicuity compared to T1SE. However, the lesion-to-WM contrast on T1FLAIR sequence was similar to that on T1SE. The main reason that T1FLAIR shows superior gray-WM, lesion-to-GM and lesion-to-CSF contrast to T1SE might be caused by suppression of water signal intensity on T1FLAIR.
There have been some reports which showed different results to those of our study. Melhem et al. (6) and Qian et al. (1) reported that T1SE imaging revealed more lesions and higher CRs or CNRs than T1FLAIR imaging although T1FLAIR showed superior gray-to-WM contrast to T1SE imaging. Fischbach et al. (7) reported that T1SE improved contrast-enhanced lesions conspicuously to those of T1FLAIR at 3T. This discrepancy might be caused by differences in types of diseases included in their investigations and our study as well as by differences in scanning parameters. Most of the previous investigations which showed different results to those of our study evaluated only the parenchymal lesions of the brain. However, in our study, 23 lesions (29.1%) were extra-axial tumors (17 meningiomas, 6 schwannomas).
There are some limitations in our study. First, various kinds of tumors were included in our study. Enhancement of brain tumors depend on various factors. They include histologic type, tumor vascularity, and preservation or breakdown of the blood-brain barrier. The lesion-to-background contrast of the brain tumors on T1-weighted image are also influenced by various factors, which are enhancement degree, size, and locations of the tumors and presence and absence of surrounding brain edema. Further studies confined to specific type of the tumors are needed.
Second, in cases of multiple metastatic tumors, only the largest three tumors were evaluated and it could work as a selection bias.
Third, scanning delays after contrast medium administration may affect the enhancement degree of the brain tumors. In our study, T1FLAIR and T1SE sequences were not equally used as the first CE sequence, which could also work as a bias.
In conclusion, for the evaluation of enhancing intracranial tumors, T1FLAIR sequence was superior or comparable to T1SE sequence.


 XML Download