

 PDF
PDF ePub
ePub Citation
 Print
Print


INTRODUCTION
Quantitative measurement of relaxation parameters in MRI refers to MR relaxometry which implies the measurement of biophysical parameters through decoupling the different contrast mechanisms contributing to the overall MR signal. MR relaxation mapping is important to evaluate the tissue structure and function. Among the quantitative MRI parameters reflecting the local tissue environment, the relaxation times T1, T2, and T2* are the fundamental components (1, 2). The longitudinal (or spin-lattice) relaxation time T1 is the decay constant for the recovery of the z component of the nuclear spin magnetization, Mz, towards its thermal equilibrium value. The transverse (or spin-spin) relaxation time T2 is the decay constant for the component of M perpendicular to B0. The T2 value is usually measured using a T2-weighted spin-echo or fast spin-echo sequence. So far, a few studies have measured T1 and T2 relaxation times for breast tissue at field strengths of 3T MR (4, 5).
T2* relaxation refers to decay of transverse magnetization caused by a combination of spin-spin relaxation and magnetic field inhomogeneity, which is usually much smaller than T2. T2* relaxation is one of the main determinants of image contrast with gradient-echo( GRE) sequences and forms the basis for many MR applications, such as susceptibility-weighted (SW) imaging, perfusion MR imaging, and functional MR imaging (3). Magnetic field inhomogeneities from susceptibility differences among tissues and materials cause faster T2* relaxation. Measurements of the T2* value were reported to evaluate oxygen amount (6), microbleeds (7), and functional changes (8) in human brains. However, currently there has been no report describing normal breast T2*relaxation time. The purpose of this study, therefore, was to provide T2*relaxation time of normal glandular tissue and fat of breast.
MATERIALS AND METHODS
Subjects
Fifty-two female patients (age 49 ± 12 years; range, 25 to 75 years) between January 2012 and July 2013 were included in this retrospective study, which was approved by the local institutional review board. Premenopausal women were 28 and 24 patients were in their menopause status. Among these patients, 47 patients who had breast cancer underwent breast MRI as a preoperative staging work-up and remaining 5 patients performed breast MRI for various causes; one patient for screening examination as a uterine cervix cancer patient, two patients who had benign breast lesion such as nodular fasciitis and stromal fibrosis, one patient for injection granulomas and one patient proceeded as follow up study for previous lumpectomy of breast cancer.
MRI Acquisition
Scans were performed on a 3T MRI system (Achieva, Philips Healthcare, Best, The Netherlands) with four-channel breast coil for reception with patients in the prone position. The regular breast MR imaging protocol in our institute included axial T1-weighted image (T1WI) and axial short inversion recovery (STIR) T2-weighted image (T2WI) in both breasts, axial three-dimensional (3D) dynamic contrast enhanced T1WI (DCE-T1WI) in both breasts, and 6-min delayed, postcontrast enhanced sagittal fat-suppressed T1WI (CE-T1WI) for both breasts. DCE-T1WI was obtained 20 times with 18.8 seconds each interval.
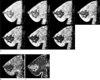
To measure T2* relaxation time, a 3D multi-echo gradient-echo sequence was acquired with sagittal slices (Fig. 1a). Seven echo times (TE) were from 2.28 ms to 25.72 ms in 3.91 ms steps. The imaging parameters were: repetition time (TR)=37.4 ms, flip angle=20°, field of view (FOV)=133 × 130 mm2, pixel size=0.55 × 0.55 mm2, matrix size=240 × 240, slice thickness=1.4 mm, the interesting gap= 1.4 mm, number of slices=105, the number of signals averaged (NSA)=1, and SENSE factor= 1.3.
MRI Data Processing
To create voxel-based T2* and R2* maps, the post-processing was performed using a MATLAB software (Natick, MA, USA). Seven volumes of the sagittal images were aligned with respect to the first volume to correct any movement. The signals were fitted using below equation:
where S0 is the equilibrium signal from the voxel and T2* is the relaxation time. The logarithm was taken for every voxel and the mono-exponential decay characteristics of the signal became a linear decline as echo increased. The MATLAB built-in function polyfit was used to perform a linear curve fit of the logarithmic signal and the T2* value for each voxel was generated. After the T2* map for each slice was produced, its inverse was calculated to create R2* maps (Fig. 1b, c).
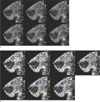
To obtain T2* and R2* values of the normal glandular tissue and fat, the 3D regions-of-interest (ROI) were then drawn on the longest echo-time image (Fig. 2a, b). Volumetric ROIs were drawn by the one radiologist with 4 years (S.J.R.) experience in breast MR imaging. The T2* and R2* values for fat tissue was calculated from an average of five ROIs drawn in the subcutaneous fat region. The size of the ROIs varied because they were drawn to maximize a region of the homogeneous tissue type. The same method was used to draw ROIs of the glandular tissue. Mean and standard deviations of the two parameters in ROIs for each subject were obtained for all subjects. Finally, those parameters were averaged over all subjects for the normal glandular tissue and fat of breast.
RESULTS
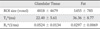
The 3D ROI sizes were 4818 ± 4679 voxels and 1455 ± 785 voxels for the normal glandular tissue and fat, respectively. The mean T2* values were 22.40 ± 5.61 ms and 36.36 ± 8.77 ms for the normal glandular tissue and fat, respectively. The mean R2* values were 0.0524 ± 0.0134/ms and 0.0297 ± 0.0069/ms for the normal glandular tissue and fat, respectively (Table 1). Two sample T-test revealed statistically significant, long T2* value of fat compared with that of glandular tissue (p < 0.00001) and also statistically significant difference of R2* value between those two tissue components (p < 0.00001).
DISCUSSION
Accurate information of relaxation times is the basis for the progress and optimization of MR imaging sequences. Currently, there are two reports (4, 5) explaining normative relaxation time data for 3T breast MRI, where only T1 and T2 were discussed, however, none was reported about T2* relaxation time. In this study, we performed T2* relaxometry maps and our result revealed longer T2* value for fat in the breast compared with that of fibroglandular tissue. A previous study (4) also demonstrated that the T2 value for adipose tissue was almost three-fold longer than that of fibroglandular tissue resulting in much greater T2 contrast between adipose and fibroglandular tissue.
We could also speculate our relative long T2* value result of fat from the histological difference. Adipose tissue of breast is loose connective tissue composed mostly of adipocytes and some stromal vascular fraction. In contrast, fibroglandular tissue of breast is composed of various components such as terminal duct lobular unit, ductules, intralobular connective tissue, interlobular connective tissue and major ducts. Even though lobules and intralobular connective tissue are formed with loose myxomatous stroma with secretion in various levels of ducts, interlobular stroma which is composed of dense, more collagenous connective tissue forms network in breast resulting more compact and various tissue components which may induce magnetic field inhomogeneities.
T2* relaxation is a combined effect of true T2 relaxation and relaxation caused by magnetic field inhomogeneities. Following equation expresses their relation where γ is the gyromagnetic ratio: 1/T2* = 1/T2 + γΔBinhom, or 1/T2* = 1/T2 + 1/T2', where 1/T2'= γΔBinhom, and ΔBinhom is the magnetic field inhomogeneity across a voxel (9). Magnetic field inhomogeneity can be classified as macroscopic (intervoxel) and microscopic (changing within a voxel) (10). Macroscopic inhomogeneity can be caused by deoxyhemoglobin in tiny veins, by air-tissue interfaces, or by metallic implants. On the other hand, paramagnetic contrast agents, blood products, or iron deposits are the causes of microscopic inhomogeneity (11).
Knowledge of T2* relaxation mapping would be a help in breast tumor and tissue characterizations such as microhemorrhage and microcalcification. Furthermore, in functional aspect of breast cancer, as T2* reflects the macroscopic inhomogeneity caused by deoxyhemoglobin, oxygen consumption could be another important future point of view in understanding and planning of breast cancer diagnosis and treatment. As the 1/T2 is referred to as the transverse relaxation rate (R2), 1/T2* can be expressed as R2*. The difference between R2* and R2 may suggest oxygen effects in tissue. This could presume the response and result of radiation therapy, affecting the prognosis. Methods to alter tumor-tissue oxygenation and/or to measure the induced changes would be strong aids in the oncologic management of cancers. Radiation sensitivity is markedly lowered in hypoxic cells since oxygen is involved in the fixation of radiation-induced DNA damage, and loco-regional tumor control is adversely affected in patients with hypoxic tumors. Hypoxia also leads to reduced sensitivity towards chemotherapeutics since drug delivery is reduced in hypoperfused hypoxic areas and hypoxic cells are quiescent, making drugs that target dividing cells ineffective (12).
There were several limitations of this study. First, although we carefully drew ROIs to minimize contaminations of different tissues, ROI of the fibroglandular tissue may contain fat in the fatty breast. Therefore, T2* and R2* values of the fibroglandular tissue may not represent the pure value of the tissue. Second, we only used 7 echoes to measure the maps. However, it should be better to use more echoes to improve the fitting result. Finally, we only included normal tissues in this study. It should evaluate those maps in breast cancer. Currently, we are evaluating the T2* values in several types of breast cancers.
In conclusion, we performed T2* relaxometry map in breast tissue using the 3T MRI system. T2* of the normal glandular tissue was shorter than that of fat. Measurement of T2* relaxation time could be important to understand susceptibility effects in the breast cancer and the normal tissue.
 XML Download