

 PDF
PDF ePub
ePub Citation
 Print
Print


INTRODUCTION
Cardiovascular magnetic resonance imaging (MRI) has gained widespread acceptance for the assessment of cardiovascular disease (1-4). Recent developments in 3.0 T MRI technology have led to an increased interest in high-field cardiac imaging. Because the signal-to-noise (SNR) scales approximately linearly with the magnetic field strength, B0, an improvement in the SNR can be expected at 3.0 T in comparison to 1.5 T. Previous studies on high-field strength cardiac MR showed a significant increase in the SNR but also reported image quality problems that were associated with B1 field inhomogeneities, specific absorption rate (SAR) constraints and a pronounced sensitivity to susceptibility artifacts (5, 6). However, improvements in MRI hardware and the development of tailored imaging techniques have been cornerstones for rapid progress in cardiac MRI.
Recently, preliminary studies on the feasibility of high magnetic field strengths for cardiac MRI compared to 1.5 T in healthy volunteers using nearly identical imaging protocols (i.e., effect of high magnetic field strength on cardiac MRI) have been reported (7-9). However, there has been rarely reported that direct comparison of 3.0 T cardiac MRI to 1.5 T cardiac MRI in clinical practice without controlling the MR parameters, which is more applicable in clinical settings, because each 1.5 T and 3.0 T protocol has its own idealized parameters set up to maximized good image quality. The aim of this study is to report our clinical experience with cardiac 3.0 T MRI compared to 1.5 T MRI in patients using standard clinically acceptable imaging protocols.
MATERIALS AND METHODS
Study populations
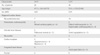
Our retrospective study was approved by the local institutional review board and used a waiver of informed consent. A total of 50 patients (35 males and 15 females; mean age of 51 years ± 16 years; age range from 18-80 years) who were referred for MRI assessment of clinically suspected heart disease were enrolled in this study. We retrospectively reviewed 30 consecutive patients (myocardial infarction [n = 14], normal [n = 8], non-ischemic cardiomyopathy [n = 5], valvular heart disease [n = 1], myocarditis [n = 1], congenital heart disease [n = 1]) who underwent 1.5 T cardiac MRI and 20 consecutive patients (myocardial infarction [n = 7], normal [n = 6], non-ischemic cardiomyopathy [n = 4], cardiac neoplasm [n = 2], valvular heart disease [n = 1]) who underwent 3.0 T cardiac MRI between April 2009 and January 2010 (Table 1). The diagnoses were based upon compatible clinical, laboratory, and echocardiographic features. A case of myocarditis and two cases of cardiac neoplasms were pathologically confirmed. The patients were randomly distributed to first available machine at the time of the MRI order. In all patients, impaired breath-holding capacity or arrhythmia that effects on acquisition of MRI was not detected, and the MRI were successfully completed.
MR imaging
All cardiac MRI examinations were performed using a 1.5 T MR scanner (Intera Achieva; Philips Medical Systems, Best, The Netherlands) or a 3.0 T MR scanner (Magnetom Verio; Siemens Medical solution, Erlangen, Germany) with cardiac-phased array coils and echocardiography gating.
For the morphology study, axial T1-weighted fast spin-echo (1.5 T: TR = 705.9 ms, TE = 10 ms, slice thickness = 8 mm, interslice gap = 2 mm, field of view = 320 × 320 mm2, matrix = 320 × 293; 3.0 T: TR = 812.5 ms, TE = 8.6 ms, slice thickness = 8 mm, interslice gap = 2 mm, field of view = 300 × 300 mm2, matrix = 256 × 179) and T2-weighted Spectral Attenuated (Spectrally Adiabatic) Inversion Recovery (T2-SPAIR, 1.5 T: TR = 1411.8 ms, TE = 100 ms, slice thickness = 8 mm, interslice gap = 2 mm, field of view = 320 × 320 mm2, matrix = 236 × 151; 3.0 T: TR = 769 ms, TE = 52 ms, slice thickness = 8 mm, interslice gap = 2 mm, field of view = 300 × 300 mm2, matrix = 256 × 205) sequences were used. Data acquisition for each slice was completed in separate breath-holds.
For the functional cine imaging, a balanced steady-state free precession (SSFP) imaging sequence was performed using a short axis 2-chamber view, a long axis 2-chamber view and a 4-chamber view (1.5 T: TR = 3.3 ms, TE = 1.6 ms, flip angle = 60°, slice thickness = 8 mm, interslice gap = 2, field of view = 320 × 320 mm2, matrix = 192 × 192; 3.0 T: TR = 3.26 ms, TE = 1.4 ms, flip angle = 38°, slice thickness = 8 mm, interslice gap = 2, field of view = 298 × 300 mm2, matrix = 256 × 178).
After the injection of 0.1 mmol/kg of gadolinium-DTPA (Magnevist, Schering, Berlin, Germany) at a rate of 4 ml/s and a 20 ml normal saline flush using a power injector (Spectris, Medrad, Indiaola, PA), the first pass perfusion images were obtained using a balanced steady-state free precession (SSFP) imaging sequence at 1.5 T and a saturation-recovery (SR) gradient recalled echo sequence (turbo FLASH) at 3 T. A dynamic series (40-60 frames) of three, short axis slices (apical, mid-ventricular and basal) per R-R interval was continuously acquired (1.5 T: TR = 2.7 ms, TE = 1.3 ms, flip angle = 50°, slice thickness = 8 mm, field of view = 320 × 320 mm2, matrix = 128 × 102; 3.0 T: TR = 1.94 ms, TE = 1.1 ms, flip angle = 10°, slice thickness = 8 mm, field of view = 300 × 300 mm2, matrix = 192 × 154).
Followed by first pass perfusion image, the repeated bolus injection of 0.1 mmol/kg of gadolinium-DTPA was done. Delayed enhancement images for viability study were acquired 10 minutes after contrast injection using an inversion-recovery spoiled gradient-echo sequence (1.5 T: TR = 5.0 ms, TE = 1.5 ms, flip angle = 15°, slice thickness = 8 mm, interslice gap = 2 mm, field of view = 320 × 320 mm2, matrix = 256 × 256; 3.0 T: TR = 5.34 ms, TE = 2 ms, flip angle = 20°, slice thickness = 8 mm, interslice gap = 2 mm field of view = 300 × 300 mm2, matrix = 256 × 205) through the whole left ventricle on the short-axis view.
Data analysis
Two radiologists independently and blindly measured the SNR and CNR of each sequence. For the T1-weighted, T2-SPAIR, functional cine and first pass perfusion images, the signal intensity of the myocardium and blood were defined as the mean signal from circular 20-30 mm2 ROIs of the normal myocardium at the middle of the left ventricle. The signal intensity of the blood was defined as the mean signal intensity of a circular 50-60 mm2 ROI of the left ventricular cavity. For the first-pass perfusion imaging, the SNR was determined for the images that showed the maximum intensity during the contrast agent passage through the left ventricular myocardium. The SNR and CNR were calculated as the SNR = mean signal intensity of myocardium/noise and the CNR = |mean signal intensity of blood - mean signal intensity of myocardium|/noise.
For the viability imaging, the SNR was obtained from ROIs positioned in the left ventricular myocardial areas that showed a delay in the contrast agent accumulation. The SNR and CNR were computed as SNR = mean signal intensity of the myocardium with delayed enhancement/noise and the CNR = |mean signal intensity of the myocardium with delayed enhancement - mean signal intensity of the normal myocardium|/noise.
Although the conventional measure of noise is the standard deviation of the signal intensity in regions outside of the body, parallel imaging reconstruction algorithms induce a very inhomogeneous noise amplification that result in a generally non-uniform background noise distribution (10). To avoid misrepresenting the actual SNR and CNR calculations, we used the statistics from the air space in the lungs as a surrogate measure of noise (11).
The image quality was graded by two radiologists in consensus using a 5-point scale (score 5 = very good/no artifacts; 4 = good/only a few artifacts; 3 = fair/artifacts are present but did not influence the image quality; 2 = poor/artifacts are present and influence the image quality; 1 = very poor/not assessable as a result of artifacts).
Statistical analysis
For both field strengths, the mean and the mean standard deviations were calculated for the data derived from the SNRs, CNRs and image scores. The independent t-test was used to assess the statistical significances. Interobserver variability for measurements of the SNR and CNR of each sequence was analyzed by calculating the intraclass correlation coefficient (ICC) with the two-way random effects model. The ICC results for interobserver agreement were interpreted using the ICC interpretation guideline (12). According to this guideline, an ICC value lower than 0.4 suggests that the observers are in poor agreement. An ICC value between 0.4 and 0.75 suggests that the level of agreement is fair to good, while an ICC value greater than 0.75 suggests excellent agreement. In all tests, p values less than 0.05 were considered statistically significant.
RESULTS
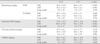
The results from the quantitative analysis are provided in Table 2. In morphologic and viability studies, the use of 3.0 T provided significant and insignificant improvements in the baseline SNRs and CNRs, respectively (T1: SNR 29% increase, p < 0.001, CNR 37% increase, p < 0.001; T2-SPAIR: SNR 13% increase, p = 0.068, CNR 18% increase, p = 0.059, viability imaging: SNR 45% increase, p = 0.017, CNR 37% increase, p = 0.135) without significant impairment in the image qualities (T1: 3.8 ± 0.9 with 3.0 T versus 3.9 ± 0.7 with 1.5 T, p = 0.438; T2-SPAIR: 3.8 ± 0.9 versus 3.9 ± 0.5, p = 0.744; viability imaging: 4.5 ± 0.8 versus 4.7 ± 0.6, p = 0.254).
Although the image qualities from the 3.0 T functional cine imaging were slightly lower than those of the 1.5 T (3.6 ± 0.7 on 3.0 T versus 4.2 ± 0.6 on 1.5 T, p < 0.001), the mean SNR and CNR with the 3.0 T were significantly improved (SNR 143% increase, p < 0.001, CNR 108% increase, p < 0.001).
With our imaging protocol for 3.0 T perfusion imaging, there were insignificant decreases in the SNR and CNR (SNR 11% decrease, p = 0.172; CNR 7% decrease, p = 0.638). However, the overall image quality was significantly improved (4.6 ± 0.5 versus 4.0 ± 0.8, p = 0.006) due to the decrease of dark rim artifacts with 3.0 T MRI.
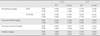
Table 3 shows the degree of agreement between the measurements of two radiologists using the ICC method. Interobserver agreement was excellent for measurements of SNRs and CNRs for T2-SPIR, functional cine, and viability imagings of 3.0 T and 1.5 T, CNR of 3.0 T perfusion imaging, and SNR of 1.5 T T1WI. Fair to good agreement was observed for SNRs and CNRs of 3.0 T T1WI and 1.5 T perfusion imaging, SNR of 3.0 T perfusion imaging, and CNR of 1.5 T T1WI.
DISCUSSION
Our results on morphologic, viability and functional cine studies are similar to previous preliminary studies that used nearly identical imaging protocols for 1.5 T and 3.0 T MRI to evaluate the effect of high magnetic fields (7-9). Our results show that, for morphologic, functional cine, and viability images, the use of different parameters for clinically optimized imaging protocols for 3.0 T compared to 1.5 T have little influence on the SNR, CNR, and image quality. Therefore, as with preliminary studies on the feasibility of high magnetic strength cardiac MR, our clinical experience suggests that cardiac MR at 3.0 T is feasible for the assessment of cardiac morphology, viability, and function.
Theoretically, imaging at 3.0 T leads to a 2-fold increase in the SNR compared to 1.5 T as the signal increases with B0 (3). The higher SNR at 3.0 T can also be used to increase the spatial resolution and/or reduce the imaging time by means of parallel imaging, which means under-sampling the k-space in conjunction with multi-element coils for spatially resolved signal detection (10, 13). Morphologic studies using fast spin-echo based imaging sequences benefit from the synergy between high magnetic field strengths and parallel imaging.
In viability studies, the delayed enhancement techniques that were clinically established at 1.5 T offer a relatively low SNR and very limited spatial coverage with a maximum of 3 slices per breath-hold. Parallel imaging at 3.0 T can overcome these difficulties by allowing whole-heart coverage in a single breath hold, leading to a uniform suppression of healthy myocardium in all of the imaged sections and increased patient comfort (7). With regard to the contrast between the normal and infarcted myocardium at 3.0 T, there is an increase in the CNR in contrast-enhanced T1-weighted sequences between the infarcted and normal myocardium because of the higher sensitivity to the gadolinium-based contrast agents used at 3.0 T (14). The prolongation of the T1-relaxation times at 3.0 T is expected to improve the tissue enhancing properties of the T1-shortening contrast agents, such as gadolinium-DTPA.
Strong static field inhomogeneities and short T2* cause more artifacts with SSFP cine imaging at 3 T than at lower field strengths (15). Banding artifacts are one of the most commonly observed artifacts in 3.0 T SSFP imaging; these artifacts can reduce image quality and hamper diagnosis of cardiac disease (15, 16). Minimization of these limitation could be achieved with localized linear or second-order shimming and a frequency scout sequence (15, 17). Although the image quality of functional cine images at 3.0 T in this study was slightly inferior due to artifacts, the diagnostic performance was not impaired (the image quality at 3.0 T: 3.6 ± 0.7).
In our study, first-pass perfusion imaging at 3.0 T showed an insignificant decreased in the SNR and CNR and significant improved image quality. The presence of dark rim artifacts is one of the major weaknesses of myocardial MR perfusion imaging. Typically, these artifacts are most pronounced when the gadolinium contrast bolus appears in the left ventricular cavity preceding tissue uptake of contrast agent and are transient in nature (18). The potential causes of dark rim artifacts are currently postulated to be the result of factors such as the gadolinium bolus (18), the motion of cardiac cycle (19), and limited spatial resolution that results in Gibbs rings (20). Strach et al. reported that high-resolution myocardial perfusion imaging at 3.0 T with a 60% increase in spatial resolution compared to the standard clinical perfusion protocol at 1.5 T is feasible and results in a significant improvement in the overall image quality and a significant reduction in dark rim artifacts (21). In another comparison study of perfusion imaging at 1.5 T and 3.0 T using identical voxel size (22), the result suggested that the diagnostic performance of 3.0 T perfusion imaging is significantly greater than that of 1.5 T in identifying both single-vessel disease and multivessel disease. In our study, small fields of view (FOV) and large matrices were used for a first-pass perfusion study at 3.0 T (FOV = 300 × 300 mm2, matrix =192 × 154, pixel size = 3.04 mm2 at 3.0 T versus FOV = 320 × 320 mm2, matrix = 128 × 102, pixel size = 7.84 mm2 at 1.5 T). We believe that high spatial resolution (i.e., smaller pixel sizes) at 3.0 T contribute to the improvement in image quality by decreasing the occurrence of dark rim artifacts (7 of 20 patients (35%) at 3.0 T versus 18 of 30 patients (60%) at 1.5 T). We used a turbo FLASH sequence for first-pass perfusion study at 3.0 T whereas balanced SSFP sequence was used at 1.5T. SSFP sequence have been proven to provide high SNR and CNR and to shorten acquisition time compared to gradient-echo sequences (23). We thought that use of turbo FLASH sequence at 3.0 T probably caused decrease of SNR and CNR as compared with those of 1.5 T in spite of advantage of high magnetic field.
Our study had some limitations. The relatively small size of patient group with diverse diseases is a major limitation. Use of different sequences for first-pass perfusion imaging could also affect the result of this study.
 XML Download