

 PDF
PDF ePub
ePub Citation
 Print
Print


INTRODUCTION
Dynamic contrast material-enhanced magnetic resonance imaging (DCE-MRI) can visualize alterations of vascularity and capillary permeability of breast lesions and enables us to identify breast lesions differentially from normal tissue (1-3). Owing to this characteristic of DCE-MRI, it has been widely used as a modality that is possibly complementary to mammography and ultrasonography (US) in detecting invasive breast cancer. Recently, the focus of study about DCE-MRI was extended from the task of discriminating between malignant and benign lesions to the tasks of distinguishing between noninvasive and invasive lesions (1).
Ductal carcinoma in situ (DCIS) is a heterogeneous disease comprising a spectrum of noninvasive malignant tumors of the breast (4). DCIS now accounts for as many as 20% of breast cancer cases because the increasing use of mammography has led to better early detection of DCIS (5). When DCIS is suspected, preoperative core needle biopsy (CNB) or vacuum-assisted biopsy are performed to evaluate invasion. However, 8-44% of DCIS patients in CNB have invasion in the breast resection or mastectomy specimen due to the inherent limitation of CNB (6-9). Once a lesion is confirmed to be malignant, recognition of invasive and noninvasive breast lesions is important for making treatment decisions. If unexpected invasion is found after surgical excision in patients with pure DCIS that was diagnosed by CNB, then a second operation may be needed for axillary lymph node staging. Therefore, identification of tumor invasiveness, if it is present, is important for clinical management decision and successful treatment.
Many studies have evaluated factors that can predict the invasion of preoperative CNB-diagnosed DCISs. The factors as radiological features were the mass, the density, the radiologic extent and the morphology of the calcification, the enhancement pattern as measured using mammography, US, or MRI (9-12). However, whether these factors are reliable predictors is still debatable.
In DCE-MRI analysis, the most widely used method to determine the likelihood of malignancy is the assessment of the type of time-signal intensity curve, e.g., the increase in signal intensity, the speed, and the enhancement pattern (3, 13-17). This method may be a labor-intensive and typically qualitative method, with intra- and interobserver variations (17). The automated computerized analysis of medical images enables to obtain quantitative indexes for diagnosis and to reduce interobserver variations (1, 18).
Thus, in this study, our aim was to assess the performance of computer-extracted quantitative parameters of DCE-MRI in predicting invasion in patients with preoperative CNB-diagnosed DCIS.
MATERIALS AND METHODS
This study was conducted with institutional review board approval. Informed consent was waived because the study was retrospective.
Patients
From January 2009 to March 2010, 99 patients who were preoperatively diagnosed with pure DCIS with US-guided core needle biopsy or stereotactic vacuum-assisted mammotome biopsy and who underwent dynamic breast MRI were included in this study. All patients with a diagnosis of DCIS with concurrent invasive carcinoma or microinavsion in the preoperative core biopsy or with a diagnosis of DCIS in the preoperative excisional biopsy were excluded from the study. Fifty-one patients were excluded from the study because of technical problems with the computer-extracted quantitative analysis which were caused by loss of the MRI raw data. Six patients were excluded because they did not undergo subsequent surgical excision. One patient was excluded because the lesion was not visible in MRI. Therefore, the final study included 42 lesions in 41 patients (bilateral DCIS in one patient). The subjects ranged in age from 34 to 78 years (mean age: 51.5 years). All patients underwent both initial mammography and US. These image findings were recorded in each case. Mammographic features were classified as calcification, mass, architectural distortion, and asymmetry. US features were classified as calcifications, mass, or other. MRI was performed after biopsy.
Forty lesions in 39 patients were detected by US and the biopsy was performed under sonographic guidance using a 14-gauge core needle. The remaining two patients had two mammographic lesions: lesions only detected by mammography, with negative US findings. The biopsy for these lesions was performed with stereotactic guidance using a directional, vacuum-assisted device with an 11-gauge needle. Specimen radiographs were obtained to identify calcification retrieval. All patients underwent subsequent surgery. Of all 41 patients, 22 patients underwent breast-conserving surgery, and 18 patients underwent total mastectomy. One patient underwent both breast-conserving surgery and total mastectomy for bilateral breast cancer.
Histopathological methods
The histopathology diagnosis of the preoperative corebiopsy and final surgical specimens were reviewed by a pathologist with 10 years of experience in breast pathology. CNB specimens were classified as in situ or invasive carcinoma. A specimen radiography was obtained in all resection specimens with calcifications. The samples were taken from the areas of calcifications, from other abnormal areas, and from the resection margin. The extension of cancer cells beyond the basement membrane into the adjacent tissues, with no single focus larger than 1 mm in the greatest dimension was considered microinvasion (19).
MRI Acquisition
All the MR images were acquired with a 3.0 T scanner (MagnetomVerio; Siemens Medical Solutions, Erlangen, Germany) equipped with a breast coil. The MRI images were acquired using the following sequences: 1) the axial, turbo spin-echo T2-weighted imaging sequence with a TR/TE of 4530/93, a flip angle of 80°, 34 slices, a FOV of 320 mm, a matrix size of 576 × 403, 1 NEX, a slice thickness of 4 mm, an acquisition time of 2 minutes 28 seconds; 2) the axial DWI with echo planar imaging (EPI) with b values of 0 and 750 seconds/mm2, a TR/TE of 9700/87, a FOV of 340 mm, a matrix size of 192 × 66, 4 NEX, a slice thickness of 4 mm with a 1-mm slice gap and an acquisition time of 2 minutes 45 seconds; and 3) the pre- and post-contrast, axial T1-weighted flash three-dimensional, VIBE sequence with a TR/TE of 4.4/1.7, a flip angle of 10°, a slice thickness of 1.2 mm, an acquisition time of 7 minutes 7 seconds, and obtained before and at 7, 67, 127, 187, 247, and 367 sec after a rapid bolus injection of 0.1 mmol/kg body weight of Gd-DPTA (Magnevist, Schering, Berlin, Germany).
DCE-MRI Quantitative Analysis
Contrast-enhanced high spatial resolution images and their subtraction images were used for lesion detection, and the time - intensity curves for each lesion were generated by one radiologist with 3 years experience in breast MRI interpretation using the institutional software. The radiologist reviewed all of the slices containing the lesion and manually placed a region of interest (ROI) with a diameter of 10±2 mm2 on the most enhanced area of the lesion in a single slice. The average size of the manually traced ROI was 11.6 mm2. The time-signal intensity curve of the dynamic images was generated as the percentage enhancement (y-axis) versus time (x-axis) of an ROI. Several quantitative parameters were calculated for each curve: the initial enhancement percentage (E1), the peak enhancement percentage (Epeak), the time to peak enhancement (TTP), and the signal enhancement ratio (SER). Percentage enhancement is a measure of the uptake of contrast material in the lesion relative to the signal intensity level before contrast enhancement (16) as follows: E1 = 100×(S1 - S0)/S0, Epeak = 100×(Speak - S0)/S0, where E1 is the initial percentage enhancement, Epeak is the peak percentage enhancement, S1 is the signal intensity in the ROI at the first contrast-enhanced point, Speak is the peak signal intensity, and S0 is the unenhanced signal intensity in the ROI. The time to peak enhancement is the time in seconds between injection of contrast material and the peak of the signal intensity-time curve. The parameter used to quantify the contrast washout of the signal intensity-time curve is SER, which is a measure of the relative decrease in signalintensity from the first to the final contrast-enhanced point (20, 21), as follows: SER=(S1 - S0)/(Slast - S0), where SER is the signal enhancement ratio and Slast is the signal intensity in the ROI at the last point of contrast enhancement. Automatic analyses of the MR images were performed with software (MROncoTreat; Siemens Medical Solutions, Erlangen, Germany) using the nonenhanced image, the first and last enhanced images, and the b = 0 & 750 s/mm2 diffusion-weighted images. A radiologist with 3 years experience with breast MRI identified the lesions and manually placed two seeds on the inside and outside of the tumor without the need to define the edges (22) ; all subsequent steps were automatically performed in real time by the computer. An interactive segmentation method was used to segment the lesion in three dimensions. The following quantitative parameters were extracted: the total volume, the longest diameter, the mean apparent diffusion coefficient (ADC) value, and the arterial enhancement fraction (AEF). The AEF is an SER in the whole assumed tumor area.
Statistical Analysis
Statistical analysis was performed using a software package (SPSS, version 16.0 for Windows; SPSS, Chicago, III). Fisher's exact test was used to compare the imaging variables between the positive and negative invasion groups. A Mann-Whitney U-test was used to compare the variables between the positive and negative invasion groups. In addition, multiple logistic regression analysis with a forward stepwise method for selecting the significant variables was performed to determine the independent MR predictors for invasion based on the MR characteristics that showed statistical significance (p < 0.05). A recursive partitioning procedure or tree classification algorithm (RPART) in R 2.2.1 (R Development Core Team, Vienna, Austria, http://www.R-project.org) was used to identify the optimal cutting points for each marker. To assess the diagnostic accuracies of these parameters, the sensitivity, specificity, positive predictive value, and negative predictive value were calculated. A p-value less than 0.05 was considered to indicate a statistically significant difference.
RESULTS
Out of 42 lesions with an initial diagnosis of DCIS, 23 (54.8%; in 23 patients) were invasive disease on the final pathology review: 17 with invasive ductal carcinoma and 6 with microinvasive ductal carcinoma. Nineteen cases (45.2%; in 19 patients) were DCIS on the final pathology review. One patient had an invasive cancer in the right breast and a DCIS in the left breast.
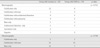
Mammographic and US features of the two groups were presented in Table 1. Image findings of mammography and US were not significantly different between the two groups. Age was not significantly different between the two groups (50.4±6.7 years in the invasion group and 52.9±11.8 yearsin the DCIS group; p = 0.667).
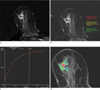
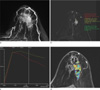
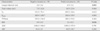
The tumor size of invasive malignancy (6.5±3.2 cm) by MR was significantly larger than that of DCIS (3.6 ± 2.6 cm; p = 0.003), and the SER of invasive malignancy (1.1±0.3) was significantly higher than that of DCIS (0.9±0.3; p = 0.036) (Figs. 1 and 2). In contrast, no significant difference was observed in the E1,Epeak, TTP, ADC value, and AEF between the invasion and DCIS groups. Univariate analysis results of the clinicopathological predictors of invasive breast cancer in patients with an initial diagnosis of DCIS are summarized in Table 2. Multivariate analysis using the two significant univariate variables revealed the following independent predictors of invasive cancer on the final pathology review: a larger DCIS size and a higher SER (Table 3).
A RPART using a backward selection procedure revealed that the significant predictive factors of invasion on the final pathology were a lesion size greater than 2.5 cm (p = 0.025) and an SER higher than 0.7 (p = 0.049) and that these were associated with a higher probability of invasive breast cancer. At a cut-off value of 2.5 cm in diameter (a diameter higher than 2.5 cm was considered malignant), the sensitivity, specificity, positive predictive value, and negative predictive value were 91.3%, 52.6%, 70.0%, and 83.3%, respectively. Using a cut-off value of 0.7 for the SER (a SER higher than 0.7 was considered malignant), the sensitivity, specificity, positive predictive value, and negative predictive value were 95.7%, 47.4%, 68.8%, and 90.0%, respectively.
DISCUSSION
We evaluated quantitative methods for assessing kinetic curves for differentiating invasive cancer from DCIS on MR images. Although recent studies analyzing the time-signal intensity curve have reported improved discrimination between noninvasive (DCIS) and invasive cancer (IDC)(1, 13, 23, 24), they were unable to find any particular quantitative parameters that predict an increased risk of invasion. However, we found that, of the several quantitative parameters, the longest diameter and SER were the predictors associated with invasion in patients with an initial CNB-diagnosed DCIS. Furthermore, according to our univariate and multivariate analyses, each of these variables was a significant, independent, prognostic factor for tumor invasion. This computerized, quantitative analysis of breast cancer may not necessarily fit into clinical care for the presence; however, if a prospective study with more patients is performed, this study has the potential to be clinically useful. For example, if the workstation findings indicate a potentially invasive cancer, an intraoperative frozen section of the breast mass or a biopsy of the sentinel lymph node could be performed to rule out possible invasion. This may help avoid secondary surgical procedures.
Quantitative kinetic analysis of dynamic contrast-enhanced MRI based on tissue uptake of gadolinium in a two-compartment model showed a correlation between the functional parameters of dynamic MRI and angiogenesis of the tumor (25). An increased tumor microvessel density which is driven by tumor angiogenesis will increase blood flow, thereby causing contrast enhancement. In addition, tumor-induced microvessels often have structural abnormalities, which give rise to contrast leakage. This causes the characteristic contrast enhancement pattern (26). Malignant breast lesions tend to enhance faster and stronger and to washout in the late post-contrast phase than benign lesions (27, 28). Although DCIS tends to show initially slower enhancement and plateau or persistent enhancement compared with invasive cancer, the kinetic characteristics overlapped in pure DCIS and invasive cancer (1). This makes it difficult to use the kinetic analysis of MRI as a method for predictingthe invasion in patients with an initial CNB-diagnosed DCIS.
Of quantitative kinetic parameters, SER is correlated with tumor angiogenesis and aggressiveness (21, 22); high SER, which corresponds to tmor areas that quickly enhance and washout, reflects increased tumor angiogenesis and a high-grade tumor. In our study, SER significantly increases in the invasion group compared with the pure DCIS lesions. This indicated that tumor angiogenesis and structural abnormalities of vessels are more prominent as the lesion progresses from DCIS to invasive cancer (29).
Tumor size is an important factor for predicting invasion in patients with an initial CNB diagnosed DCIS. This means that larger DCIS logically tend to co-exist with invasive components than smaller DCISs (8, 9). Although mammography is the mainstay in the diagnosis of DCIS, MR imaging was more sensitive than mammography for assessment of DCIS extent, particularly in heterogeneously dense or extremely dense breasts (30, 31). Therefore, MRI has an increasing role in the diagnosis and clinical management decisions of initial CNB-diagnosed DCIS lesions. According to a previous study, the MRI lesion size of a DCIS might serve as a predictor of the presence of an invasion with a MRI lesion size greater than 1.95cm in diameter (10). Our results were in agreement with this finding. With a cut-off value of 2.5 cm in diameter,the sensitivity, specificity, positive predictive value, and negative predictive value were 91.3%, 52.6%, 70.0%, and 83.3%, respectively.
Our study has several limitations. First, the 54.8% upgrade rate (23 of 42 lesions) from DCIS to invasive carcinoma or microinvasive carcinoma as higher than the reported rate between 8-44%(7-9). A number of factors are likely to have contributed to this. First, the development of immunohistochemistry techniques enables the more sensitive detection of microinvasion. Histological detection and evaluation of the minuscule foci of microinvasion is often difficult for the pathologist, because a variety of in situ patterns and artifacts can be misinterpreted (32). However, the development of immunohistochemical staining technique results in less misinterpretation and a better ability to detect the microinvasion (33). As a second factor, the use of 14-gauge needles more rather than 11-gauge needles may impact the underestimation rate. It has been shown that the use of larger vacuum-assisted needles leads to lower rate of underestimation (34).
Second, selection bias might have been possible, as some cases were diagnosed in outside clinics with a subsequent slide review at our institution by a pathologist were excluded in this study and more than half of all cases were excluded due to the errors in MRI data storage.
In addition, we did not perform a detailed analysis of the relationship between the histological and imaging findings, for example, the comparison of a suspicious invasion focus seen on the MRI with the corresponding histological analysis.
Of the quantitative MR parameters of biopsy-proven DCIS (i.e., diameter, E1, Epeak, TTP, SER, and ADC), we conclude that the lesions exhibiting larger diameters and high SERs are more likely to be associated with invasion.This study is clinically useful for prevention of secondary surgical procedures.

 XML Download