

 PDF
PDF ePub
ePub Citation
 Print
Print


INTRODUCTION
Most female ovarian lesions manifest as cystic masses contain variable contents of fluid. MR image is increasingly used to evaluate theses cystic lesions; malignancy can in some cases be predicted, however, sometimes it is nonspecific for differentiation of benign and malignant lesions. Solid component of ovarian cystic tumors visualized on ultrasonography, CT or MR images strongly supports the diagnosis for malignancy (1-4). Although the presence of tumor markers (CA-125, CA15.9, CEA, CASA and CA 72-4) for the differential diagnosis of ovarian tumors has been studied, there is compelling evidence that cyst fluid tumor marker levels cannot distinguish adequately between the different histologic types. In vivo MRS (magnetic resonance spectroscopy) is a powerful and a noninvasive chemical analysis. This essay illustrated the use of MRS in evaluating female ovarian cystic lesions.
In vivo proton MRS was performed with a free-breathing multivoxel point-resolved spectroscopy (PRESS) sequence (TR/TE = 1500/135 msec or 1500/30 msec, 2048-point acquisition, 2500 Hz bandwidth eight averages). CHESS water suppression with 20 Hz bandwidth was obtained after semiautomated higher-order shimming. Outer volume suppression was achieved with six suppression bands placed three-dimensionally around the lesion. Post-processing was applied automatically with zero-order phase correction, zero-filling to 4096 points, and noise removal with a low pass 1.25 Hz Gaussian filter. The Voxel of interest for MRS measurement was placed at the center of the pelvic cystic lesions to avoid a contamination signal from adjacent normal tissue, and voxel size was approximately 1 cm3 or 8 cm3 depending on the tumor size. The data sets to a workstation operated on SA/GE software (GE). Prior to proton-MRS, pelvic CT or MRI findings were reviewed by a radiologist to determine the location of cystic lesions.
Benign and Malignant Epithelial tumor
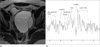
Epithelial ovarian tumors can be classified as benign (60% of cases), malignant (35%), or borderline (low-malignant-potential) (5%) depending on their histologic characteristics and clinical behaviors (3). Epithelial tumors are primarily cystic, which may be either unilocular or multilocular, and the malignant varieties are associated with varying proportions of a solid component.
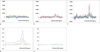
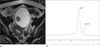
In cases with benign and borderline epithelial tumor, there is no significantly prominent peak was not found (Fig. 1a) and consisted in low levels of lipid, lactate, glycoprotein. This also revealed MR spectrum around 2.05 ppm in cystic portion of benign and borderline neoplasms (Fig. 2 and 3). In study of cystic ovarian tumors, the high concentration of N-acetyl-L-aspartic acid (NAA) was confirmed in benign serous tumors, and they conclude that both NAA and N-acetyl groups from glycoproteins and/or glycolipids may contribute to the 2.0-2.1 ppm resonance complex in ovarian cyst fluid (5).
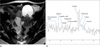
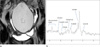
Compared to benign subtypes, significantly higher concentrations of leucine, valine, threonine, lactate, acetate, methionine, glutamine and choline and glycoprotein were detected in the malignant cyst fluid than in the benign cyst fluid (Fig. 4). Although the origin of the triglycerides is debated, cell growth retardation and cell death are likely to be responsible for the triglyceride peaks (6). Rapid cellular turnover in malignant tissues usually leads to a considerable amount of cellular deaths, resulting in areas of necrosis, which appear as a lipid signal. A high lipid peak indicates the disruption of macromolecules in the cell membrane of tumor cells in cases of brain and uterine cervix cancer (7, 8). On study of lung cancer, the paucity of lipid in normal lung parenchyma and detection of lipid peak within the tumor on vivo MRS might play a role for the evaluation of cancer (9).
The doublet peak around 1.3 ppm represents lactate and lipid. Although lactate signals were detected even in some cases of benign tumor, all malignant tumors showed lactate peak and tended to form higher peaks than the benign tumors (10-12). The lactate signal reflects anaerobic glycolysis and there have been many reports that the lactate signal is higher in the malignant brain tumors (13). In specimens (Borrmann type III) with tubular adenocarcinoma, cancer lesions showed decreased levels of lipid peaks, significant levels of lactate doublet peaks, and increased intensity of the choline peak as compared with noncancerous gastric tissue (14).
Metastatic ovarian tumor
Metastatic ovarian tumor represents 5-15% of malignant ovarian tumors. Breast cancer, colon cancer, gastric cancer, and lymphoma are the most frequent neoplasms to metastasize to the ovaries. Imaging findings in metastatic lesions are nonspecific solid and cystic lesion (2). In the study, two metastatic ovarian tumors are included: metastatic squamous cell carcinoma from uterine cervix and Krukenberg tumor from stomach. They showed double peaks around 1.3 ppm (Fig. 5). Like malignant epithelial tumor, higher concentrations of leucine, valine, threonine, lactate, acetoacetate, glutamine and choline and glycoprotein than benign epithelial tumor were detected. Hagberg et al. found higher serum concentrations of lactic acid in non-Hodgkin's lymphoma, significantly correlated with spread of the disease, as well as histological grade of malignancy (15). The observations in malignant cysts of high lactic acid and alanine in combination with low glucose, compared to benign cysts, seem to indicate a preference for anaerobic metabolism or an impairment of aerobic pathways in this cyst type (16). A significantly higher concentration of choline was also found in metastatic cyst fluids. Increased proliferation in malignancy resulting in increased membrane synthesis may form the basis of this high choline concentration (13).
Mature cystic teratoma
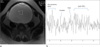
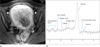
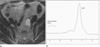
Mature cystic teratomas are most common ovarian germ cell neoplasm and also the most common ovarian neoplasm in patients younger than 20 years. Mature cystic teratomas are composed of well-differentiated derivations from at least two of the three germ cell layers. At MR imaging, the sebaceous component of mature cystic teratomas has very high signal intensity on T1-weighted images, similar to retroperitoneal fat. The signal intensity of the sebaceous component on T2-weighted images is variable, usually approximating that of fat (17, 18). A T1-weighted fat-suppressed sequence distinguished them from hemorrhagic lesion. On MRS, a prominent lipid peak was noted at 1.3 ppm (Fig. 6). A high lipid peak in the mature cystic teratoma was a characteristic finding reflecting a high content of fatty component (10, 19-21). These results may be useful to confirm the histological character of cystic content.
Endometriosis
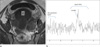
Endometriosis is classically defined as the presence of functional endometrial glands and stroma outside the uterine cavity. Endometrosis is a common and important clinical problem of women, predominantly those in the reproductive age group. Endometriosis generally occurs within the ovaries and is the result of repeated cyclic hemorrhage. On T1-weighted images, endometriosis has relatively homogenous high signal intensity. Most common and important feature of an endometrioma is "shading", which can be seen on T2-weighted images (22, 23). In our four (67%) patients with endometriosis, high lactate double peak was observed in 1.3 ppm, and various lipid and glycoprotein peaks (Fig. 7). Lactate double peak of endometriosis was higher than that of malignant cystic neoplasm (Fig. 1b, c). Massuger et al. (11) detected an unique elevated glycine concentration in endometrial cyst fluid, which corresponds with our finding. Cystic fluid of endometriosis is made in the result of continuous breakdown of components of blood and stromal tissue, and breakdown of cells of stromal part of endometrial tissue may explain the unique elevation of glycine (11). In another two (33%) patients with endometriosis, there were no detectable peaks. This result is comparable to that of Okada et al. (10) and Hascalik et al. (20), which did not find any signal in the spectra of endometrioma, possibly due to the susceptibility of hemosiderin.
Tubo-ovarian abscess and salpingitis
Tubo-ovarian abscess (TOA) is a late complication of pelvic inflammatory disease. TOA usually occurs in young women but rarely in postmenopausal patients. At MR imaging, TOA usually appears as a pelvic mass with low signal-intensity on T1-weighted images and heterogeneous high signal-intensity on T2-weighted images. A thin rim of high signal intensity in the inner most portion of the abscess on T1-weighted images is frequently found. Mesh-like strands in the pelvic fat planes due to dense pelvic adhesion or fibrosis are always found (24).
In patient, tubo-ovarian abscess showed lactate, lipid and glycoprotein peaks (Fig. 8) and salpingitis showed various lipid and glycoprotein peaks (Fig. 9). Lipid and lactate signals were obtained from all patients diagnosed with pelvic abscess in previous study of Hascalik et al.(20). Gotsis et al. reported that MRS demonstrated the presence of lipids in brain abscesses (25). Increased degenerative changes in the pelvic abscesses may lead to considerable cellular deaths, resulting in cellular necrosis, which appears in MRS as a lipid signal. In previous studies, lactate signal was detected in brain abscesses (13, 26). Lactate signal of pelvic abscess represents anaerobic glycolysis as well as hypermetabolic glucose consumption.
Paratubal cyst and follicular cyst
Paratubal cysts of the ovary appear as thin-walled and unilocular adnexal cyst, ranging from 3 to 8 cm in diameter. In our cases, a high single lipid peak was detected in paratubal cyst (Fig. 10) and follicular cysts (Fig. 11). But lipid concentration of follicular cysts was lower than that of dermoid cyst (Fig. 1d, e). Rich lipid content is present in follicular fluid, and our study of this by mass spectrometry is ongoing. The aerobic degradation of the excess of fatty acids is limited by the availability of oxaloacetate, and this will eventually produce a proportional amount of ketone bodies (27). A total of 131 chemical shifts and 42 metabolites were assigned in follicular fluid, including glucose, lactate, acetate, acetoacetate, pyruvate and β-hydroxybutyrate, to be identified (27). High correlations were found between these important intermediaries of the energetic metabolic pathways of the follicle which can indicate the importance of these pathways in oocyte development. Some of these identified metabolites might be useful as biomarkers of the follicular maturation state, allowing oocytes with a higher fertilization potential to be selected, thereby increasing pregnancy rates in women following in vitro fertilization treatments (27). The concentration of lactate is very high in functional follocle and fallopian tube secretions. Thus, lactate could provide an energy supply (perhaps via transformation to pyruvate by the granulosa cells) to the maturing oocyte in the follicle and in the first moments after ovulation (27). More knowledge of the biochemical metabolic composition of ovarian cyst may spur the development of in vivo MRS technique.
CONCLUSION
This article reviews the MRS findings of variable ovarian cystic lesions. MRS may effectively differentiate between benign, malignant tumors and abscess, and additional diagnostic tool for variable ovarian cystic lesions. We conclude that non-invasive proton nuclear magnetic resonance spectroscopy of ovarian cystic lesions can provide valuable information about the presence of low-molecular weight metabolites and evaluate their pathophysiologic mechanisms. Ultimately, MRS may differentiate ovarian tumors, provide useful diagnostic tools and follow-up of patients with ovarian cystic lesions.


 XML Download