

 PDF
PDF ePub
ePub Citation
 Print
Print


INTRODUCTION
A three-dimensional (3D) fully flow-compensated gradient-echo sequence is usually used to acquire both magnitude and phase images. The phase images are especially useful in revealing magnetic susceptibility, since the phase images after a high-pass filter illustrate small anatomic structures that may not be vividly displayed in magnitude images (1). The phase mask is conducted to suppress unwanted phase signals and enhance those from paramagnetic and diamagnetic substances. Paramagnetic substances such as iron, deoxyhemoglobin, methemoglobin, hemosiderin and ferritin cause a positive phase shift, while diamagnetic substances such as calcium show a negative phase shift (2). To increase image contrasts of small veins and susceptibility effects of various substances such as iron, ferritin, deoxygenated hemoglobin and calcium, the multiplication of magnitude images and phase masks creates the susceptibility-weighted image (SWI) that helps visualize magnetic susceptibility effects derived from various elements of the tissues (3). Because SWI is typically used to investigate venous blood effects, the phase masking method is chosen to enhance the vein contrast rather than a brain tissue contrast. If the vein looks bright in the phase images, the positive phase mask is chosen to enhance the vein signals; if the vein looks dark, the negative phase mask is used. In the below paragraphs, we used paramagnetic or diamagnetic phase mask rather than the positive or negative phase mask, respectively, because the magnitude images assess T2* effects, related to the dispersion of the magnetic resonance imaging (MRI) signal, while the phase images assess field shift effects because whether paramagnetic effects occur as positive or negative phase changes will depend on the vendor MRI system (4).
Voxel-based morphometry (VBM) is a technique to investigate structural brain differences among different subject populations in voxel-based comparisons without biasing one particular brain areas (5). Currently, a VBM analysis is well documented to investigate brain tissue alternations on 3D T1-weighted images. In addition, for the optimized VBM analysis for 3D T1-weighted images, brain tissues are usually segmented into gray matter, white matter, and others that are included in cerebrospinal fluid (CSF) and vascular components. The voxel-based analysis of SWI data may have advantages over the ROI-based analysis to investigate cortical brain areas as well as the subcortical brain areas without using any prior hypothesis. Many previous researches on SWI have used region-of-interest (ROI)-based analyses (6, 7). There are no studies on investigating voxel-based changes of brain tissues on SWI.
To enhance the brain tissue contrast rather than the vein contrast on SWI, it may be advantageous to use segmented SWI data of brain tissues to mask out non-brain components, such as CSF and vascular components. Furthermore, the voxel-based analysis of spatially normalized images is always smoothed by convolving with a Gaussian kernel. Smoothing has the effect of rendering the data more normally distributed. The smoothing kernel size should be optimized to increase the validity of parametric statistical tests. The objective of this study was to investigate effects of different smoothing kernel sizes on brain tissue-masked SWI to enhance the brain tissue contrast rather than the vessel contrast using voxel-based analyses. The smoothing kernel sizes were investigated by varying the smoothing factors during voxel-wise comparisons with masking brain tissues on SWI using segmented brain tissues obtained from 3D T1-weighted images.
MATERIALS AND METHODS
Image Acquisition
Twenty healthy human volunteers (mean age = 67.8, standard deviation (SD) = 6.09, range = 62 to 80, 14 females and 6 males) with no medical history of neurological diseases were studied after informed consent under the institutional review board-approved protocol. MR imaging was performed on a 3T clinical MR system (Achieva, Philips Medical Systems, Best, The Netherlands) equipped with an eight-channel sensitivity encoding head coil. A fully first-order flow-compensated 3D echo-shifted gradient-echo sequence ran to obtain axial magnitude and phase images to generate SWI data. The following parameters were used: repetition time (TR) = 24 ms, echo time (TE) = 34 ms, flip angel= 8°, Field of View (FOV) = 236 × 236 mm2, acquisition voxel size = 0.63 × 0.63 × 1.26 mm3, and reconstructed voxel size= 0.47 × 0.47 × 0.63 mm3, which was later reconstructed to 1 × 1 × 1 mm3 for post-processing and voxel-based statistical analyses. In addition, 3D T1-weighted images were acquired with the sagittal structural magnetization-prepared rapid acquisition of gradient-echo sequence for brain tissue segmentation and imaging registration to the brain anatomy template. The imaging parameters used were as follows: TR= 8.1 ms, TE= 3.7 ms, flip angel = 8°, FOV= 236 × 236 mm2, and voxel size = 1 × 1 × 1 mm3.
Post-Processing
To create SWI data, SPIN software (Wayne State University, MI, U.S.A., http://www.mrc.wayne.edu) was used. The phase images were filtered by using a 64 × 64 high pass filter to diminish low frequency components (3), which was followed by a masking process; a paramagnetic phase mask was performed to linearly scale all the positive phase values (PSWI) because vein signals in phase images appeared bright in our case. Additionally, to compare images generated from the paramagnetic phase mask, a diamagnetic phase mask was also performed to the same high-pass filtered phase images to linearly scale all the negative phase values (NSWI). Because the diamagnetic phase mask enhanced a few soft tissues while suppressing vein signals, it is assumed to reduce the susceptibility effects revealed in the SWI. The magnitude images were then multiplied by the paramagnetic or diamagnetic phase masks four times to create positively phase-masked SWI (PSWI) and negatively phase-masked SWI (NSWI), respectively. The phase multiplication of four produced the most optimal contrast-to-noise ratio in SWI (3).
To obtain brain-tissue masked SWI, the coregistration and normalization steps were achieved using a statistical parametric mapping-version 5 (SPM5) program (Wellcome Department of Imaging Neuroscience, University College, London, U.K.). For each subject, the 3D T1-weighted images were overlaid with the magnitude images of the 3D gradient-echo images for coregistration and were then spatially normalized to a standard 3D T1-weighted brain template, which was created by averaging 123 brains of the elderly (mean age = 68.2, SD = 8.6) using a 12-parameter nonlinear transformation (8). The transformation parameter obtained from the 3D T1-weighted image for each subject was applied to normalize magnitude, PSWI, and NSWI which were interpolated to the 1 × 1 × 1 mm3 voxel size. The spatially normalized 3D T1-weighted images were segmented into gray matter (GM), white matter (WM), and other brain components including CSF and large vessels.
In order to focus our interest on only the brain tissues, the spatially normalized PSWI and NSWI data were first weighted by the tissue contents of the brain and were masked based on the tissue-containing level of the voxels; only those containing more than 50% of the tissues were considered or disregarded otherwise. In short, the following equation was applied for tissue masking: SI × (GM + WM) × [(GM + WM) > 0.5], where SI is the signal intensity of the single voxel in PSWI or NSWI data, GM is the portion of the gray matter volume within a voxel and WM is the portion of the white matter within a single voxel, where CSF (Cerebrospinal Fluid) + GM + WM = 1.0. After the masking process, both brain-tissue masked PSWI and NSWI data were smoothed using four different smoothing kernel sizes that were isotropic 0 mm, 2mm, 4 mm, or 8 mm Gaussian kernels to investigate effects of smoothing on voxel-based comparisons.
Statistical Analyses
All voxel-based statistical analyses were achieved using the SPM5 software. In order to investigate paramagnetic and diamagnetic phase masks with different smoothing kernel sizes, the voxel-based comparisons of the smoothed PSWI and NSWI data were performed using the paired t-test between PSWI and NSWI for each smoothing kernel size. The gender and age information of each subject was included as covariates. The threshold for the significance was p= 0.005 with the family-wise error (FWE) rate for the multiple comparisons with a threshold looking for clusters with at least 10 contiguous voxels.
RESULTS
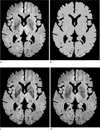
The representative brain-masked magnitude image, phase image, PSWI and NSWI are shown in Fig. 1. It is to be noted that the susceptibility image contrast increases from the magnitude image to PSWI and NSWI. In addition, PSWI revealed greater susceptibility contrasts than NSWI. There are no signals in the CSF areas because these areas were masked out prior to the analyses.
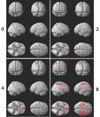
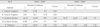
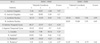
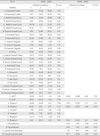
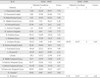
The results of voxel-wise comparisons between PSWI and NSWI of brain-masked SWI data for four different smoothing kernel sizes are shown in Fig. 2. The significance of comparisons increased with increasing the smoothing kernel sizes as the wider colored regions in larger smoothing kernel sizes indicate. The kernel sizes of zero and two may be too small to use for satisfying the Gaussian theory for each voxel. The kernel size of eight, however, may be too large to use because the result may highlight regions that are not so statistically significant. In the most of the voxels, signals from NSWI were greater than those from PSWI. The bilateral different areas were found on the parietal lobule, anterior cingulate, frontal gyrus, precuneus, globus pallidus, putamen, caudate, thalamus, and hypothalamus. The Talairach coordinates, which is a coordinate system used to describe the location of brain structures that are independent of different brain sizes and shapes, and anatomical information corresponding to these regions showing differences with Z-score, defined as a number of standard deviations data above the mean used to compare a sample to a standard normal distribution, higher than 6 are summarized in Table 1 for a smoothing factor of 0, in Table 2 for a smoothing factor of 2, in Table 3 for a smoothing factor of 4 and in Table 4 for a smoothing factor of 8.
DISCUSSION
The main objective of this study was to investigate voxel-based differences of signal intensities of the paramagnetic phase-masked SWI data and the diamagnetic phase-masked SWI data with varying the smoothing kernel sizes. The smoothing kernel size of four could be optimal to use voxel-based comparisons on SWI data. Cortical and subcortical areas in the brain were found in differences of tissue signal intensities affected by the two different phase masks.
Effect of the smoothing kernel size on SWI data
Voxel smoothing for a voxel-based analysis is required to generate data in normal distributions. Although the voxel-based analysis is well documented to 3D T1-weighted images, there are few studies on investigating voxel-based changes of brain tissues on SWI. Our result showed that the smoothing kernel size of four was the most reasonable. When the kernel sizes were too small, then there may be the violation of Gaussian distribution of data. When the kernel size was too large, on the other hand, the results may show regions that are not so statistically significant. The Gaussian filter of 2 times or 3 times greater than a voxel size is applicable for analyzing 3DT1 weighted images, but the kernel size of eight, which is eight times greater than a voxel size is too great for perform a voxel-based analysis of SWI. Therefore, the voxel-based analysis on SWI data should be carefully used with the optimized steps that should be included in the generation of the SWI brain template, normalization, and in the spatial smoothing. In this we only investigate the spatial smoothing factor on SWI data. Therefore, further investigations must be performed.
Effect of the brain tissue mask
On the paramagnetic phase-masked SWI data, signal losses were usually found on the venous vessels. In this study, this contribution was minimized by applying brain tissue masks. The differences between PSWI and NSWI should be caused by susceptibility differences in the brain tissues rather than the venous blood vessels. Dephasing effects existed within the tissue contents of the brain that were not limited to the venous blood vessels and those caused susceptibility effects in brain tissues. A previous study showed that intracortical contrast was predominantly caused by variants in tissue iron contents and established the direct relationship between intracortical iron variants and susceptibility-based contrasts (9). Another previous study showed that the local variations in magnetic susceptibility appeared to originate from iron stores within the cortical substructures (10). In addition, the brain tissue-masked SWI data should reduce partial volume effects caused by CSF and blood vessels. Therefore, for the voxel-based analysis of SWI data, it should be better to use brain tissue masks using the high resolution 3D T1-weighted images.
Possible applications of voxel-based analysis of SWI data in patients' cortical brain areas
In this study, we showed possibility of applications of voxel-based analysis of SWI data to investigate human brains in cortex and subcortex areas. In addition, the results of ROI-based analysis supported the results of the voxel-based analysis. Signal intensities in the rich iron content areas, putamen and sustantia nigra, showed almost all differences to other selected ROIs. Our study thus verified the previous studies, which identified certain anatomical regions showing increased iron-contents, by revealing that SWIs successfully differentiated anatomical regions known for rich iron depositions (2, 3, 9). On several previous studies, the ROI-based analysis of SWI data have widely been applied for identifying a number of diseases including vascular malformation, venous thrombosis, brain tumors, trauma, stroke, cerebral microbleeds, subarachnoid hemorrhage, pial siderosis, and multiple sclerosis (11). Although our study focused on SWIs from normal healthy subjects, the voxel-based investigation of SWI data aid in future clinical researches.
Limitations of this study
One limitation of this study was the uncertain relationship between phase signals and the susceptibility effects. Although phase images contain information on susceptibility differences, the phase contrast does not fully correspond with the susceptibility differences; therefore, one cannot easily conclude that the final SWIs produced by the phase mask multiplication purely enhanced the susceptibility effects. It is thus important to quantify and solely extract the susceptibility information from the acquired phase images (1, 12-14). The previous studies on quantitative susceptibility mapping accurately estimated the susceptibility and chemical shift of various diamagnetic and paramagnetic materials (15-16). Therefore, the future studies on magnetic susceptibility using SWI should be benefited from these quantitative susceptibility maps, which would exclusively reveal the susceptibility values within the voxels. Moreover, the long acquisition time for a 3DT1 weighted image in addition to SWI is required to perform the image analysis. Finally, the central filter size of 64 × 64 and the phase multiplication of four were applied in this study as suggested in the previous study by Haacke et al. (3). Those optimized parameters may not be optimal in investigations of voxel-based SWI data. Therefore, it may be re-optimized those values for a voxel-based analysis of SWI data.
CONCLUSION
Our study suggests that the smoothing kernel size of four could be optimal to use voxel-based comparisons on SWI data. To minimize partial volume effects and contributions of large vessels on SWI, the voxel-based analysis on SWI with masking out non-brain components should be advantageous. Thus, the voxel-based analysis of SWI should be applied to investigate clinical applications.
 XML Download