

 PDF
PDF ePub
ePub Citation
 Print
Print


INTRODUCTION
Diffusion weighted image-trace map (DWI) is a basic study for the detection of early infarction (1). The ADC map is also known as another important diffusion related parameter having additional clinical information (2-4). Acute infarction initially shows high signal intensity (SI) in DWI and evolves to low SI. On contrary, on the ADC map, low SI of the infarction changes to high SI according to the evolution. DWIs are widely used in various brain lesions including infarction. And the ADC map is considered as having a better value than the DWI in stroke, even though there are still a lot of controversies.
There is a report that the ADC map is more reliable and reproducible than the DWI in the lesion size in acute ischemic stroke for clinical studies (5). Further, ischemic lesion determination by ADC was more accurate in final infarction prediction, and provided exclusive information on ischemic lesion reversibility (6). The ADC may allow the identification of tissue at risk of infarction (4, 7), and ADC value is a potential parameter for predicting clinical outcome in acute stroke patients (1).
However, the ADC map has prominent artifact, and even though infarction itself shows more low SI than normal area, normal brain also shows diffuse low SI on the ADC map, and so the areas of infarction are less perceptible on ADC map than on DWI. In addition, there is a report that ADC map had lower reliability and excessive volume values in comparison to DWI (8). Furthermore, another report says the SI ratio on the DWI was better for identifying tissues at risk and predicting the final infarction than ADC ratio (9).
And so, this study was designed to re-evaluate the additional clinical significance of ADC map compared to the DWI in the inference of infarction stage by the observation of the patterns of infarction evolution on the DWI and ADC map.
MATERIALS AND METHODS
In 127 patients with cerebral infarction, including follow-up checks, 199 studies were performed using a 1.5 Tesla MRI system (Signa Excite, GE medical systems, Milwaukee,WI). The cases are only included in case of clear attack time of infarction and no evidence of accompanying hemorrhage.
MRI parameters were as follows: a spin echo EPI sequence with a b-value of 1000 s/mm2; 3 diffusion directions; repetition time of 3000 msec; echo time of 75 msec; matrix size of 160 × 160; 22 cm FOV; as well as 2 NEX and 5 mm slice thickness with 2 mm gap. They were classified as hourly (up to 24 hours of onset, 117 studies)-, daily (included only studies of more than 12 hours of onset, 108 studies)-, weekly (included only studies of more than 4 days of onset, 62 studies)-based groups.
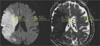
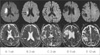
The SIs were measured at the core of the infarction and corresponding regions in the contralateral normal appearing area with region-of-interest (ROI) of 0.3 cm2 or more on the images of DWI and ADC map. Relative DWI SI ratio (rSIDWI) was calculated by the SI of the infarction area / contralateral normal area on the DWI, and relative ADC ratio (rADC) was also calculated by the ADC value of the infarction area / contralateral normal area on the ADC map (Fig. 1). And, the mean values were calculated and compared the changing patterns of the ratios in each group according to the evolution of the lesions by the time course.
RESULTS
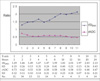
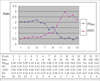
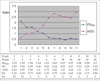
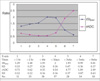
In the hourly-based analysis, the rSIDWI increased to 1.29 within one hour, and continuously increased to 2.13 at 24 hours, and the rADC decreased to 0.73 within one hour, and continuously decreased to 0.47 at 24 hours after stroke onset (Figs. 2, 3). In the daily-based analysis, the rSIDWI was 2.05 within the first day, and peaked to 2.22 in the 6th day, and decreased to 1.02 in the 30th day, which means contrast lost, and continuously decreased to the lowest value of 0.41 at the 120th day after stroke onset. The rADC showed the lowest value of 0.46 within the first day, and increased to 1.03 in the 15th day, which means contrast lost, and continuously increased to the highest value of 2.94 at the 60th day after stroke onset (Fig. 4). In the weekly-based analysis, the rSIDWI was 2.13 in the first week, and decreased to 1.03 in the 6th week, which means contrast lost, and continuously decreased to the lowest value of 0.44 at the 18th week. The rADC showed the lowest value of 0.63 in the first week, and increased to 1.04 in the third week, which means contrast lost, and continuously increased to the highest value of 2.92 at the 26th week after stroke onset (Figs. 5, 6). In the all case, the rSIDWI increased in an hour in the brain infarction, and continuously increased to the highest value of 2.0 in the third day, and decreased to low value of 0.99 after the third week. The rADC decreased in an hour, and continuously decreased to the lowest value of 0.54 in the third day, and increased to high value of 1.89 after the third week (Fig. 7). The change patterns of the rSIDWI and rADC showed as a linear function in chronologic order. And, though there was a trend of earlier transition on the ADC map than on the DWI according to the evolution of the infarction, the rADC curve showed inverse pattern to rSIDWI with no other information.
DISCUSSION
The DWI is a basic study and a better imaging method than the conventional MRI for the detection of early ischemic lesions (1), and the ADC map is also known as another important diffusion tensor imaging parameter, having additional clinical information like as the age, size, reversibility and outcome of the infarction (2-7). However, to have additional clinical significance on the ADC, the ADC map must have different evolution pattern compared to the DWI. If the evolution pattern in the ADC is same with the DWI, additional significance of the ADC would not present. And also, previous reports have some weak points like as not enough observation time courses in detail, not enough time duration and not many study case numbers. This study was designed to know the pattern of evolutions of the DWI and the ADC map of the infarction to know the additional clinical significance of the ADC map compared to the DWI in detail.
In this study, objects are not homogeneous in terms of infarction location and infarction size, collateral circulations and in time groups. Such many factors could contribute in the SI during the evolution of the infarction, and the SI itself is expressed by overall effect of those complex factors. And, thrombolysis cases, hemorrhagic infarction cases and reversible infarctions, which showed normalized SI on the follow up DWI during the first 3 days, were not included. Until now, infarction area is defined by increased signal on the DWI, and infarction itself usually has inhomogeneous SI with ill defined border. Because of inhomogeneous SI of infarction, the ROI is applied at the core of infarction as a representative portion showing the highest SI on the DWI, which is considered as typically damaged portion within the lesion of having heterogeneous SI. The ADC value is different by investigators, and considered it could be affected by the machine and the program used. There seems no report on the ADC value change in detail according to the time course in the infarction. Though the ADC value itself is an absolute value, to compare with rSIDWI, the rADC was calculated by the ADC value of the infarction area / contralateral normal area.
The SI on the DWI and the value of the ADC are continuously changing according to the evolution of infarction. In the ADC map, infarction area shows lower SI than normal area, but less peculiar than in the DWI because of low SI brain parenchyma in the ADC map. The ADC values are different according to the studies, and were reported as from 0.74 to 0.88 × 10⁻³ mm2/sec (2, 8) in the normal brain parenchyma. The ADC values of tissue at risk of infarction was 0.75 (7), and the ADC values of infarction areas were from 0.46 (10) to 0.66 (7). In this study, the mean ADC value in all normal parenchymal ROIs was 0.85 × 10⁻³ mm/sec, and 0.40 × 10⁻³ mm/sec in the infarction at 24 hours.
There are some reports on the ADC map as follows; Lesion size measured on the DWI and ADC values are potential parameters in the prediction of clinical outcome in acute stroke patients (1). The ADC map may be useful for estimating the lesion age (2). Relative ADC is less than normal during a day of stroke onset, then increased to pseudonormal levels at 15 days, and later increased than normal levels (5). In the daily-based analysis of this study, the rADC also increased to 1.03 in the 15th day, which means contrast lost. Ischemic lesion determined by the ADC was more accurate in the final infarct prediction, and provided exclusive information on ischemic lesion reversibility (6). The ADC and ratio of ischemic/control ADC values are more reliable and reproducible than DWI for the estimation of the lesion size in acute ischemic stroke (5). The rADC may help to predict infarct growth and final infarction size (7). Intermediate ADC values are present in the ischemic penumbra, and are indicative of tissue at risk of infarction (4). Heterogeneity in ADC and diffusion anisotropy evolution was observed not only between patients but also within individual lesions (11). The differences of ADC progression were depending on the patient's age and infarct etiology (12). Furthermore, the SI changes of the infarction area according to the time course could depend on the amount of previous blood flow and collateral flows. The ADC values within contrast-enhancing regions of CNS lymphoma may provide noninvasive insight into clinical outcome (3).
Abnormal SI was present on the DWI in patients within 24 hours of acute infarction, and in up to 94% of patients during the first 2 weeks after the attack. The percentage of abnormal findings declined with time, and no SI abnormality was seen in stroke patients of more than 2 weeks after onset (13). The SI of infarction on the DWI normalized at 57 days, which is substantially later than that of the previous suggestion (10). In the daily-based analysis of this study, rSIDWI decreased to 1.02 in the 30th day, which means contrast lost. The ADC map had lower reliability or excessive volume values in comparison to the DWI, and the DWI was the most reliable sequence for final infarction volume quantification (8). Pixel-based thresholds applied to the ADC maps or DWI SI were not accurate prognostic measures of tissue at risk. Quantitative DWI or ADC maps may provide added information, not obtained by visual inspection of the qualitative DWI. The SI ratio was better for identifying tissue at risk and predicting final infarction than ADC or ADC ratio (9).
In the hourly-based analysis, the evolution curve is increasing on the DWI and is decreasing on the ADC map continuously with inversed contrast (Fig. 3). In the daily-based analysis, the evolution curve is decreasing after peak value on the 6th day on the DWI and is increasing after the lowest value on the first day on the ADC map (Fig. 4). In the weekly-based analysis, the evolution curve is decreasing on the DWI and is increasing continuously on the ADC map after the first week (Fig. 6). The evolution curve of the ADC map according to the time course showed inversed pattern of the DWI by all cases (Fig. 7). Actually ADC map itself was same image with inverse contrast to the DWI according to the evolution curves, and so the analysis for the additional clinical significance seems have no meaning.
In summary, the rSIDWI was peaked with 2.22 in the 6th day, decreased to 1.02 in the 30th day, and the rADC showed the lowest value with 0.46 in 24 hours after stroke onset, and increased to 1.03 which means isointense SI or pseudonormalization in the 15th day, and the evolution pattern of SI on the ADC map is inversely correlated with the DWI.
 XML Download