

 PDF
PDF ePub
ePub Citation
 Print
Print


INTRODUCTION
Various injuries to the liver, including those caused by chronic liver diseases, can lead to hepatic fibrosis (HF) which is associated with an increased risk of hepatic dysfunction, portal hypertension, as well as the development of hepatocellular carcinoma (HCC) (1). The degree of HF is an important factor for determining the morbidity and mortality rates in these patients (2). In addition, it is important to evaluate HF not only for making the diagnosis but also for optimal treatment planning (3). Although liver biopsy has been extensively used as the standard method for grading HF (4), it has several limitations such as its invasiveness, sampling errors, intra- or interobserver variability, and poor patient acceptance (5). Therefore, there is a large clinical demand for alternative, non-invasive methods to evaluate HF. Until now, several non-invasive imaging tools have been used to assess the degree of fibrosis, including diffusion-weighted imaging (DWI), magnetic resonance elastography (MRE), and ultrasonography-based elastography (USE) techniques such as transient elastography (TE) and acoustic radiation force impulse (ARFI) imaging (6-8). Among these non-invasive tools used to evaluate HF, several studies have demonstrated that MRE is a promising non-invasive tool for the longitudinal evaluation of the degree of HF (7, 9) and that it showed a better reproducibility value than the reported values of other tests (5, 10, 11).
Recently, liver MRI using hepatobiliary contrast media such as gadoxetic acid (Gd-EOB-DTPA, Primovist®, Bayer-SheringPharma, Berlin, Germany) or Gd-BOPTA (multihance®, Bracco Imaging SpA, Milano, Italy) have drawn much attention as very useful components of the evaluation of various focal lesions as well as that of liver function (12, 13). In particular, with gadoxetic acid it is possible to obtain both dynamic imaging and hepatocyte-specific imaging during a single MR examination (14). However, as the peak hepatic enhancement with gadoxetic acid is usually reached 20~40 minutes following contrast injection (15), there may be a time gap between the dynamic phase imaging (~ 5 minutes following contrast injection) and the hepatobiliary phase imaging (HBPI). Therefore, in order to decrease the total examination time, several researchers have attempted to use the time between the dynamic phase imaging and the HBPI to obtain DWI or T2-weighted imaging (T2WI) (14, 16, 17). Several previous studies have recently demonstrated that post-contrast T2-weighted images (T2WI) or DWI obtained following the administration of gadoxetic acid, showed no significant difference in signal intensity or apparent coefficient values and could, therefore, be successfully used (14, 16, 17). Similarly we also speculated that MRE can be obtained during the time between dynamic phase imaging and HBPI following injection of gadoxetic acid, as was noted in the previous study results regarding post-contrast T2WI and DWI (14, 16, 17). However, considering that it is critical to obtain optimal-phase images in order to acquire an accurate stiffness map by MRE and the presence of the contrast agent in the liver may affect the phase changes of the protons in the liver owing to the paramagnetic effect of the agent (18), A previous study by Motosugi et al. (19) have demonstrated that liver stiffness measured by MRE did not differ before and after administration of Gd-EOB-DTPA. However, before post-contrast MRE with gadoxetic acid can be used in clinical practice, the influence of the contrast agent on the stiffness measurement needs to be re-confirmed, in population with chronic liver diseases including hepatitis B. Therefore, the purpose of this study is to evaluate the effect of gadoxetic acid on the stiffness measurement obtained on MRE for the staging of liver fibrosis.
MATERIALS AND METHODS
Study population
Institutional review board of our hospital approved this retrospective study and waived the requirement for informed consent. Between December 2009 and January 2010, 44 consecutive patients were included who had been referred for MR imaging to clinically evaluate either chronic liver disease or focal hepatic lesions. For all of these patients, we obtained MRE images both before and immediately following dynamic MR imaging performed after the injection of gadoxetic acid. Among these patients, 12 were excluded as their MRE images were of poor quality due to poor wave propagation on the wave images (n = 10) or to severe respiratory motion (n = 2). Finally, a total of 32 patients (23 males and nine females; age range, 29-82 years; mean age, 59 ± 13.75 years) were included, specifically, 23 men (mean age, 60 ± 12.25 years; range, 33-80 years) and nine women (mean age, 58 ± 17.76 years; range, 29-82 years). In 32 patients, the causes of their chronic liver disease were chronic hepatitis B (n = 12), chronic hepatitis C (n = 3), non-alcoholic steatohepatitis (n = 1), alcoholic steatohepatitis (n = 1), and unknown (n = 2), whereas 13 patients had no chronic liver disease. Fourteen of the 32 patients had histologically diagnosed of HF through operation (n=11) or percutaneous liver biopsy (n=2). The pathological HF stages determined using the METAVIR score (20, 21) were as follows: F0 (n = 2); F1 (n = 2); F2 (n = 4); F3 (n = 1); and F4 (n = 5).
Imaging technique
MR examinations were performed on a 1.5-T whole-body MR scanner (SignaHDx; GE Healthcare, Milwaukee, WI) with an eight-channel torso phased-array coil. All images were obtained either in the axial or coronal plane. The baseline liver imaging protocol included the following sequences: a respiratory-triggered T2-weighted rapid acquisition relaxation-enhanced (RARE) sequence; a T2-weighted single-shot fast spin-echo (SSFSE) sequence; a breath-hold T1-weighted dual echo (in-phase and opposed-phase) spoiled gradient recalled echo (GRE) sequence; and a T2*-weighted GRE sequence.
Dynamic three-dimensional (3D) fat-saturated spoiled gradient-echo sequences [liver acquisition with volume acceleration (LAVA)] were obtained both before and after intravenous administration of gadoxetate disodium (Primovist®, Bayer-SheringPharma, Berlin, Germany) at a dose of 0.025 mmol/kg (0.1 mL/kg body weight) at a rate of 1.5 mL/s and followed by a 30-ml saline flush. Using an MR fluoroscopic technique, hepatic arterial phase images were obtained nine seconds following the arrival of contrast medium at the descending thoracic aorta, after which two additional sequential axial image sets were obtained at 10-second intervals during the first minute after the hepatic arterial phase, thereby obtaining both portal phase and hepatic venous phase images. Additional, late dynamic phase imaging and hepatobiliary phase images were then obtained three minutes, 10 minutes, and 20 minutes, respectively, following the contrast injection.
MR Elastography
MRE was performed on a 1.5-T whole-body MR unit (Signa HDxt, GE Healthcare, Wis) using a cylindrical passive driver and an active generator (MR-Touch, GE healthcare) and an 8-channel body array coil. A 19-cm diameter, 1.5-cm thick, cylindrical passive longitudinal driver was placed against the right anterior chest wall and the center of the driver was carefully put at the level of the xiphisternum. The passive driver was held in place using an abdominal binder. Continuous longitudinal vibration at 60 Hz transmitted from the active driver to the passive driver through a flexible vinyl tube, was used to produce propagating shear waves in the liver (22). To capture the propagation of the shear waves over a full period of motion, the gradient-echo MRE sequence was used to collect axial wave images sensitized along the through-plane direction of motion. The measurement parameters of the MRE gradient echo sequence were as follows: repetition time/echo time, 100/26.8 ms; flip angle, 30°; field of view, 32~37 cm; matrix size, 256 × 64; slice thickness, 10 mm; and a 5-mm interslice gap. Two MRE slices were obtained for each examination.
Patients were instructed to hold their breath when each slice was being obtained. MRE was repeated twice to four times in different levels of the liver. The MRE acquisition of each slice required two breath-holds and each breath-holding time was approximately 16 seconds. To gain a consistent position of the liver for each phase offset, patients held their breath at the end of expiration. After the data acquisition was completed, the wave images were automatically processed by the host computer of the MRI system in order to generate elastograms depicting the shear stiffness in kilopascals (kPa), as previously described (23). This MRE sequence was performed before the contrast media injection and repeated 10~ 20 minutes after the contrast media injection. Identical parameters and positioning of the slices were used for both the pre- and post-contrast acquisitions.
Image Evaluation
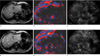
The mean liver stiffness values of the hepatic parenchyma were calculated by placing multiple regions of interest (ROI) on the pre- and post-contrast MRE images, respectively. The ROIs were placed by two independent reviewers who were blinded to each patient's history and to the other imaging tests results. ROIs were drawn three times in the magnitude image obtained using the MRE sequence acquired prior to contrast injection. These ROIs could then be copied to the corresponding position on the stiffness map acquired before and after contrast administration and which gave the stiffness values in kilopascals. For the ROI measurement, ROIs were placed on the wave images where wave propagations were regular and were relatively free of reflections and interference patterns (24). The ROIs were also usually placed on the mid-portion of the right lobe of the liver, thus avoiding large hepatic vessels and their large branches, liver edges, and motion artifacts. We measured the liver stiffness using 3 ROIs from each of the two, selected MRE slices of the pre- and post-contrast MRE images. The average liver stiffness values (kilopascals: kPa) were calculated as the averaged mean of 6 ROIs obtained from the MREs both before and after the contrast administration.
Statistical Analysis and Definition
The mean liver stiffness values of the hepatic parenchyma between the pre and post-contrast MRE examinations were compared using the paired t-test. Intra-rater and inter-rater correlation was assessed using the intraclass correlation coefficient (ICC). We assessed the diagnostic performance of MRE in 14 Patients with histological HF staging using METAVIR score. We calculated the accuracy, sensitivity, specificity of pre- and post-contrast MREs for differentiating ≥ F2 from ≤ F1 using cutoff value of 3.1 kPa (25). All statistical analyses were performed using commercial software (SPSS, version 17, SPSS, Chicago, IL; MedCalc, MedCalc Software, Mariakerke, Belgium; and Instat 3.05, Graph-Pad Software, San Diego, CA). A p value less than 0.05 was considered to indicate a significant difference.
RESULTS
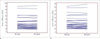
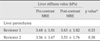
The mean liver stiffness value of the background liver parenchyma measured on pre- and post-contrast MREs are summarized in Table 1. There was no significant difference in the liver stiffness values of the background liver parenchyma in the pre- and post-contrast MREs, i.e. 3.68 ± 1.81 kPa vs. 3.63 ± 1.82 kPa for reviewer 1 and 3.56 ± 1.67 kPa vs. 3.53 ± 1.76 kPa for reviewer 2 (p = 0.15 and 0.38 for each reviewer, respectively) (Fig. 1). There was also no tendency toward an increase or decrease in the stiffness values seen on post-contrast MRE compared with the pre-contrast MRE values (Fig. 2). Regarding intra-rater correlation, excellent agreement was noted on rater 1(ICC = 0.998) and rater 2 (ICC = 0.996). Accoring to inter-rater correlation, excellent agreement was noted on pre-contrast (ICC = 0.988) and post-contrast (ICC = 0.993).
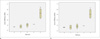
The mean liver stiffness values measured on pre-contrast and post-contrast MRE constantly increased as the fibrosis stage (Fig. 3). The mean stiffness values of F0, F1, F2, F3, and F4 were as follows: 2.62 kPa, 2.71 kPa, 2.99 kPa, 3.12 kPa and 5.24 kPa, respectively. The accuracy, sensitivity, and specificity of the pre- and post-contrast MREs for differentiating significant HF ( ≥ F2) from ≤ F1 were same as 71%, 60%, and 100%, respectively.
DISCUSSION
In our study, there was no significant difference in the MRE liver stiffness values obtained either before or after gadoxetic acid administration (p > 0.05). This result suggests that MRE can be performed between the dynamic imaging and the HBPI following injection of gadoxetic acid. The results of our study correspond well with those of the earlier study which reported that the liver stiffness measured by MRE did not differ before and after gadoxetic acid was administered (19). Based on our study results, it may be possible to obtain MRE in order to evaluate the stage of liver fibrosis as part of a liver MRI study in patients with suspected liver disease and without a change in the total time required to obtain a routine liver MRI scan. There have been several studies demonstrating the promising diagnostic performance of gadoxetic acid-enhanced liver MRI for detecting primary and secondary liver malignancies, compared with that of other imaging modalities such as MDCT or extracellular contrast-enhanced dynamic liver MRI (26-28). Considering that many patients with HCC may also have a chronic liver disease such as chronic hepatitis B or C, alcoholic hepatitis or cirrhosis or non-alcoholic steatohepatitis, providing information regarding the hepatic stiffness as well as detecting HCC would be helpful in order to determine the optimal therapy (29, 30). Furthermore, chemotherapy-induced steatohepatitis in patients with colorectal liver metastases following systemic chemotherapy, also increases the risk of developing postoperative hepatic failure (31, 32). Therefore, detecting increased hepatic stiffness values in addition to the information obtained regarding secondary liver malignancies using gadoxetic acid enhanced MRI in conjunction with MRE would be of great value for hepatic surgeons.
In addition, in our study, excellent intra- and inter rater agreement was noted. Our study results are in good agreement with the results of previous studies showing that MRE had at least an equally high reproducibility of the liver stiffness measurement compared with DW-MRI and transient elastography (8, 33). Considering that the noninvasive imaging tools used to evaluate liver fibrosis could also be used to determine any longitudinal changes occurring before or after anti-fibrotic treatments, the high reproducibility of MRE could be of substantial value.
Consistent with information presented in previous reports, the mean liver stiffness values, as measured by MRE, increased along with the fibrosis stage according to the METAVIR score. Our results were similar to those of some previous studies (7, 10, 34). For differentiating ≥ F2 from ≤ F1 using cutoff value of 3.1 kPa, MRE showed an accuracy of 71%, sensitivity of 60% and a specificity of 100%. Our study results are, therefore, similar with Kim et al. (35). They reported a sensitivity of 89.7% and a specificity of 87.1% for discriminating ≥ F2 from < F1 with a cutoff value of 3.05 kPa. Clinically, differentiating between stage ≥ F2 and stage F0-1 is important because patients with fibrosis stage F2 have an increased risk for developing cirrhosis along with its complications, including ascites, encephalopathy, and portal hypertension (11, 36). In fact, diagnosing advanced fibrosis or cirrhosis (F3 or F4) is also important because advanced fibrosis is associated with a decreased likelihood of sustained response to treatment (21, 37, 38). However, it is more important to diagnose significant fibrosis ( ≥ F2), considering that active treatment at the F2 stage would be beneficial for preventing further liver fibrosis aggravation (11, 36). As our study showed, MRE may be helpful in predicting a patient's prognosis as well as for determining the optimal treatment plan.
Our study has several limitations. First, as mentioned earlier, although the reviewers selected areas for drawing the ROIs according to strict rules in order to avoid large hepatic vessels and their large branches, liver edges, and motion artifacts, these selections could, in fact, have been rather subjective. Recent programs, such as the confidence map, have been developed in order to overcome this subjectivity (39). These programs display both reliable and unreliable areas on wave images and can, therefore, help in selecting the optimal area. Second, only a small number of study patients who had the pathological grade of HF, were included. Third, our sample size was small, which limited the power of the data analyses. Fourth, the chronic liver disease and/or cirrhosis in our study population had various causes. As it is possible that the cutoff values of MRE for each stage of fibrosis may differ depending on the etiologies of chronic liver diseases, in order to provide optimal cutoff values for detecting early-stage fibrosis, further studies with large study populations will be necessary.
In conclusion, as there was no significant difference in the measured stiffness values of pre- and post-contrast MREs, it would, therefore, be to perform MRE following administration of gadoxetic acid in order to estimate the liver fibrosis stage.
 XML Download