

 PDF
PDF ePub
ePub Citation
 Print
Print


INTRODUCTION
The kidneys receive 25% of the cardiac output, which is the highest in the body with respect to organ weight (1). Most of the blood flow passing through the kidney is directed towards the cortex to facilitate glomerular filtration and reabsorption of the solute. Low blood flow to the renal medulla creates the osmotic gradients necessary for urinary concentration and water conservation. Moreover, the large amount of oxygen use in the ascending thick rim causes the medulla to be more hypoxic (2). A low renal medullary oxygenation level is thought to be a predisposing factor in the development of ischemic disease, such as acute renal failure (3). It is also believed that renal medullary hypoxia may play a role in the pathophysiology of hypertension (4). Increased oxygen consumption in early diabetic nephropathy due to increased glomerular filtration has also been reported (5). Therefore, an efficient method for evaluating the oxygen level in the human kidney is needed.
Blood oxygen level-dependent (BOLD) magnetic resonance imaging (MRI) was first adopted in the field of brain imaging by Ogawa et al (6). Hemoglobin has a high affinity to oxygen, forming oxyhemoglobin under aerobic conditions. After oxygen delivery in the local tissue, oxyhemoglobin is converted into deoxyhemoglobin. Oxyhemoglobin is diamagnetic, but deoxyhemoglobin is paramagnetic, which changes the magnetic susceptibility in blood according to the level of deoxyhemoglobin. An increased level of deoxyhemoglobin causes the acceleration of spin dephasing in tissue, resulting in a shortening of T2* decay in neighboring water molecules. The rate of spin dephasing R2* (=1/T2*) is commonly used to assess oxygenation changes quantitatively in renal BOLD MRI (7). R2* is directly proportionate to the deoxyhemoglobin level. An increased R2* value implies that the oxygenation of hemoglobin has decreased and that the tissue is in a more hypoxic condition.
It is well known that a higher field strength increases the inherent signal to noise ratio and spatial resolution. The BOLD effect is shown to be proportional to the static magnetic field B0 for large vessels, and to B02 for small vessels (8). Previously, most renal BOLD applications have been at 1.5 T. There are a few reports of renal BOLD MRI with 3.0 T that confirmed an increased R2* value at higher magnetic fields (9, 10); however, the number of subjects in those studies is small, and the reports mainly focused on feasibility and the effects of diuresis. In this study, we aimed to provide normal reference values for R2* through using a relatively large number of human participants, and to evaluate the gender and location differences of the R2* value in human kidneys as well as the variance of the measured values with 3.0 T MR.
MATERIALS AND METHODS
Participants
This study was approved by our institutional review board. All of the participants gave informed consent after an explanation of the study. From May 2007 to August 2007, 24 healthy volunteers (11 males and 13 females) aged 24 to 40 years (mean age: 29 ± 4.3 years) were enrolled in this study. No participants had any previous medical history of renal disease or disease affecting the kidney; no participants had morphological abnormalities in either kidney as evaluated by conventional MRI; and no participant was required to abstain from food or water. In addition, all MRI examinations were performed in the afternoon or evening; therefore, all of the participants were well hydrated.
MR Imaging
All studies were performed on a 3.0 T system (Intera Achieva, Philips Medical Systems, Best, the Netherlands) using a six-channel sensitivity-encoding (SENSE) cardiac coil. For anatomical evaluation, a coronal T2-weighted multishot fast spin echo sequence was performed before BOLD imaging. Presence of morphological anomaly and focal renal lesion were evaluated. BOLD MRI was performed using a multi gradient echo-echo planar imaging sequence with seventeen echoes in the coronal plane. Each set of seventeen T2* images was acquired during a single breath-hold of 10.1 sec. The scan parameters were as follows: repetition time, 39 ms; echo time,14-39 ms with an inter-echo spacing time of 1.47 ms; slice thickness, 5 mm; flip angle, 30°; field of view (FOV), 360 mm; acquisition matrix, 256×256; and bandwidth, 779.5 Hz. Any image distortion from susceptibility artifact or motion artifact was evaluated and recorded.
R2* Calculation
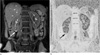
The acquisition of R2* was performed in two steps. First, the T2* relaxation time of the tissue was measured and then R2* was calculated according to the equation (R2* = 1/T2*). T2* maps were generated by using IDL-based PRIDE research software (Philips Medical Systems, Best, the Netherlands) in a standard workstation. The intensity according to various echo time data was fit to a single exponential curve to calculate the T2* relaxation time. Six regions of interest (ROI) were drawn at both the cortex and medulla in the lower, middle, and upper pole of each kidney. In total, twelve ROIs were obtained from every volunteer and all ROIs were drawn by a single uroradiologist who has 8 years of experience in uroradiology. The ROIs were located exclusively in the cortex (Fig. 1) and medulla. Each ROI included at least 20 pixels, minimizing the variation of the selected area and automatically duplicatged on T2* map (Fig. 1b). Vessels and renal sinus were carefully excluded to avoid sampling errors due to partial volume averaging or dephasing caused by moving blood.
Data Analysis
The statistical differences of R2* values in the cortex and medulla, males and females, and the left and right kidney were analyzed using the student t-test, after confirming the normality of the R2* distribution using Kolmogorov-Smirnov test. One-way analysis of variance (ANOVA) was performed to evaluate the location differences among the R2* values obtained from the lower, middle, and upper pole. All analyses were performed using SPSS for Windows software, version 15.0 (SPSS Inc, Chicago, USA) and Medcalc 9.6.2.0 (Medcalc software, Mariekerke, Belgium).
RESULTS
No participants had a morphological anomaly on the T2-weighted spin echo image performed for anatomical evaluation. Only small simple cysts were seen in three of 24 volunteers. The acquisition of BOLD MRI was successful in all participants. There was no severe image distortion from susceptibility artifact due to high magnetic field or motion artifact in any case. The cortex and medulla were clearly demarcated on the T2* map for all of the volunteers, and ROI could be consistently drawn.
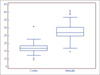
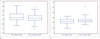
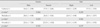
The mean R2* value in the cortex was 17.1 ± 2.60 s-1 and the mean R2* value in the medulla was 27.7 ± 4.83 s-1. The student t-test revealed that there were significant differences between the medulla and cortex (p < 0.001) (Fig. 2). Table 1 lists the R2* values of the different genders and sides. Overall, the R2* values are not statistically different between male and female volunteers. However, the R2* value in the medulla was significantly higher in the male volunteers than in the females (p=0.025) (Fig. 3a); whereas, there was no significant difference in the cortical R2* values between the genders (Fig. 3b). The R2* values between the right and left kidney were not statistically different.
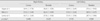
Table 2 shows the R2* values obtained from the lower, middle, and upper pole in each kidney. One-way ANOVA revealed that there were no significant differences among these R2* values.
DISCUSSION
Our study showed a significantly higher R2* value in the medulla than the cortex. The R2* value is directly proportional to the level of deoxyhemoglobin; therefore, higher R2* values in the medulla signify that the level of deoxyhemoglobin is high in the renal medulla. This finding also indicates that the oxygen saturation of the medulla is lower in the cortex, creating a relatively hypoxic state. This relative medullary hypoxia was reported in previous BOLD MRI studies with a 1.5 T machine (7, 11-14). The measured R2* values in our study were higher than those reported in humans using 1.5 T MRI (7, 15, 16). According to the reports of Hoffman et al., the ranges of baseline R2* values were reported to be from 9.7 to 13.1 s-1 (mean 11.2 ± 0.8 s-1) in the cortex and from 13.3 to 20.7 s-1 (mean 16.8 ± 2.2 s-1) in the medulla in studies of 30 volunteers using a 1.5 T machine (16). In our study, R2* values were approximately 1.5 to 1.6 times those previously reported using 1.5 T, reflecting the theory that the increased R2* values are probably due to a higher external gradient.
There are a few studies about R2* values using a 3.0 T MRI machine. Li et al. reported that the baseline R2* values were 21.8 ± 1.2 s-1 in the cortex and 37.4 ± 1.2 s-1 in the medulla using 3.0 T MRI (9). In addition, Tumkur et al. reported that the baseline R2* values were 14.5 ± 0.6 s-1 and 30.3 ± 1.1 s-1 in the cortex and medulla, respectively (17). Our R2* values measured in the cortex were between the R2* values of these two reports; whereas, our medullary R2* value is lower than the previously reported values. It is probable that this finding results from the fact that the volunteers in the previous studies were required to abstain from food and water, while the participants from our study were normally hydrated. Dehydration facilitates urine concentration in the thick ascending loop of Henle, resulting in increased oxygen consumption, which makes the medulla more hypoxic (18).
It is noteworthy that the measured medullary R2* values were significantly higher in male than in female participants (Table 1). This result means that the renal medulla of males is more hypoxic when compared to that of females. Similar decreased medullary R2* values in male than in female were observed in the previous study (16), although statistically not significant. It has been postulated that gender difference may originate from the estrogenic influence in the modulation of renin-angiotensin or nitroxide formation (19, 20). Although the mechanism of this gender difference is not clear, this relative medullary hypoxic condition in men might be an explanation of the more rapid decline in renal function in men than in women from several renal disease such as chronic renal failure, including nondiabetic renal disease, polycystic kidney disease, membranous nephropathy, and IgA nephropathy (21).
An increase in R2* values with increasing age was observed in the previous reports by Simon-Zoula et al (13). This finding implies that the renal medulla of older people is more hypoxic than that of younger people. They hypothesized that the higher iron content in the medulla from a lifelong accumulation of iron might influence the local field in the homogeneity of the tissue, leading to an increased R2* value in older people (22). Theoretically, a higher magnetic field is not always beneficial to susceptibility imaging, including BOLD MRI. Chemical shift, susceptibility, flow, and patient motion artifacts are more obvious at higher field strengths, which might be unfavorable for BOLD imaging of the kidney (9). However, all T2* maps in our study were properly generated and no severe artifact distorting the maps was present in any case. Volunteers only had to hold their breath for 10.1 sec per slice, which made them comfortable during the imaging. Considering that a higher magnetic field makes the R2* changes greater (9), we can postulate that the gender difference of R2* is more obvious in a higher magnetic field, but this finding needs to be validated further.
Fluid or food restriction and diuresis caused by water or drugs were not planned in this study because it was only focused on the estimation of baseline R2* values of normally hydrated individuals in 3.0 T. Therefore, the R2* values from our study can be reference values used for pathologic conditions under a similar imaging protocol.
Our study has a few limitations. First, ROI drawing was done by single radiologist for the technical consistency. Therefore, intra or interobserver variability for verifying reproducibility could not be assessed. Second, measuring R2* is not the exact measurement of plasma oxygen level in the tissue, but only an indirect marker reflecting oxygenation. Many factors such as oxygen supply and consumption, blood flow, hematocrit and respiration can affect local oxygenation (23). In our study, blood sampling for measuring hematocrit was not performed in the volunteers. Third, water was not restricted in our volunteers. It was our intention, because we want to know baseline normal R2* value compared with values from the patients with no water restriction. However, different hydration status among volunteers can be another confounding factor.
In conclusion, 3.0 T MRI could successfully and efficiently demonstrate the BOLD effect of the kidney. The gender difference of medullary R2* was demonstrated, which provides insight into the gender difference in the pathophysiology of renal diseases.
 XML Download