

 PDF
PDF ePub
ePub Citation
 Print
Print


INTRODUCTION
Ankle is one of the most complex human joints and is vulnerable to injury (1, 2). Imaging numerous ligaments and tendons that run in various planes is sometimes challenging. To overcome this problems, three-dimensional (3D) acquisition magnetic resonance (MR) imaging techniques, that allows multiplanar reconstruction and reduces partial-volume artifact by thinner imaging slice thickness, have been tested for its feasibility in ankle joint imaging (3, 4). Since the introduction of 3D fast spin-echo (FSE)/turbo spin-echo (TSE) isotropic imaging techniques to the musculoskeletal imaging (5), diagnostic performance or image quality comparison study between the 3D isotropic imaging sequences and the conventional two-dimensional (2D) sequences has been executed by many investigators to elucidate its possibility as a substitute tool for the 2D sequences in various joints (4-8). Many studies thoroughly evaluated the diagnostic performance of shoulder and knee joints using 3D spine-echo isotropic imaging (6, 7, 9-11). However, only a few studies have recently been published on the 3D spin-echo isotropic imaging of ankle joint (2, 4, 12).
It is well known that fat suppression (FS) allows conspicuous visualization of small anatomical details in fast spin-echo proton density or T2-weighted images (13), and the merit of FS in the visualization of small structures was verified in the several investigations of the knee joint MR imaging (14, 15). But there is no published literature comparing the 3D isotropic spin-echo imaging sequences with and without fat suppression for ankle joint imaging. Hence, the purpose of our study was to compare image quality between volume isotropic turbo spin echo acquisition (VISTA) with and without FS for ankle joint imaging. Additionally, with respect to the diagnostic point of view, we evaluated which of the two sequences more clearly traces the ankle ligaments.
MATERIALS AND METHODS
Subjects and MR examinations
Institutional review board approved this study in accordance with Health Insurance Portability and Accountability Act privacy guidelines. Informed consents were obtained from the volunteers. Signal-to-noise ratios (SNRs) were assessed from MR images of one volunteer without ankle sprain history (male; age, 28 year) and a phantom. Image contrast ratios (CRs) and the other imaging analyses were performed for MR images obtained from 10 right ankle of 10 non-symptomatic volunteers (3 men, 7 women; age, 28 ± 2.90 years). All volunteer and phantom images were obtained on a 3-T MR scanner (Gyroscan Intera Achieva; Philips Medical Systems, Best, The Netherlands) with a receive-only, eight-element phased-array dedicated ankle coil. A 3D TSE intermediate-weighted sequence with refocusing control VISTA with and without FS were performed for all subjects in sagittal plane. VISTA images were acquired utilizing a 3D TSE non-selective method, driven-equilibrium (DRIVE) radio frequency pulse, and an asymmetric TSE profile order (16). Spectral Attenuated Inversion Recovery (SPAIR) technique, which is a frequency-selective adiabatic inversion pulse utilizing the difference in resonance frequencies of water and fat (2), was used for FS. The coronal and axial reformations were performed with a slice thickness of 1 mm in orthogonal plane. The reformatted images were made by a technologist on the work station immediately after the MR imaging. The details of the MR protocol are described in Table 1.
Quantitative assessment - SNR
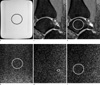
For quantitative assessment, the signal-to-noise ratio (SNR) and contrast ratio (CR) were calculated. To assess the SNR at parallel imaging, we measured noise via noise-only data (17, 18) from a phantom and a volunteer. A bottle phantom containing 2000 ml white mineral oil (liquid petroleum at 20℃, FAC phantom assembly; Invivo Corp., Orlando, FL, USA) with 27 cm in height was scanned with VISTA and VISTA SPAIR sequences. The phantom was positioned at the center of the magnetic bore and scanned in the sagittal plane. Noise-only data was acquired for each VISTA and VISTA SPAIR sequence with the radio frequency (RF) turned off. Both object and noise-only data were reconstructed offline to apply parallel imaging calibration weights, homodyne partial Fourier phase correction, and multichannel image combination to the noise-only data. To calculate the SNR of the phantom and one volunteer, 430.12 mm2 sized region-of-interests (ROIs) at the same position were placed twice in the reconstructed object images to measure mean signal intensities (SIs) and duplicated in the noise-only reconstructions to measure noise (16) (Fig. 1).
In the same way, object and noise-only data were obtained from a non-symptomatic volunteer and we placed ROIs in fluid, cartilage, muscle and bone marrow with the area as large as possible avoiding the inclusion of the adjacent structures (Fig. 1). We measured the SNR in VISTA and VISTA SPAIR with the following calculation:
SNR = mean of the object (Mobject)/standard deviation of the noise in the object (SDobject).
The power of the noise is often estimated from the standard deviation of the pixel signal intensity (SI) in an image region with no nuclear magnetic resonance (NMR) signal, so the SDobject was evaluated in the noise only image at the same location as was at the object image. For a Rician distribution in the absence of the signal, the SDobject is calculated as the mean of the noise image/1.253 (16, 19). So the SNR is defined like follows in conclusion:
Quantitative assessment - CR
CRs of the tissues were calculated between the tissues and joint fluid and between the tissues and fat in VISTA and VISTA SPAIR sequences. The assessed tissues were cartilage, tendon, and ligament. SIs from joint fluid (F) at the anterior or posterior subtalar recess, fat (f) at the Kager's fat pad, cartilage (C) at the tibial plafond, tendon (T) at the Achilles tendon and ligaments (anterior talofibular ligament, calcaneofibular ligament) were measured in all 10 patients in ROIs. ROIs were placed in the respective tissues, with the area as large as possible avoiding the inclusion of the adjacent tissues. The smallest size of a region-of-interest (ROI) was 3 mm2 in all tissues except in ligaments, where the smallest one was 2.0 mm2. CRs between the tissues and fluid and also between the tissues and fat were calculated by dividing the difference between the SI of the reference tissue and the SI of the compared tissue by the sum of the SI of the reference tissue and the SI of the compared tissue as follows:
CR = (SIref - SIctiss)/ (SIref +SIctiss) (SIref, the SI of the reference tissue; SIctiss, SI of the compared tissue) (21).
To ensure consistency, measurements were performed by one radiology resident (K.E.C, a third-year resident trainee). The CR of the cartilage to the synovial fluid, the CR of the tendon to the synovial fluid, the CR of the ligament to the synovial fluid were calculated for each sequence. In the same way, the CR of the cartilage to the fat, the CR of the tendon to the fat, the CR of the ligament to the fat were calculated for each sequence. SIs were measured twice for each tissue and the mean SI was used for CR calculation.
Ligament traceability
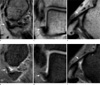
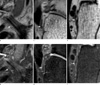
Two experienced musculoskeletal radiologists (Y.H.L. and S.K. with 7- and 11-year experience in musculoskeletal MR imaging, respectively) independently evaluated VISTA and VISTA SPAIR images using a picture archiving and communication system (Centricity Radiology RA 1000; General Electric Healthcare, Chicago, IL, USA) in random order. The time interval between the review session of VISTA and that of VISTA SPAIR was 2 months to avoid the recall bias. They were asked to score the traceability of anterior talofibular ligament (ATFL), posterior talofibular ligament (PTFL), calcaneofibular ligament (CFL), superficial deltoid ligament (sD), deep deltoid ligament (dD), anterior inferior tibiofibular ligament (AiTFL), and posterior inferior tibiofibular ligament (PiTFL) in all planes including sagittal source, axial reformatted, and coronal reformatted images respectively, based on a 4-point scale (1, not traceable; 2, barely traceable; 3, adequately traceable; 4, excellently traceable) (Figs. 2, 3).
Statistical analysis
For analysis of the differences in CRs between the VISTA and VISTA SPAIR images, the Wilcoxon signed-rank test was used. For analysis of differences in traceability between VISTA and VISTA SPAIR images, Fisher's exact test and Pearson's chi-squared test were used. A p value < 0.05 was considered statistically significant. Interobserver agreement in scoring of ligament traceability was assessed using kappa (κ) analysis in squared data, but percent agreement was used for the non-squared data. The κ value was interpreted as poor (0.00), slight (0.0-0.20), fair (0.21-0.40), moderate (0.41-0.60), substantial (0.61-0.80), and near perfect (0.81-1.00) agreement (22, 23).
RESULTS
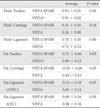
The results of SNR analysis are presented in Table 2. SNR of bone marrow was substantially lower and SNR of muscle was slightly lower in VISTA SPAIR sequence, whereas the SNRs of other tissues and phantom did not show significant difference between the sequences although the statistical comparison was not possible as just one volunteer's ankle and one phantom were assessed. The results of CR analysis of other tissues with reference to the fluid and fat are presented in Table 3. The mean CR of tendon was superior in VISTA SPAIR than VISTA with reference to the fluid, which was statistically significant. In terms of CR between fat and other tissues, VISTA was statistically superior in all tissues than VISTA SPAIR.
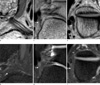
For ligaments traceability, CFL showed statistically significant superior score in VISTA than VISTA SPAIR (p < 0.05) (Fig. 4, Tables 4, 5, 6). VISTA showed superior traceability in the rest of six ligaments, but it was not statistically significant when the scores were being compared. The interobserver agreements of ligament traceability in VISTA and VISTA SPAIR are presented in (Tables 4, 5, 6). Most of them showed more than moderate (0.41-0.60) agreement except, sD in VISTA SPAIR, dD in VISTA and VISTA SPAIR of sagittal images, and sD and dD in both of VISTA and VISTA SPAIR of axial images.
DISCUSSION
3D isotropic spin echo sequences have overcome problems such as long acquisition and post-processing time by parallel imaging in both phase-encoding directions (24) and by partial Fourier acquisition (25). However, 3D isotropic imaging still takes quite a long time so that we need to choose the one between fat-suppressed and non-fat-suppressed sequences. Fortunately, the SNR of VISTA and VISTA SPAIR did not show notable difference in phantom and also in majority of tissues of a volunteer except for bone marrow, which contain fat component and was remarkably lower in VISTA SPAIR than in VISTA (7.65 vs. 36.64). The SNR of cartilage and fluid was almost equal in both sequences, which seems to be natural considering lack of fat in the tissues. SNR of the muscle is slightly lower in VISTA SPAIR than VISTA (16.40 vs. 19.23) presumably because muscle may contain small amount of fat.
Our study has shown that VISTA demonstrated superior or the same ligament traceability as compared with fat-suppressed VISTA. It is a notable result because fat suppression has been reported, by many investigators, as a way to improve performance of musculoskeletal MR imaging in tracing normal structure and in depicting pathologies by enhancing soft tissue contrast (13, 14, 26). Among the ankle ligaments in our study, CFL showed superior traceability in non-fat-suppressed VISTA than in fat-suppressed VISTA with statistical significance, whereas the other ligaments showed no statistically significant difference in ligament traceability. CFL is commonly injured ankle ligament, second only to ATFL. Hence, CFL is one of the most important structure to look at on the ankle MR images, and its poor traceability is expected to affect diagnostic performance of MR imaging. It is not clear why the CFL showed less traceability, but we speculate the causes are like follows. We obtained images from the volunteers who had no history of ankle sprain. However, obtaining absolutely healthy volunteer is hardly possible because many individuals, who have no memory of ankle sprain ever, might have minor/major sprain history. So we presumed that unexpected recurrent chronic sprains of CFL might be present in our study population with showing changes such as scar-tissue formation and fat deposition (27, 28). The CFL extends proximally from the fibular tip, deep to the peroneal tendons, distally to the posterolateral calcaneus, which show long course through the fat tissue (29). The CR was expectedly superior in VISTA than in VISTA SPAIR between fat and CFL, which is attributable to the "undisclosive" effect due to signal loss of CFL by suppression of intraligamentous fat. Additionally, CFL has the most variable features of size, shape, orientation, and capsular formation among the lateral ankle ligaments in cadaveric study (30). Dimmick et al. reported 19% of CFL of the patients without recognized ankle sprain history showed heterogenous signal on MR images with showing a separate lateral hypointense band a medial isointense medial band (31). Poor traceability of CFL might also be due to the signal intensity of healed/inherently heterogeneous-natured CFL which is similar to the adjacent suppressed fat.
Poor traceability of CFL in fat suppressed sequence in our study can be translated into the imaging interpretation of chronic ligament injury. Application of fat suppression for ligament MR imaging was advocated by the fact that fat suppression would be beneficial in acute cases because there may be accompanying high signal intensity due to hemorrhage or fluid collection within the joint or adjacent soft tissue (32). As the time goes by, ligaments typically heal through filling of the defect with a fibrous scar, which begins to form via fibroblastic proliferation as early as 7 days after the injury (28). And further remodeling of the fibrous scar goes on as the resolving hematoma and disorganizing matrix with the areas containing fat cells, vascular structure and clusters of mononuclear cells (27, 33). Although at a certain point of this time course, fat-suppressed MR image would be helpful in the evaluation of ankle ligament tear, but when there is no hemorrhage or fluid collection in chronic status, the validity of fat suppression is doubtful and the role of MRI in evaluation chronic injury might become depicting ligament irregularity or thickening, heterogeneity of ligament signal and ligament visibility (34, 35). Resultantly, in the assessment of chronic ankle injury, whether the ligament is traceable would be more important. Park et al. reported that fat suppressed MR imaging does not show perfect sensitivity for the evaluation of chronic lateral ankle ligament injury (36).
This study had several limitations. The first limitation was that only healthy volunteers were included and the number was relatively small. An additional study will be necessary to compare the diagnostic performance of VISTA and VISTA SPAIR in detection of various internal derangement of the ankle with a correlation to arthroscopic findings. Second, there is a possibility that healthy volunteers are not genuine healthy because ankle joint is the most common and vulnerable one that volunteers could have history of inversion injury without awareness. Third, there might be a bias during evaluating images because the radiologists could be aware of which MR sequences are they reviewing, although all the other information on the images and subjects were blinded to the reviewers. Nevertheless, our study has a merit because there has been no report that comparing between the ankle MR imaging with and without fat suppression in 3D isotropic imaging, even in 2D conventional MR imaging.
In conclusion, ligament traceability of VISTA without fat suppression demonstrated superior traceability compared to VISTA SPAIR with statistical significance, especially in CFL, which fact is expected to be translated into MR imaging assessment of chronic ligament injury. No significant difference of SNR was observed between the sequences except for bone marrow and muscle in tissue based analysis.


 XML Download