

 PDF
PDF ePub
ePub Citation
 Print
Print


INTRODUCTION
Alzheimer's disease (AD) is the most common type of dementia in the elderly, and mild cognitive impairment (MCI) is regarded as the transition stage between normal aging and AD (1). Several brain magnetic resonance imaging (MRI) studies have shown that abnormalities in AD patients involve both gray and white matter (WM). Although the mechanism of WM impairment in patients with AD has been reported to be related to Wallerian degeneration (2) and microvascular ischemic disease (3-6), recent studies have found that WM alterations are likely affected by additional hypometabolism-inducing factors, including disconnection and amyloid-β deposition (7, 8).
Diffusion tensor imaging (DTI) studies investigating the integrity of WM in patients with AD have found that many WM areas, including the parahippocampal, entorhinal, inferior parietal and middle frontal regions, showed the strongest AD-associated reductions in fractional anisotropy (FA) (4, 9-13). However, results based on analyzing regions of interest (ROIs) likely do not completely reflect the entire structural integrity of the fiber tracts, and the FA value obtained from a ROI analysis is largely affected by location and size of the ROIs; both being limiting factors in accuracy of ROI method since the ROI selection is often conducted without a prior knowledge about the exact location and extent of pathology. To overcome this problem, many imaging studies are starting to use FA images in voxel-based morphometry (VBM) analysis, in order to localize brain change related to neuro-degenerative disease (9, 10, 14, 15). This analysis, however, may be compromised by using standard registration algorithms; to date, no satisfactory method has been devised to align FA images from multiple subjects, such that valid conclusions may be drawn from the subsequent voxel-wise analysis. Furthermore, the arbitrariness of the choice of spatial smoothing extent has not yet been resolved.
To improve spatial normalization and provide better inter-subject registration, tract-based spatial statistics (TBSS) (16), which generate a custom template from each data set, were recently introduced to perform voxel-wise statistical analyses of FA. The TBSS technique was designed to overcome the limitations of VBM by a) careful tuning of nonlinear registration, followed by b) projection onto an alignment-invariant representative tract (called the "mean FA skeleton"). Therefore, TBSS has been found to improve the sensitivity, objectivity and interpretability of analysis of multi-subject diffusion imaging studies (16). This method is very useful in assessing patients with neurodegenerative diseases such as AD, which primarily affects neuronal density, allows changes to be detected at the earliest stages of the disease.
The purpose of this study is to investigate WM structural abnormalities in patients with mild AD and MCI patients compared with those in the old healthy groups, using the TBSS technique for DTI analysis. We also evaluated WM abnormality using VBM method and compared with the results of TBSS study.
MATERIALS AND METHODS
This study was approved by our institutional review board for human investigation, and informed consent was obtained from the patients or their relatives.
Patients
We studies 21 patients with mild AD (7 men, 14 women; mean ± SD age, 72 ± 6 years), 13 patients with MCI (5 men, 8 women; mean ± SD age, 71 ± 8 years), and 16 old healthy subjects (6 men, 10 women; mean ± SD age, 69 ± 4 years). Mild AD was diagnosed by the criteria of the National Institute of Neurological and Communicative Disorders and Stroke (NINCDS) and the Alzheimer's Disease and Related Disorders Association (ADRDA) (17), and only patients classified as having Clinical Dementia Rating Scale (CDR) scores of 0.5 or 1 were included. The overall severity of cognitive impairment was rated with the Using the Mini-Mental State Examination (MMSE) (18). Their MMSE score was 17.9 ± 3.9 (mean ± SD).
MCI was diagnosed according to the criteria of the International Working Group on Mild Cognitive Impairment (IWGMCI) (1): (i) the person is neither normal nor demented; (ii) there is evidence of cognitive deterioration, shown by either objectively measured decline over time and/or subjective report of decline by self and/or informant in conjunction with objective cognitive deficits; and (iii) activities of daily living are preserved and complex instrumental functions are either intact or minimally impaired. This classification was performed by using a semi-structured interview.
The old healthy group consisted of healthy elderly adults with CDR 0, with no previous history of neurological or psychiatric disease, and no complaints about decreased memory.
Patients with a history of diabetes, coronary heart disease, peripheral vascular disease, or other cardiovascular diseases were excluded, as were patients with evidence of head trauma; a primary psychiatric diagnosis; an infectious or endocrine cause of cognitive dysfunction; a history of habituation to drugs; the presence of cerebrovascular disease; or high WM signals on MR T2-weighted or fluid-attenuated inversion recovery (FLAIR) imaging.
Image acquisition
All MRI examinations were performed on a 1.5 T MR scanner (Gyroscan Intera, Philips Medical Systems, Best, the Netherlands). Conventional axial and coronal T2-weighted and axial FLAIR images were obtained to rule out cerebral infarction and other lesions. The parameters for T2-weighted imaging were as follows: TR, 3000 ms; TE, 100 ms; section thickness, 5 mm; FOV, 230×184 mm; and matrix size, 512×512. The parameters for FLAIR imaging were as follows: TR, 11000 ms; TE, 125 ms; TI, 2,800 ms; modulation of flip angle for refocusing pulses; section thickness, 5 mm; FOV, 230×180 mm; and matrix size, 512×512.
DTI images were acquired with a single-shot spin-echo echo-planar imaging (EPI) sequence in alignment with the horizontal plane. The diffusion-sensitizing gradients were applied along 15 non-colinear directions with a b-value of 600 s/mm2, together with acquisition without diffusion weighting (b = 0 s/mm2). Fifty-four contiguous axial slices of 2-mm thickness were acquired, with no gaps between slices. The acquisition parameters were as follows: TR = 7548 ms; TE = 60 ms; matrix size = 128×128; FOV = 224×224 mm; and NSA, 2.
Image processing and statistical analyses
Data analyses were performed using the Functional MRI of the Brain Software Library (FSL, http:\\www.fmrib.ox.ac.uk\fsl). Diffusion-weighted images of each subject were corrected for eddy currents, and aligned to one's non-diffusion weighted (B0) image using an affine transformation to correct for head movement. Subsequently, FA was calculated by fitting a diffusion tensor model at each voxel. All FA maps of the subjects were aligned to the FMRIB58 template, located in the same space as the MNI152 standard space, using FNIRT, a nonlinear registration tool provided in FSL. A mean skeleton mask was extracted from the mean FA map of the aligned images, and each subject's aligned FA data were projected onto the mean skeleton mask. The entire FA map of each brain was analyzed using TBSS in the FSL package (16), after eliminating voxels with an FA lower than 0.2 to eliminate the voxels in the gray matter or cerebrospinal fluid from the analysis.
Nonparametric permutation tests were used for voxel-wise statistical analysis of the individual FA skeletons among AD and old healthy groups. The significance threshold for group differences was set at p < 0.05, corrected for multiple comparisons across voxels using the threshold-free cluster-enhancement (TFCE) option in the Randomise 2.0 in FSL (19). Identification of the abnormal WM tracts revealed by TBSS was based on the Atlas formulated at Johns Hopkins University (20-22).
ROI analysis was performed in the clusters of different FAs between AD and old healthy group based on the TBSS analysis. FA values of the corresponding clusters were compared among the 3 groups using one-way ANOVA with Bonferroni test and correlations between disease groups and FA values were analyzed.
For VBM, we used the registered FA maps on the MNI152 standard space by FNIRT for TBSS analysis. These aligned FA maps were smoothed using an 8 mm full width at half maximum (FWHM) kernel. The final output was a three-dimensional matrix, in which the three indices were the x, y, and z spatial coordinates of voxels in the reference space. FA values in the maps of the AD, MCI and old healthy groups were compared pairwise using a general linear model after adjusting for age and sex on a voxel-by-voxel basis. The resulting statistical maps were thresholded at a false discovery rate (FDR)-corrected p < 0.05 with k > 500 voxels.
RESULTS
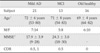
Table 1 shows the demographic and clinical characteristics of the subjects in the three groups. There was no difference in age among the three groups. MMSE scores were significantly lower in the mild AD than in the MCI group (p < 0.001).
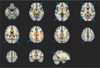
The regions with reduced FA in the mild AD compared with the old healthy group in voxel-based TBSS and VBM analyses are shown in Figure 1. Using the TBSS method, we observed reduced FA in patients with mild AD, compared with the old healthy group, in several brain regions, including the bilateral anterior corona radiata, the right posterior corona radiata, both posterior thalamic radiations including optic radiations, the right superior longitudinal fasciculus, the body of the corpus callosum, and the WM adjacent to the right precuneus gyrus (Table 2). VBM showed a wider area of decreased FA in the AD group, including both uncinates, the left parahippocampal WM, and the right cingulum (Table 3).
There were no significant differences in FA between the mild AD and MCI groups and between the MCI and old healthy groups.
ROI analysis on TBSS showed that FA values in all clusters defined by FA differences between AD and old healthy group were significantly lower in the AD than in the old healthy group, with FA values of the clusters in the MCI group being intermediate to those in the other two groups. However, the difference between the AD and MCI group or between MCI and old healthy group showed various significances according to the cluster (Table 4). We observed strong negative correlations between disease progression and FA values.
DISCUSSION
We have utilized TBSS to evaluate WM abnormalities on DTI in patients with mild AD and MCI compared with old healthy group. We observed significant differences between the AD and old healthy groups, with the former showing multifocal clusters of reduced FA in both cerebral hemispheres.
VBM-based analysis of FA images to localize brain changes related to degenerative disease is dependent on the accuracy of registration algorithms. To date, however, there have been no satisfactory solutions to the problems of aligning FA images from multiple subjects and to the choice of spatial smoothing extent. TBSS was therefore developed to resolve these issues, using carefully tuned nonlinear registration, followed by projection onto an alignment-invariant tract representation. TBSS was designed to improve the sensitivity, objectivity and interpretability of analyses of multi-subject diffusion imaging studies.
Although several DTI studies have reported differences in WM integrity between AD and old healthy groups, the results of these studies have been somewhat inconsistent. In agreement with previous results, we found that association fiber pathways, such as the superior longitudinal fasciculus, were compromised on the right side (23-25). The corpus callosum was also affected in the body portion, in partial agreement with other findings reporting genu or splenium portion (7, 24, 26). In contrast to a previous TBSS-based study by Striker et al. (25), which reported that the corona radiata, an early-myelinating WM fiber, was affected during the late stage of AD, we found that the bilateral anterior and right posterior corona radiata were compromised in patients with mild AD. This discrepancy may be due to the mean MMSE being lower in our mild AD group (17.9) than in their study group (24.4). So, more advanced AD patients than their study may be include in our study.
We also found that FA in the left posterior thalamic radiations including the optic radiations was significantly lower in our mild AD than our old healthy group, and these results were consistent with two previous reports (7, 27). Moreover, FA was reported to be reduced at the precuneus WM by Salat et al. (28).
Several authors reported decreased FA in patients with AD in areas of the temporal lobe, including the hippocampus, parahippocampal gyrus and uncinate (9, 24, 29), as well as in the cingulum and fornix (24, 29-31). In our study using the TBSS method, we found that these areas did not show significant differences in FA between the AD and old healthy groups. However, when we processed the same patients' data with the VBM method, we observed reduced FA areas in both uncinates, the left parahippocampal WM and the right cingulum in mild AD, in addition to the areas shown by TBSS analysis. These differences between the TBSS and VBM results are likely due to methodological differences. The VBM method conducted voxel-wise comparisons of FA maps on the stereotaxic space after using the smoothing kernel. However, TBSS used skeletonized FA maps and voxel-wise comparisons were performed on the white matter skeleton. The discrepancies we observed between the two analytic methods may explain, at least in part, the different results observed among different studies. We found that the VBM method showed more areas of decreased FA than the TBSS method. Although we also observed significant FA differences in areas along the lateral ventricles with the VBM method, these were considered artifacts caused by large ventricle size due to atrophy in the AD group.
Although several recent studies have investigated WM structural integrity in patients with MCI using TBSS analysis of DTI of the entire brain, these studies have shown conflicting results. One found that FA was not significantly lower in MCI patients than in controls (32), whereas the other found that FA was significantly decreased in the right parahippocampal WM, the bilateral uncinate fasciculus, and WM in the brain stem and cerebellum of MCI patients (24), although the findings were no longer significant following multiple comparison correction.
In our study, the TBSS method showed no significant differences in FA between the mild AD and MCI groups or between the MCI and old healthy groups. However, ROI analysis of low FA clusters identified by the TBSS method showed that FA tended to decrease from the old healthy to the MCI to the AD group in all clusters, although the differences between AD and MCI or between MCI and old healthy showed various degrees of statistical significance. These findings suggest that FA changes between the MCI and old healthy groups and between the MCI and mild AD groups are small, but that the differences may be significant if the number of study population is sufficiently large. The progressive decrease in FA from normal aging to MCI to AD supports the concept that MCI is a transitional stage between normal aging and AD (1).
The reasons for the conflicting WM integrity results among the AD, MCI and old healthy groups are not clear, but many factors may contribute. For example, they may be due to differences in study populations. Patients were grouped based on clinical information, and each group may be heterogeneous. In addition, the number of study patients was relatively small, 20-30 per group, which may have caused the comparisons to have insufficient statistical power. Differences may have been due to the investigational methods used, including ROI analysis, VBM, and TBSS, or to differences in MR imaging parameters.
Our study had several limitations. As in other studies of patients with neurodegenerative diseases, patient selection criteria were based on clinical diagnosis, with no pathological confirmation. Therefore, some of our patients may have been misdiagnosed and placed in the wrong group. Another limitation was the parameter determination in the TBSS method. Although the TBSS method has been used in several studies, the optimal parameters remain unknown (e.g., corrected or uncorrected multiple comparison and difference in p values). The discrepancies between our results and other studies may therefore be partly due to methodological factors. In addition, our results may have been limited by the small numbers of patients in each group.
Despite these limitations, we found that voxel-based analysis with TBSS is a promising method for examining WM degeneration in patients with mild AD. We found that WM degeneration involves neurofiber tracts in early phase of AD. Moreover, we found that MCI might be considered a valid concept to detect very early AD pathology, since we found close similarities in the pattern of WM change.
CONCLUSION
Using TBSS, we observed multifocal abnormalities in WM matter integrity in patients with AD compared with old healthy group. VBM could detect more white matter lesions than TBSS, but with increased artifacts. Additional studies, including larger numbers of patients, are needed to evaluate WM lesions more accurately.


 XML Download