

 PDF
PDF ePub
ePub Citation
 Print
Print


Abstract
Pigmented villonodular synovitis, synovial chondromatosis, long-standing rheumatoid arthritis, hemophilic arthropathy, chronic tophaceous gout, amyloid arthropathy, tuberculous arthritis, and hemangioma are the synovial diseases showing low signal intensity on T2-weighted image. Synovial deposition of hemosiderin, urate, and amyloid and fibrosis or caseous necrosis of hypertrophied synovium are known as the pathologic causes of T2 signal intensity. Because of the low incidence of the synovial lesions showing T2 low signal intensity, recognition of these diseases would be helpful for the exact diagnosis.
Figures and Tables
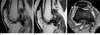
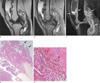 | Fig. 1Pigmented villondular synovitis, diffuse form. Sagittal T2-weighted MR image (a) and gradient echo image (b) of the knee demonstrate a large joint effusion containing extensive areas of decreased signal intensity with "blooming" artifact (arrows). On contrast-enhanced T1-weighted MR image (c), well-enhanced synovial thickening (arrows) is identified. Photomicrographs (H & E, ×12.5, d; ×400, e), show hyperplastic synovium with papillary projections (arrows) composed of foamy cells and macrophages containing hemosiderin (arrows).
|
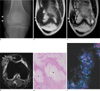
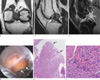 | Fig. 2Pigmented villonodular synovitis, localized form. Coronal T1-weighted MR image (a), sagittal T2-weighted MR image (b) and sagittal contrast enhanced fat-suppressed T1-weighted MR image (c) demonstrate a focal round lesion (arrows) at the intercondylar notch of the femur. It is well circumscribed with low signal on both T1- and T2-weighted MR images and enhanced well (arrows). On arthroscope (d), it is a brownish colored mass (arrows). Photomicrographs (H & E, ×100, e; ×400, f), show hyperplastic synovium with papillary projection (arrows) composed of foamy cells and macrophages containing hemosiderin (arrows).
|
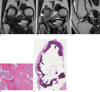 | Fig. 3Synovial chondromatosis. Coronal T1-weighted MR image (a), coronal and sagittal T2-weighted MR images (b, c) demonstrate multiple tiny low signal intensity bodies (arrows) at the posterior aspect of the knee joint. Photomicrographs (H & E, ×40, d; 200, e) show cartilage cells with variable atypia or binucleated forms within synovium with ossification (arrows). Osteoid matrix has undergone mineralization (arrows).
|
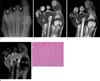 | Fig. 4Long-standing rheumatoid arthritis. Radiography of the foot shows subluxation of the 2nd and 3rd metatarsophalangeal joints and erosions of the 2nd and 3rd metatarsal heads (black arrows). The extensive soft tissue swelling (white arrows) is also identified (a). Axial T1- and T2- weighted MR images (b, c) and contrast-enhanced fat-saturated T1-weighted MR image (d) show marked thickening of synovium (arrows) at the 2nd and 3rd metatarsophalangeal joints and marginal erosions of 2nd metatarsal head and 3rd proximal phalangeal base. The proliferation of the synovium at the 2nd and 3rd metatarsophalangeal joints is manifested as T2 low signal intensity and poor enhancement on contrast-enhanced MRI. Photomicrograph (H & E, ×40, e) shows large area of dense fibrous tissue.
|
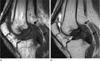
 | Fig. 5Hemophilic arthropathy. Sagittal T1- and T2- weighted MR images (a, b) show several nodular synovial lesions (arrows) at the posterior aspect of the knee. Signal intensity of the lesions and the lining of the suprapatellar pouch is intermediate to low signal intensity on T1- and T2-weighted MR image. And the low signal synovial lining of the suprapatellar pouch is also identified on T2-weighted image (thin white arrows). Axial gradient MR image (c) shows the dark signal lining of the synovium (arrows).
|
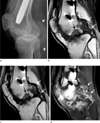
 | Fig. 6Chronic tophaceous gout. Radiograph (a) reveals increased soft tissue density around lateral femoral condyle (arrows). Coronal T1- and T2-weighted images (b, c) show marked low signal intense tophaceous deposits (black arrows) in the lateral aspect of the joint capsule and intratendinous tophus in iliotibial tract (white arrows). Axial contrast-enhanced fat suppressed T1-weighted image (d) shows heterogeneous enhancement of the tophi engulfing the lateral aspect of the patella and joint capsule (arrows). Photomicrograph (H & E, ×40, e) shows large aggregates of urate crystals (asterisks), granulomatous inflammation, and hyperplastic fibrotic synovium. Photomicrograph of specimen under polarized light (H & E, ×400, f) shows refractive urate crystals (asterisks) that form massive conglomerates.
|
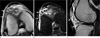
 | Fig. 7Amyloid arthropathy. Sagittal T1- (a) and T2-weighted images (b) in a patient with 18-year duration of hemodialysis due to chronic renal failure show marked thickening of synovium (arrows), presented as T2 low signal intensity.
|
 | Fig. 8Tuberculous arthritis. Radiograph of knee (a) reveals soft tissue swelling (arrows), joint space narrowing and bone erosion. Sagittal T1- (b) and T2-weighted images (c) demonstrate low signal intense synovial proliferation (white arrows) eroding into the adjacent bone (black arrows). Contrast-enhanced fat-suppressed T1-weighted image (d) shows subchondral bone edema (black arrows) and poorly enhanced synovium (white arrows).
|
References
1. Narváez JA, Narváez J, Ortega R, De Lama E, Roca Y, Vidal N. Hypointense synovial lesions on T2-weighted images: differential diagnosis with pathologic correlation. AJR Am J Roentgenol. 2003. 181:761–769.
2. Chen CK, Yeh LR, Pan HB, et al. Intra-articular gouty tophi of the knee: CT and MR imaging in 12 patients. Skeletal Radiol. 1999. 28:75–80.
3. Huang G-S, Lee C-H, Chan W, Chen C-Y, Yu J, Resnick D. Localized nodular synovitis of the knee: MR imaging appearance and clinical correlates in 21 patients. AJR Am J Roentgenol. 2003. 181:539–543.
4. Murphey M, Vidal J, Fanburg-Smith J, Gajewski D. Imaging of synovial chondromatosis with radiologic-pathologic correlation. Radiographics. 2007. 27:1465–1488.
5. Stiskal MA, Neuhold A, Szolar DH, et al. Rheumatoid arthritis of the craniocervical region by MR imaging: detection and characterization. AJR Am J Roentgenol. 1995. 165:585–592.
6. Suh JS, Lee JD, Cho JH, Kim MJ, Han DY, Cho NH. MR imaging of tuberculous arthritis: clinical and experimental studies. J Magn Reson Imaging. 1996. 6:185–189.
7. Frick M, Wenger D, Adkins M. MR imaging of synovial disorders of the knee: an update. Radiol Clin North Am. 2007. 45:1017–1031.
8. Luck J, Silva M, Rodriguez-Merchan EC, Ghalambor N, Zahiri C, Finn R. Hemophilic arthropathy. J Am Acad Orthop Surg. 2004. 12:234–245.
9. Yu JS, Chung C, Recht M, Dailiana T, Jurdi R. MR imaging of tophaceous gout. AJR Am J Roentgenol. 1997. 168:523–527.
10. Chung C, Boucher R, Resnick D. MR imaging of synovial disorders of the knee. Semin Musculoskelet Radiol. 2009. 13:303–325.
11. Otake S, Tsuruta Y, Yamana D, Mizutani H, Ohba S. Amyloid arthropathy of the hip joint: MR demonstration of presumed amyloid lesions in 152 patients with long-term hemodialysis. Eur Radiol. 1998. 8:1352–1356.
12. Hong SH, Kim SM, Ahn JM, Chung HW, Shin MJ, Kang HS. Tuberculous versus pyogenic arthritis: MR imaging evaluation. Radiology. 2001. 218:848–853.
13. Sanghvi D, Iyer V, Deshmukh T, Hoskote S. MRI features of tuberculosis of the knee. Skeletal Radiol. 2009. 38:267–273.
14. Helpert C, Davies AM, Evans N, Grimer RJ. Differential diagnosis of tumours and tumour-like lesions of the infrapatellar (Hoffa's) fat pad: pictorial review with an emphasis on MR imaging. Eur Radiol. 2004. 14:2337–2346.
 XML Download