

 PDF
PDF ePub
ePub Citation
 Print
Print


Introduction
Various metallic devices have been used for implantations or percutaneous procedures, but these metallic implants cause severe magnetic resonance imaging (MRI) image distortions called susceptibility artifacts. Metal-induced artifacts arise from the susceptibility difference between the body tissue and the metal, and the artifacts can be strong enough to deteriorate the whole image (1, 2). A number of methods have been introduced to overcome metallic artifact image distortions. The view angle tilting (VAT) method suggested by Cho et al. is one of the most promising methods to correct the artifact and proved to be useful in medical practice (3, 4). However, the images obtained by the VAT method are convolved with a square function, which is related to slice-selection gradient, so they are blurred. Recently, in order to compensate this image blurring, the additional z-phase encoding technique called as SEMAC(Slice Encoding for Metal Artifact Correction) was reported (5).
When imaging patients with metallic devices, such as implants or biopsy needles, image degradation and geometric mis-registration must be solved (3, 6, 8, 9). In particular, it is important to know the exact location of the metallic needle for image-guided biopsy. A few investigators have successfully calculated the amount of shift caused by metallic artifacts (1, 7). Ludeke et al. (1) calculated the shift when the metal cylinder was perpendicular to the main magnetic field (1). Ladd et al. (7) studied the case where the metal cylinder is at an arbitrary angle with respect to the magnetic field, but they did not consider the slice distortion caused by the slice-selection gradient. If the slice-selection gradient is not taken into account with the readout gradient, then the calculated artifact is different from the real artifact.
To explore the metal artifact, we assumed an infinite, non-magnetic metallic cylinder in a strong magnetic field. The cylinder's axis leaned toward the main magnetic field along some arbitrary angle. We solved the Laplace equation for these situations to investigate the magnetic field distortion (7), and then we successively simulated the effect of the readout gradient and slice gradient magnetic field. As a result, the artifact's shape and size were generated, and the location of the cylinder's center was calculated and determined. We compared the results of the calculated images with the real images.
The real images were acquired on a 1.5 T clinical MRI system (GE HORIZON). The phantom was made of a stainless steel rod immersed in a bottle containing doped water.
The goal of our new method is to exactly calculate the location of the cylinder's center, not to reduce or remove the artifact, so this method can be applied during surgery with a real-time open magnet MRI system for successfully guiding needles.
Materials and Methods
Calculation of Field Distortion
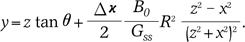
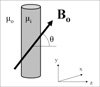
Ladd et al. calculated the field distortion caused by an infinite cylinder that leans along a strong, homogeneous magnetic field, B0, which is illustrated in Fig. 1, where the permeability inside and outside the cylinder are μi and μe, respectively, and the radius of the cylinder is R. For convenience, the axis of cylinder is parallel to y-axis, and the tilt angle between the magnetic field and the plane perpendicular to the cylinder's axis is θ. The external magnetic field can be expressed as
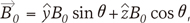
where  and
and  denote the magnetic field inside and outside cylinder, respectively.
and denote the magnetic field inside and outside cylinder, respectively.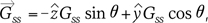
Computer Simulations of the Distortion
Distortions were simulated using Mathematica (Wolfram Research, version 3.0). When a slice-selection gradient is applied, the slice's shape is distorted by the susceptibility difference, so we simulated a distorted shape caused by the slice selection gradient and by the superposition of distortions caused by the readout gradient.
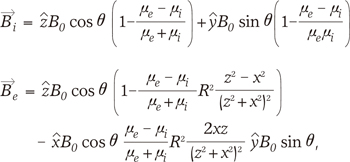
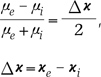
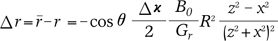
First, for the effect of slice gradient, we assumed that an infinitely thin slice was selected by the slice selection gradient:

whose direction was perpendicular to the main magnetic field. A frequency ω = γ(B0+yGss) to select the slice at y=z tan θ results in an actual slice at r(x, y, z) defined by
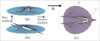
Because we are not concerned with the inner metal, no calculation is needed for the interior of the cylinder. Using Mathematic, this situation is plotted in Fig. 2a.
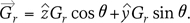
Next, for the distorted slice we applied a readout gradient. In the readout gradient, the points move along the direction of the readout gradient which is assumed to be applied in the same direction of B0, that is,
We also calculated this shift in a similar way we used in the case of a slice-selection gradient. The pixel r will be displayed at position r̄.
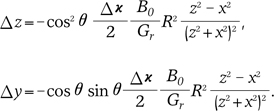
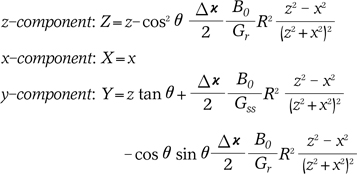
Each of the points on the surface of Eq. [6] will be shifted by the readout gradient calculated with Eq. [9]. As a result of Eq. [6] and Eq. [9], the components of the distorted surface are expressed as
The simulated image in Fig. 2 is relatively similar to the real image generated from MR scanner. There were regions of condensed lines that appeared as bright as regions on the real image.
To understand the shape of the susceptibility artifact, we watched the brightest points. As shown in Fig. 2c, the brightness is caused when a slice is folded at one point (i.e., the folded point, 'f') or when the slice is piled up around a point (i.e., the piled point, 'p').
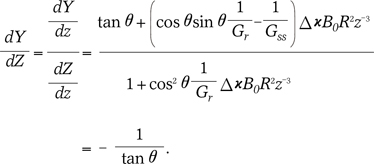
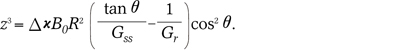
The tangent line at the folded point is parallel to the direction of slice selection gradient, so the folded point can be calculated by simple differentiation. Initially, due to symmetry, the folded point will be on the z-axis, so all x's in Eq. [10] can be set to zero. Then, we find the point where the incline of the tangent line is -1/tan θ, as follows:


In the case of x2=z2 in Eq. [10], the shift by susceptibility artifact does not occur and those points of x2=z2 in Eq. [10] stay stationary under the susceptibility artifact. So, other points around those stationary points are shift and piled up at those stationary points. So, the piled point will lie on the plans in Eq. [13].
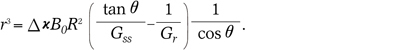
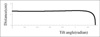
Since Eq. [12] relates to the folded point, we can plot the distance from the cylinder's center to the folded point as a function of the metallic cylinder's tilt angle relative to the main magnetic field (Fig. 3). Piled points are located on the matching lines of all plans in Eq. [13]. By using these points, we can calculate the exact location of the cylinder's center in the image without any complementary devices.
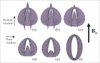
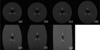
The simulated images in Fig. 4 show the slice shape caused the by the magnetic field distortion, which varied as a function of tilt angle (0°, 15°, 30°, 45°, 60°, and 75°). We confirmed that there were large changes in artifact size that were caused by varying the tilt angle. This result corresponded to that shown in Fig. 3.
All of these findings indicate that image distortion is not proportional to tilt angle. As θ approached 90°, the artifact decreased in size and eventually disappeared.
Phantom and Image
A stainless-steel cylindrical rod was chosen for the phantom imaging. The stainless steel rod was inserted in a water container doped with CuCl2. The rod's susceptibility was not available because the rod's constituents were not published, so the rod's susceptibility was calculated from the image (θ=0) using Eq. [12] and Eq. [13] as Δχ=-0.006915649. The length and diameter of the cylindrical rod were 20 cm and 1 mm, respectively. The phantom images were acquired with a conventional spin echo pulse sequence on a 1.5 T MRI system (General Electric Medical Systems, Milwaukee, WI). The matrix size was 256×256, and the field of view (FOV) was 16 cm. Bandwidth was +/-16 kHz. Slice thickness was 1 mm. Repetition time (TR) and echo time (TE) were 300.0 msec and 20.0 msec, respectively. The actual strength of the readout and slice gradients were 0.458 gauss/cm and 1.78156 gauss/cm, respectively. The tilt angles of stainless still rod to main magnetic field were tried as 0°, 8°, 24°, 32°, 44°, 56° for MR image.
Comparison of Simulated and Acquired Images
Using the piled points and folded point, the center of metallic cylinder was determined from MR images. Also, the distance between the center and the folded point was measured. The measured distances were compared to the calculated value from Eq. [12].
Firstly, the piled point were identified on the image as one of the brightest points, and then a straight line were drawn using x=z or x=-z in Eq. [13], which will connect the piled point with the center of the metal cylinder. Secondly, we identified the folded point, which is the other brightest point, and then the vertical line was drawn which connected the folded point and the center of metal cylinder. Finally, the overlapped point of two lines is the center of the metal cylinder. We measured the number of pixels from the center to the folded point, and we could measure the distance from the center to the folded point from images. Using Eq. [12], we could calculate the distance from the center to the folded point for each tilt angle and compared these values to the measured image values.
Results
We have a sound understanding of the artifact's shape from the simulated metallic artifact. The simulated images with various tilt angles in Fig. 4 coincide with the real images from MR scanner in Fig. 5. In the direction of read-out gradient, one can observed little changes with the distance between the brightest points in Fig. 4 and Fig. 5. On the other hand, in the direction of phase gradient the ranges of artifact decrease according to the tilt angle.
As mentioned above, the location of the center can be determined with real image. The distance from the center to the folded point can be also measured from the real image. The distances measured from images were compared to the calculated value using Eq. [12] and those distances were in good agreement, as shown in Table 1. The calculated distances of Table 1 show that the distance does not make a big change according to the tilt angle. These results can be observed in Fig. 3 and both simulated and real images.
Percentage errors in Table 1 were less than 5%, except for one case. Errors can occur because it is difficult to precisely select the folded and piled points. For a pixel size of 0.0625 cm, considerable error may result from mispositioning by one or two pixels. Despite this challenge, these results are in good agreement for simulated and acquired images.
Discussion
The shape of the metallic artifact was determined with simulation under the assumption that the cylinder was infinite in length and skewed in an arbitrary tilted angle relative to the main magnetic field.
Artifact shape can be calculated with the method we presented here. Our method is applicable for a stainless steel cylinder as well as other less susceptible materials (e.g., aluminum or titanium). The calculated and measured distances were similar, but there was some percentage of error in the measurement: 1.0-14.7%. One reasonable explanation is that we did not perfectly mark the folded point and piled point on the images; mismarking by a few pixels can cause considerable errors.
In practice, marking the folded point is easier than marking the piled point; then, using Eq. [12], a user can find the metal cylinder's location. Additionally, if we know the magnetic susceptibility of the implanted metal and the cylinder's tilt angle, we can calculate the radius of the implanted cylinder from Eq. [12]. Precisely knowing the cylinder's location is useful in medical practice.
Artifact shape and the location of metal cylinder implanted to human body can be determined, if the metallic cylinder is assumed to be infinite. Magnetic field distortion cannot be calculated at the sharp end of metallic biopsy needles (8-10) because an exact solution of the Laplace equation at the needle's point has not been found (8-10). Recently, artifacts caused by arbitrarily-shaped metallic implants were simulated with numerical methods and complex computer simulation (11). However, there is no method for measuring the location of metallic implants using only images, so further research is needed to be able to measure the location and shape of metallic implants.

 XML Download