

 PDF
PDF ePub
ePub Citation
 Print
Print


Introduction
In addition to the non-specific extracellular contrast agents used in dynamic imaging, a variety of liverspecific contrast agents have been used to assess focal liver lesions (1). The primary role of the superparamagnetic iron oxide (SPIO) agent, which is taken up by Kupffer cells, is to improve the detectability of small lesions by increasing the lesion-toliver contrast (1, 2). Many facilities now use high-field magnets for body imaging, and liver MRIs using 3T unit have become more generalized (3, 4). Compared to the more popular and standardized 1.5T unit, high-field unit such as the 3T MRI produce higher-resolution imaging due to their inherently higher signal-to-noise ratio (SNR); however, the increased instance of artifacts produced by high-field units is a potential drawback that can disturb imaging quality (especially in abdominal imaging) (3-5).
Most investigators who use 3T unit for hepatic MR imaging follow the same parameters as those that are used for 1.5T unit because optimal parameters have not been specialized to the high-field magnets in SPIOenhanced imaging as well as in static and dynamic imaging of the liver (4, 6, 7). Potential challenges for better imaging quality include some changes in tissuespecific relaxation times, precession frequencies and susceptibility-related artifacts. The varied image quality following SPIO-injection with 3T unit shows different consequences than that with 1.5T unit (3, 4, 6, 8). Like the prior studies for fast imaging sequences for SPIO-enhanced imaging in the 1.5T unit (9, 10), determination of echo time (TE) is also essential to get optimized T2*-weighted gradient echo images for the detection of small focal hepatic lesions in the 3T unit. For this purpose, image quality in terms of the anatomic details, lesion conspicuity and imaging artifact should be balanced with the high contrast between the lesion and the background parenchyma after SPIO injection (7, 10). The purpose of this study was to evaluate the relative abilities of various fast breath-hold imaging sequences for SPIO-enhanced hepatic MRI for the assessment of clinically challenging solid malignant focal lesions using a 3T unit.
Materials and Methods
Patients
Approval for this retrospective study was obtained from our institutional review board, which waived the requirement of informed consent for the review of images. We reviewed the electronic medical records of all patients who underwent hepatic MR imaging with a 3T MRI unit during a 19-month period from July 2005 to December 2006. We identified 102 consecutive patients (74 men and 28 women ranging from 22 to 81 years of age [mean, 55.2]) with one or more solid malignant focal lesions verified either by histopathologic findings or on follow-up imaging modalities other than MRI, including digital subtraction angiography, computed tomography (CT) and ultrasonography, conducted 3-12 months later, as well as with increased levels of serum tumor markers. In patients with multiple lesions, a maximum of five lesions of each type per patient were selected on the basis of the aforementioned criteria; 170 total lesions (≥ 1 cm in the longest dimension) in 102 patients were selected for further analysis. We excluded lesions less than 1.0 cm in length to avoid any inaccuracies in signal intensity measurement for quantitative analysis that could result from the partial volume averaging effect in smaller lesions. Among the 170 lesions, we identified 107 hepatocellular carcinomas (HCCs) in 70 patients, 54 metastases in 27 patients and nine cholangiocarcinomas (CCCs) in five patients. For 26 HCCs, three CCCs and 41 metastases, histopathologic verification of the lesions by means of biopsy and/or surgery was possible. The primary sites of the metastatic lesions included colorectal carcinoma (33 lesions in 18 patients), gastrointestinal stromal tumor (five lesions in one patient), nasopharyngeal carcinoma (five lesions in one patient), renal cell carcinoma (four lesions in one patient), breast carcinoma (two lesions in two patients), cervical cancer (two lesions in one patient), pancreatic carcinoma (one lesion in one patient), common bile duct cancer (one lesion in one patient), and thyroid cancer (one lesion in one patient).
MRI Techniques
MR imaging was performed with a 3T unit (Signa EXCITE; GE Medical Systems, Milwaukee, WI, USA). Patients were positioned supine with anterior and posterior phased-array coils centered over the liver. After obtaining localizer images, chemical selective fatsuppressed T2-weighted turbo spin-echo images (TR/TE, 4000/98 msec; echo train length, 14) were obtained in the axial plane. After obtaining a doubleecho chemical shift gradient-echo sequence (TR/firstecho TE, second-echo TE, 160/2.4 [in-phase], 5.8 [opposed-phase]; flip angle, 70° matrix, 352 × 300; slice thickness, 8 mm; interslice gap, 1.5 mm), dynamic contrast-enhanced imaging was obtained using a 3D gradient echo (GRE) sequence (LAVA; GE Medical Systems) with ultrafast image reconstruction using parallel imaging algorithms (ASSET factor, 2) in the axial plane (TR/TE, 3.5-4.2/1.0-1.2 msec; flip angle, 10°; matrix, 320 × 256; slice thickness, 5 mm; slice spacing, 2.5 mm; number of slices, 64) during a 16-sec breath-holding period. A dynamic series consisted of one precontrast series followed by three postcontrast series, including arterial, portal and five-minute delayed phase imaging. The postcontrast series were performed after administrating a bolus injection of gadopentetate dimeglumine (0.1 mmol/kg of Magnevist; Schering, Berlin, Germany) at a rate of 2 mL/sec followed by a saline flush using a power injector.
After the dynamic imaging, SPIO (8 µmol iron/kg of Resovist; Schering, Berlin, Germany) was intravenously administrated as the second contrast agent. After ten minutes, T2-weighted turbo spin-echo (TSE) and T1-weighted double echo chemical shift gradient-echo (GRE) images were obtained using the same parameters as those of the pre-contrast imaging. A GRE sequence with a longer echo time (TR/TE, 134/10 msec; flip angle, 35°) was added for T2*-weighted imaging. All scans were sent to the Picture Archiving and Communication System (PACS) for interpretation on PACS workstations.
Image Analysis
For all patients, three GRE sequences, including the two sequences of double echo techniques (TE, 2.4 msec [GRE_2.4]; 5.8 msec [GRE_5.8]) and another GRE using a longer TE of 10 msec for T2*-weighted imaging [GRE_10], were subjected to comparative analyses of SPIO-enhanced images, along with one fat-suppressed T2-weighted TSE sequence. The images were analyzed independently by one attending radiologist with 14 years of experience with hepatic MRIs and also by a senior resident in the department of radiology on a workstation (Centricity, GE Healthcare) using standard software. After finishing the review session, evaluation disagreements were resolved by consensus.
Qualitative image analysis was performed to identify the sharpness of hepatic contours, the visibility of intrahepatic vasculature and the presence of artifacts. To ensure rating consistency, the two readers had been previously trained in the rating of participants. The observers recorded the hepatic contours and vascular landmarks in each image set based on the following four-point scale for both the right and left lobes of the liver: 1, not visualized; 2, poorly visualized; 3, definitely visualized; 4, sharply visualized. We assessed the artifacts, including motion, vascular pulsation, chemical shift, and susceptibility artifacts, on a four-point scale using the following scores: 1, severe; 2, moderate; 3, mild; 4, absent. For all 170 lesions, the conspicuity of each lesion on each image set was also evaluated based on a four-point rating scale. A score of 1 indicated that the lesion was invisible; 2, poorly defined; 3, fairly defined; 4, clearly defined. For quantitative analysis, the contrast-to-noise ratio (CNR) of each lesion was calculated using a spherical or oval region of interest (ROI) measurement by the same reviewers in conference using the following equation:
CNR = (SIlesion - SIliver)/SDnoise,
Where SIlesion is the signal intensity of the lesion; SIliver is the signal intensity of the liver parenchyma; and SDnoise is the standard deviation of the background noise.
The statistical significances of the qualitative data for the four pulse sequences were determined with using Wilcoxon's matched-pair signed rank test for multiple comparisons. T-test was used to compare lesion-to-liver CNRs between the HCCs and the other solid lesions in the images with the four different pulse sequences. A p-value of less than 0.05 was considered statistically significant.
Results
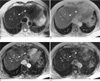
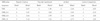
On the four-point scales, the mean scores of sharpness of hepatic contours, visibility of intrahepatic vessels, presence of artifacts, and lesion conspicuity for the four sequences are shown in Table 1. Regarding the sharpness of hepatic contours, the visibility of intrahepatic vessels, or the imaging artifacts, GRE_5.8 was significantly better than GRE_2.4 (p<0.001), GRE_10 (p<0.001) or TSE (p<0.001) (Fig. 1).
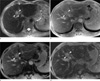
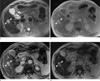
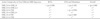
Overall lesion conspicuities of the GRE_5.8 and GRE_10 were better than those of TSE and GRE_2.4 (p<0.001). For HCCs, lesion conspicuity was best on the GRE_10 but was comparable with that of GRE_5.8 without statistical significance (p=0.696). GRE_5.8 and GRE_10 were superior to the other two sequences with regard to lesion conspicuity for HCCs (p<0.001) (Fig. 2). For CCCs and metastases, GRE_5.8 and GRE_10 as well as TSE were superior to GRE_2.4 (p<0.001) (Fig. 3, Table 2). Although the lesion conspicuity for CCCs and metastases on GRE_5.8 and GRE_10 were generally superior to those of TSE, there was no statistically significant difference between the two (GRE_5.8 vs GRE_10, p=0.795; GRE_10 vs. TSE, p=0.380) (Table 2).
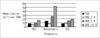
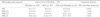
For all lesions, the mean lesion-to-liver CNR was highest at GRE_10 (mean ± SD = 19.8 ± 14.4) and was significantly higher (p<0.001) than those at GRE_5.8 (12.1±9.1), GRE_2.4 (6.3±6.4) or TSE (10.1±7.7) (Table 3, Fig. 4). The CNRs at GRE_5.8 and TSE were comparable (p=0.022) and were significantly higher than that at GRE_2.4 (p<0.001). The mean CNRs of CCCs and metastases were higher than those of HCCs at GRE_10 (p<0.001) and TSE (p<0.001). However, the CNRs were comparable between GRE_2.4 (p=0.024) and GRE_5.8 (p=0.004) (Table 3).
Discussion
Compared to conventional 1.5T MRI unit, optimization of body imaging data acquisition using a 3T unit requires an appreciation of the changes in T1 and T2 (11). At higher field strength, T1 and T2 of normal tissues become lengthened and shortened, respectively (3, 11, 12); however, because of the various behaviors of relaxation times of a variety of different tissues, the optimal parameters that affect image contrast used in 3T imaging are still unknown (11). A definite helpful aspect of a 3T system is its higher SNR, but the benefit of high SNRs and CNRs would be partially cancelled out by the more prominent artifacts due to the susceptibility effects proportional to the magnetic field strength (4, 8, 13). However, the images obtained with a 3T system have been regarded as having comparable quality, allowing the assessment of focal liver lesions with equivalent confidence as the images acquired using 1.5T imaging (4, 6,8, 11).
Additionally, SPIO particles that have accumulated in the Kupffer cells produce magnetic field heterogeneities in addition to the shortenings of T2 or T2*, which lead to signal loss or a decrease in the signal intensity of the liver (3, 14-16). Although there is no remarkable difference in the static imaging qualities between the 1.5T and 3T systems (6, 11), SPIO-enhanced imaging could be greatly influenced by an increased susceptibility effect. Regarding the scope of our present study, we assumed that the higher SNR on 3T SPIO-enhanced MRI can be attributed to the increased susceptibility of a 3T system to iron particles taken up by Kupffer cells in the liver parenchyma. Given that most hepatic tumors do not contain Kupffer cells, a greater signal loss of hepatic parenchyma on 3T would result in higher lesion-to-liver contrast accompanied by more pronounced artifacts from the adverse effects of increased susceptibility compared to those of 1.5T systems (4, 6).
Several studies have compared various imaging techniques using SPIO for the evaluation of liver tumors using either 1.5T or 3T MRI (2, 3, 4, 10, 17-23). Aside from T2-weighted imaging with a short TE similar to that of proton density imaging for maintaining the lesion signal intensity at a moderately higher degree, spoiled GRE with a long TE of about 10 msec provided a properly increased susceptibility effect of SPIO for optimized T2*-weighted imaging with a 1.5T system (10). In the present study using a 3T system, GRE_5.8 showed significantly better qualities in terms of hepatic contour, vascular landmarks and imaging artifacts compared to the remaining sequences including GRE_10, which has been regarded as an optimized sequence for the 1.5T system for SPIOenhanced imaging. For GRE_10 on a 3T system, the accentuation of pulsation artifacts on the left lobe of the liver and the marginal blurring of anatomic landmarks resulting from a longer TE was more deteriorated with the negative effect of increased susceptibility artifacts from the higher field strength. Even though the mean CNR was higher on GRE_10 compared to those of the other sequences, the overall lesion conspicuity of GRE_5.8 was comparable with that of GRE_10 in the present study. Therefore, the results of the present study suggest that the overall value of GRE_5.8 is superior to that of GRE_10 for SPIO-enhanced imaging on a 3T system.
Because of the increased magnetization transfer effects and the reduced local field heterogeneities by the multiple 180° refocusing pulses, the effect of SPIO enhancement on signal loss in normal liver tissue is reduced in TSE images (18, 19, 24). In our present study, TSE was significantly inferior to all GRE sequences in the qualitative assessment. Lesion conspicuity and mean CNRs also showed pessimistic values with the TSE sequence. Even though it was beyond the scope of our study, the TSE sequence can help distinguish vessels from sub-centimeter lesions and may contribute to the approving consequences in the evaluation of focal liver lesions. The relatively low signal intensities of vascular structures in TSE sequences allow for improved conspicuity of small lesions (25).
Regarding the types of malignant focal lesions, the mean lesion-to-liver CNR of HCCs was lower than that of CCCs or metastases at all of the four SPIO-enhanced fast MRI sequences in the present study. In spite of the lack of information on our participants, we could speculate that the cirrhotic background of the liver for the HCC patients would disturb SPIO uptake in the background parenchyma, which might result in decreased CNR (26-28). Another possibility of the partial SPIO uptake in some well-differentiated HCCs might consequently decrease the lesion-to-liver CNR (29), which cannot occur in CCCs or metastases.
This study had several limitations. First, due to the retrospective manner of this study for the 1-cm or larger lesions for quantitative analysis, the true number of focal lesions could not be determined by a gold standard procedure. Therefore, the sensitivity and specificity of each sequence could not be calculated. Second, all of the images were obtained using 3T unit; direct comparison with images of 1.5T unit was not possible to differentiate the optimized breath-holding fast MR sequences based on the strength of the magnet. Due to the limited hardware performance of the early 3T unit used in this study, which was installed in 2002, the fast T2-weighted imaging sequence was not optimized for body imaging. The imaging quality of TSE has been improved during recent years with the 3T system, and the qualitative score of TSE would be different if the same study were to be performed with an updated system.
In conclusion, regarding overall quantitative and qualitative performances, GRE using a moderate echo time of 5.8 msec would provide most reliable data among the various fast breath-hold T2- or T2*-weighted imaging sequences for SPIO-enhanced hepatic MR imaging on the 3T unit despite the lower CNR compared to that of echo time of 10 msec attributable to fewer imaging artifacts and a comparable lesion conspicuity.
 XML Download