

 PDF
PDF ePub
ePub Citation
 Print
Print


INTRODUCTION
Insulin assays are used for the diagnosis of hypoglycemia and may be useful in determining the pathogenesis of type 1 and 2 diabetes. However, the previously used radio-immunoassays have limitations, such as varying degrees of cross-reactivity with endogenous insulin precursors and recombinant insulin analogues, and interference from anti-insulin antibodies (IAs) [1]. These limitations have caused significant inter-assay variation and have led to the misinterpretation of laboratory results.
In the recent decades, insulin analogues have been developed through protein engineering, and the use of recombinant human insulin has markedly reduced the incidence of insulin resistance related to IAs, compared to that related to poorly purified animal insulin preparations. Therefore, interference from IAs is no longer thought to be serious. However, technological advancements in the mode of insulin administration, i.e., continuous subcutaneous insulin infusion (CSII), continuous peritoneal insulin infusion (CPII), and insulin inhalation, may increase the risk of the IA formation [2].
As recently reviewed by Sapin [3], commercially available insulin immunoassays still have similar limitations due to IAs. However, the studies themselves also had some limitations, many of which stem from a simple comparison between directly measured insulin (direct insulin) and IA-unbound insulin (free insulin) levels, and few studies have determined the exact cause of IA interference in the currently used automated insulin immunoassays.
We evaluated the usefulness of an insulin electro-chemiluminescence immunoassay by assessing the influences of IAs in targeting patients who were receiving intensive insulin therapy and by estimating cross-reactivity with 2 human recombinant insulin analogues. To evaluate the possible cause of influence from IAs, we compared total insulin levels (IAs-bound and unbound insulin) with direct and free insulin levels. We also compared the results of this assay with 2 other insulin immunoassays.
MATERIALS AND METHODS
1. Study subjects
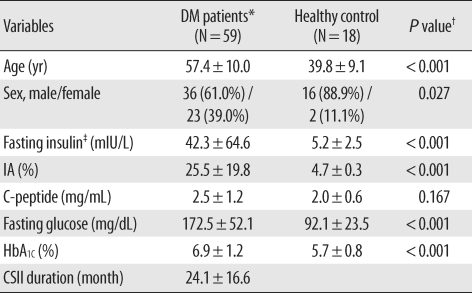
Fasting blood samples from 59 type 2 diabetes patients receiving CSII therapy while attending Konkuk University Hospital diabetes out-patient clinics in Seoul between May and September 2008 were enrolled. To exclude the possible influence of the disease itself on preprocessing for IA precipitation and to determine whether healthy people have IAs, 18 healthy control patients attending the medical health examination center at the same medical institution were enrolled during the identical time. The diabetes group included 36 men and 23 women and the mean age was 57.4 ± 10.0 yr (range, 36-81). The healthy control group included 16 men and 2 women and the mean age was 39.8 ± 9.1 yr (range, 19-56). The patients' medical records were reviewed, not only for the results of initially requested laboratory tests, such as serum insulin, C-peptide, fasting glucose, and glycated hemoglobin (HbA1C) levels, but also for the insulin therapy type they had used and the duration of CSII treatment. Serum insulin and C-peptide levels were determined using a MODULAR analytics E170 module (Roche Diagnostics, Mannheim, Germany) and fasting glucose and plasma HbA1C were determined using a TBA 200FR Neo system (Toshiba Medical Systems Co., Ltd., Tokyo, Japan), and a HLC-723 G7 analyzer (Tosoh Corporation, Tokyo, Japan), respectively. The Institutional Review Board at the University of Konkuk, Seoul, Korea, approved this study.
2. Direct insulin
To distinguish the measurement of direct insulin from insulin pre-treated with polyethylene glycol (PEG) (free and total insulin), direct insulin was defined as insulin levels determined using the E170 module in fasting blood samples without preprocessing.
3. Free and total insulins
Free insulin (IA-unbound) was determined using the E170 insulin assay after precipitation of immune complexes with a 50% PEG 6000 solution [4]. The PEG solution was mixed with the same amount of serum sample, and then centrifuged at 3,000 g for 15 min at 4℃. Total insulin (bound and unbound) was determined using the procedure described by Kuzuya et al. [5], which includes the addition of HCl solution before PEG precipitation to separate insulin molecules from IAs. Then, only the separated IAs were precipitated by PEG treatment, finally NaOH was added for neutralization. Ultimately, both the free and total insulin levels were calculated using the dilution rates from the measured direct insulin levels of each supernatant.
4. Anti-insulin antibody
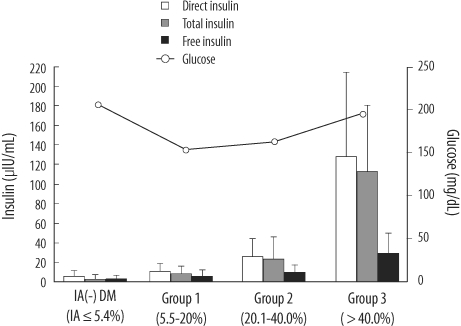
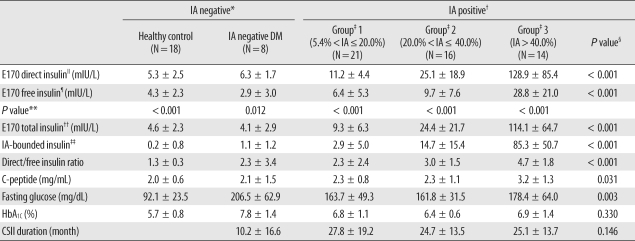
To investigate the interference from IAs on insulin level measurement, we determined the free IA levels (not combined with insulin molecules) for all subjects using radioimmunometric assays (anti-insulin IRMA, CIS Bio International, Areva S.A., France). The positive threshold was set at 5.4%, as per the manufacturer's instructions. IA-positive patients were divided into 3 groups using arbitrarily determined criteria based on IA levels (Group 1, 5.4%<IA≤20.0%, N=21; Group 2, 20.0%<IA≤40.0%, N=16; Group 3, IA>40.0%, N=14).
5. Comparison of three insulin immunoassays
Three insulin concentration measurement methods were compared. We used the E170 analyzer, the Advia Centaur Immunoassay System (Simens, Erlangen, Germany), and a manual INS-IRMA assay (BioSource, Nivelles, Belgium) for 38 samples meeting the condition of sufficient residual volume among the 59 patients in the diabetes group. All the insulin assays were calibrated against the WHO 66/304 reference. After the E170 insulin assay, the remaining sample was stored at 4℃ and analyzed using the other methods within 24 hr, without any pre-treatment. Directly measured insulin levels from each method (E170, Advia Centaur, and IRMA) were comparatively analyzed.
6. Analysis of cross-reactivities in E170 insulin assay
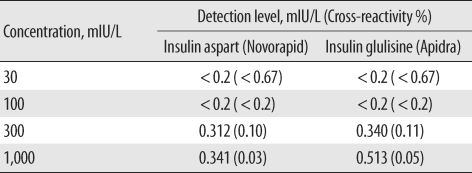
We obtained vials of 2 insulin analogues, insulin aspart (NovoRapid, Novo Nordisk, Bagsvaerd, Denmark) and insulin glulisine (Apidra, Sanofi-Aventis, Paris, France), which are suitable for injection and with which our diabetes patients were most frequently treated. We serially diluted the analogues with 7% aqueous bovine serum albumin (BSA) to final concentrations of 30, 100, 300, and 1,000 mIU/L. The insulin levels of all dilutions were measured by E170 insulin assay, and each sample was analyzed in duplicate. In-vitro cross-reactivity (%) with these 2 insulin analogues was calculated from the ratio of the measured and nominal concentrations.
7. Statistical analysis
Data were analyzed with the Predict Analytics Software program version 17.0 (PASW, formerly Statistical Package for the Social Sciences, SPSS, SPSS Inc., Chicago, IL, USA). The One-Sample Kolmogorov-Smirnov Goodness-of-Fit Test was used to assess the distribution of all variables, which included E170 direct, total and free insulin, IRMA and Advia Centaur direct insulin, C-peptide, glucose, HbA1C, and CSII duration. Differences between E170 direct and free insulin, and differences between E170 direct and total insulin were determined by using Wilcoxon matched-pair signedrank tests. Furthermore, differences among the E170 direct, total and free insulin levels and differences among the E170, IRMA, and Advia Centaur direct insulin levels within each group were determined by using Friedman two-way ANOVA by ranks. Differences of each variable between healthy control and diabetes mellitus (DM) patients were assessed by using Mann-Whitney U or Student's t tests. Differences among the 5 groups (healthy control, IA negative DM group and IA positive group 1-3) were determined using Kruskal-Wallis H or one-way ANOVA followed by post hoc test with Bonferroni correction. The Pearson's correlation and stepwise multiple linear regression analysis were used to find a correlation between IA and total insulin with other variables. Results were presented as mean ± SD unless otherwise stated, and a P value of less than 0.05 was considered statistically significant.
RESULTS
1. Comparison of diabetes patients with healthy controls
All of the 18 healthy controls and 8 of the 59 diabetes patients were IA negative (range, 4.25-5.36%). The average of CSII durations in diabetic patients was 24.1±16.6 months (range, 0-84 months). Fasting insulin levels measured using the E170 insulin assay (E170 direct insulin), fasting glucose levels, and the percentage of IA and HbA1C were significantly higher in diabetes patients than in healthy controls (E170 direct insulin and IA, P<0.001 by Mann-Whitney U-test; fasting glucose and HbA1C: P<0.001 by Student's t-test,). The difference in C-peptide levels between diabetes patients and healthy controls was not statistically significant (P=0.167 by Student's t-test) (Table 1).
2. Intragroup or inter-group comparison
IA positive diabetes patients were classified into 3 groups according to IA levels. To assess interference from IAs, E170 direct and free insulin levels were compared among IA positive subjects and within each group. E170 free insulin levels were significantly lower than direct insulin levels for IA positive subjects (13.6±15.3 vs. 47.9±67.8, P<0.001 by Wilcoxon test) and this decrease was observed in each of groups (all, P<0.005, Table 2). The mean values of the E170 direct/free insulin ratio, which signified the extent of interference, and of IA-bound insulin levels, which were calculated from the difference between the E170 total and free insulin levels, gradually increased in the higher IA groups, as did the E170 direct, total, and free insulin (Table 2). The differences among the 4 DM groups and total the 5 groups were statistically significant (all, P<0.001 by Kruskal-Wallis H test). The differences in C-peptide and fasting glucose levels among the 5 groups were significant (P=0.031 and 0.003, respectively by one-way ANOVA), but not among the 4 DM groups (P=0.053 and 0.183, respectively). Fasting glucose levels were significantly higher in the IA negative group than in all of the IA positive patients (P=0.046 by Student's t test). The differences in HbA1C and CSII duration were not statistically significant among the 5 groups (P=0.330 and 0.146, respectively), however, CSII duration was significantly shorter in the IA negative group than in all of the IA positive patients (10.2±16.6 vs. 26.1±15.8, P=0.027). Differences among E170 direct, total and free insulin levels were assessed within each of the 4 DM groups (Fig. 1), and were significant only within the IA positive DM groups 2 and 3 (IA negative DM group, P=0.230; IA positive DM group 1, P=0.060; group 2, P=0.023; and group 3, P<0.001, by Friedman test). However, E170 direct insulin levels were not significantly different from E170 total insulin levels (within IA-positive DM group 2, P=0.620; group 3, P=0.092, by Wilcoxon signed rank test; for all subjects, P=0.235, by paired t-test).
3. The relationship between IA and other variables and predictors of E170 total insulin
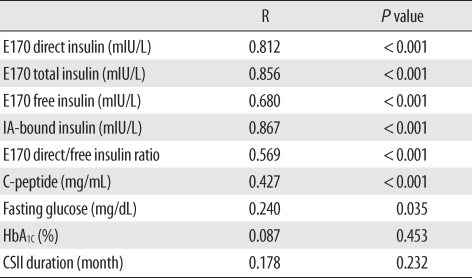
To identify the factors related to IA, for all subjects, Pearson's correlation was conducted between IA levels and other variables (E170 direct, total, and free insulins, E170 direct/free insulin ratio, IA-bound insulin calculated from the difference between total and free insulin levels, C-peptide, fasting glucose, HbA1C, and the duration of CSII treatment). Among these variables, IA-bound insulin, E170 total, direct, and free insulin, E170 direct/free insulin ratio, C-peptide, and fasting glucose (in order of correlation coefficients) were correlated with IA levels (Table 3).
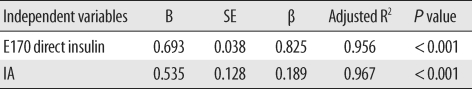
From the stepwise multiple linear regression analysis, E170 direct insulin (β=0.825, P<0.001) and IA level (β=0.189, P<0.001) were selected as independent predictive factors among the other variables (E170 total and free insulins, E170 direct/free insulin ration, IA-bound insulin, C-peptide, fasting glucose, HbA1C, CSII duration and IA), which influence E170 total insulin levels (Table 4). E170 direct insulin was the most significant factor and accounted for 95.6% of the variation in E170 total insulin (Adjusted R2 = 0.956). As a result, the final regression equation was, Y (E170 total insulin)= -4.823 + 0.693X1 (E170 direct insulin) + 0.535X2 (IA).
4. Comparison of three insulin immunoassays
The differences among the direct insulin levels measured by 3 different methods were significant (P=0.032 by Friedman test). The average E170 direct insulin level from the 38 comparable patients was 41.4±65.7 mIU/L, and the average of Advia Centaur and IRMA direct insulin levels were 19.9±27.5 and 12.2±6.9 mIU/L, respectively. E170 direct insulin was more correlated with Advia Centaur insulin than IRMA (R2=0.763 vs. R2=0.415, P<0.001 by simple linear regression analysis). Advia Centaur direct insulin levels was more correlated with E170 direct insulin than E170 free and total insulin (R2=0.763 vs. 0.759 and, 0.663, respectively, P<0.001), while IRMA direct insulin was most correlated with E170 free insulin than E170 direct and total insulin (R2=0.520 vs. 0.415 and 0.382, respectively, P<0.001).
5. Analysis of cross-reactivity with insulin analogues in the E170 insulin assay
The measured concentration and calculated cross-reactivity of each stratified diluted insulin analogues is summarized in Table 5. The E170 insulin assay had a low cross-reactivity of <0.7% for both insulin analogues even at the highest concentrations tested.
DISCUSSION
The aim of our study was to investigate whether IAs interfere with the E170 insulin assay and whether the assay could detect human recombinant insulin analogues, in order to determine the usefulness of the E170 insulin assay.
Previous studies have reported that the measurement of serum insulin concentration in patients treated with insulin may yield unreliably high results because IAs interfere with insulin in both 1 or 2-site radioimmunometric assay, and the recently used automated immunometric assays [3, 6-9]. The free insulin fraction is generally regarded as the biologically active form, and the overestimation of insulin concentration compared to free insulin may lead to the misinterpretation of a patient's status. Therefore, there was a consensus that endogenous antibodies should be removed before the assay. This has been achieved by precipitation with PEG, or ethanol, and by gel filtration [10]. However, the overestimation of serum insulin concentration has not been determined in all currently available insulin assays; thus the extent and underlying causes of overestimation in each assay are not yet clear. Furthermore, it is generally accepted that human recombinant insulin analogues currently in use result in very little endogenous antibody formation compared to animal insulin, so the importance of preprocessing to eliminate antibodies before insulin measurement has greatly diminished over the last 2 decades.
Large, interventional studies in diabetes patients have shown that tight blood glucose control with intensive insulin therapy decreases the risk of developing both micro-antiopathic- and macro-angiopathic complications associated with hyperglycemia [11]. Based on these results, intensive insulin therapies, such as implantable CSII or CPII, are used more frequently today. Some studies have suggested that implantable insulin pumps may be associated with increased IA levels. The major causative mechanisms are insulin aggregation due to storage of insulin in the pump reservoir and the presence of surfactant or polyethylene glycol [12, 13].
In our study, we consciously selected diabetes patients receiving insulin pump therapy, who were suspected to have IAs. The majority of the diabetes patients (51 of 59) were IA positive. Our results show interference from IAs in the E170 insulin assay, and show that the extent of interference or overestimation, direct/free insulin ratio, was correlated with the IA level. It was also correlated with IA-bound insulin, which was estimated from the difference between total and free insulin (Table 3). Therefore, overestimation of the direct assay in IA positive patients may result from an increase in IA-bound insulin, not assay error from IAs. Our results were similar to those obtained in Sapin's study [9] using the Elecsys (Roche diagnostics), which was the previous model of the E170 analyzer. However, in our understanding, our study takes a more theoretical approach than the others through comparative analysis of the relationships among direct, total and free insulin in the E170 insulin immunoassay.
Some results of the present study may be related to the insulin epitopes that are detected by the assay-specific monoclonal antibodies. First, our cross-reactivity results show that the E170 assay hardly detects the 2 human recombinant insulin analogues, insulin aspart and glulisine (Table 5), and these results are consistent with a previous study with the E170 insulin immunoassay [14]. To the best of our knowledge, this is the first report which determined that there is little cross-reactivity with insulin glulisine in the E170 insulin assay. Furthermore, in our comparison of 3 insulin assays, the results from the E170 assay were more correlated with those from the Advia Centaur assay, which had a more similar detection method (E170 is a ECLIA and Advia Centaur is a CLIA) than IRMA. IRMA yielded lower results than other 2 immunoassays. Finally, direct insulin as measured with E170 is very closed to the total insulin level (Table 4).
Several studies have supposed that the monoclonal antibodies used in the Elecsys (the previous model from the same manufacturer) detect a region located in the C-terminus of the B chain [9, 15]. Positions B26-B30 do not impair antigenicity but are critical for the self-association of the insulin molecule, so the C-terminus of the B chain is a major target for substitution to reduce human recombinant insulin dimerization for rapid action in the bloodstream [16]. Conversely, the region between B20 and B26, the so-called beta-sheet hinge, is important for the binding of insulin to its receptor [17, 18]. If the monoclonal antibodies used in the E170 assay detect the C-terminus of the B chain as suggested in the previous report, our above-mentioned results are easily explainable.
Our study suggests that the E170 insulin assay accompanied by PEG pre-treatment can assess residual β-cell function in diabetes patients receiving insulin therapy. Moreover, directly measured insulin concentrations using the E170 insulin assay may also provide information about immunogenic insulin resistance, a condition in which the body produces insulin but does not use it properly, thus in spite of a high insulin concentration, glycemic control seriously deteriorates. Insulin resistance is a intra-cellular phenomenon in metabolic syndrome or pre-diabetes stage of type 2 diabetes mellitus [19]. However, immunogenic insulin resistance is due to circulating IAs, and a long time ago, it was suggested that the difference between immunogenic insulin resistance and nonresistance in insulin-treated patients depends primarily on the concentration of insulin-binding antibody [20]. High circulating levels of IAs may interfere with insulin pharmacokinetics, leading to worse hyperglycemic control as well as unexplained hypoglycemia, which are attributed to the 'dumping' of insulin from its antibody reservoir. In our results, IA levels were correlated with total insulin (Table 3), and E170 direct insulin was nearly concordant with total insulin. Therefore, if the insulin concentration measured using the E170 insulin assay was unreliably high, and if the fasting glucose also high or unexpectedly low, physicians could surmise that it was due to the formation of IAs without determining total insulin.
From our correlation results (Table 3), IA levels were not related to CSII duration, but the mean CSII duration of IA negative DM patients was significantly shorter than that of IA positive DM patients (groups 1-3). Therefore, IAs might be produced during insulin therapy. It has been suggested that immunogenic insulin resistance occurs more frequently in patients with type 2 diabetes [21]. The duration of insulin therapy before the onset of severe insulin resistance has been reported to be from 1 month to 15 yr, and in 50-85% of patients, it occurred after less than 1 yr [22, 23]. Therefore, physicians should perform insulin level and fasting glucose tests more frequently, especially during intensive insulin therapy, because severe insulin resistance is often associated with fasting hypoglycemia and both symptomatic hyperglycemia, including episodes of ketoacidosis and hyperosmolar coma However clinicians should be also aware of the cross-reactivity of various insulin analogues with the assay used in an individual clinical laboratory because, if their insulin assays detect only endogenous insulin, they will not be able to assess patient compliance or titrate insulin dosage.
Our study has a number of important limitations that need to be considered. First, there were significant differences between direct and free insulin levels in IA negative groups (healthy controls and IA negative DM patients). One possible explanation is the minimal precipitation of free insulin by PEG treatment [24]; another is the unavoidable delays in the time between the venipuncture and PEG treatment because we targeted patients from whom we had requested insulin measurement. Previous studies have found that the measurements change over time [10, 24], and it might be due to an insulin-degrading enzyme. The other possibility is low sensitivity caused by sample dilution, especially at low free insulin concentrations [25]. Second, we measured free and total insulin levels only by the E170 insulin assay. Further experimental investigations are needed to understand the characteristics of each method, and it could be helpful in the standardization of insulin assays.
In conclusion, we evaluated the effects of IAs and cross-reactivity with 2 human recombinant insulin analogues in the E170 insulin immunoassay. Directly measured insulin using the E170 assay was overestimated compared to free insulin, thus we confirmed that IAs interfered with the E170 insulin assay. Both E170 direct/free ratio and IA-bound insulin were correlated with IA levels. Therefore interference may result from the increase of IA-bound insulin, not from an assay error from IAs. The E170 insulin assay is thought to measure only human endogenous insulin because of low cross-reactivity with recombinant insulin analogues. It could be made available for diabetes patients receiving insulin therapy to assess β-cell function, via the determination of free insulin with PEG pre-treatment.
 XML Download