

 PDF
PDF ePub
ePub Citation
 Print
Print


INTRODUCTION
Metabolic syndrome (MetS), a cluster of metabolic disorders such as obesity, hypertension, dyslipidemia, and hyperglyceridemia, increases the risk of developing atherosclerotic diseases such as cardiovascular disease (CVD) [1-3]. Therefore, MetS is a major public-health concern worldwide [4, 5].
Recently, 2 adipocytokines, leptin and adiponectin, have been recognized as key regulators of various metabolic disorders, and the serum/plasma leptin:adiponectin ratio (L:A) has been reported to be a new surrogate marker for atherosclerosis in subjects with obesity and type 2 diabetes mellitus [6, 7]. The ratio of adiponectin and leptin has also been reported to be associated with insulin resistance, which is considered to be one of the pathophysiological conditions underlying MetS [8, 9]. However, for instance, diabetes mellitus, a component of MetS, is not always caused by insulin resistance in Japanese people [10]. Furthermore, these earlier studies have not explored the association between L:A and MetS with regard to the determination of a potential cut-off level of L:A for detecting MetS and have not fully examined the L:A in the general community-dwelling population of Japan. Therefore, this study aimed to confirm whether the L:A can indicate MetS traits across a wide range of age in both men and women in the general Japanese population.
MATERIALS AND METHODS
A total of 678 non-smoking Japanese subjects (208 men and 470 women with a mean age of 58.8±14.4 yr [range: 21-88 yr]; a mean age of 60.2±15.2 yr [range: 24-88 yr] in men and 58.1±14.0 yr [range: 21-83 yr] in women) were selected from the people attending general health check-ups and community-based health education classes. The study was approved by the institutional ethics committees, and each subject gave informed consent. None of the subjects was taking any medication that is known to influence metabolic disorders, and they had not been previously diagnosed with CVD. The presence of 3 out of 5 of the following criteria was considered as a diagnosis of MetS according to the National Cholesterol Education Program-Adult Treatment Panel (NCEP-ATP) III recommendations with a minor modification for the criteria for obesity [11, 12]: 1) obesity, identified by a body mass index (BMI) ≥25.0 kg/m2, as a surrogate for increased waist circumference for Japanese people [11, 12]; 2) elevated blood pressure (BP), identified by a systolic BP ≥130 mmHg and/or diastolic BP ≥85 mmHg; 3) hypertriglyceridemia, identified by fasting serum triglyceride values≥1.69 mmol/L; 4) decreased high-density lipoprotein (HDL) cholesterolemia, identified by serum HDL cholesterol values <1.04 mmol/L in men and <1.29 mmol/L in women, and 5) elevated glucose levels, identified by fasting plasma glucose values ≥6.1 mmol/L.
The BP was measured on the upper arm, with the subject in a seated position, by using a standard sphygmomanometer. Blood glucose and triglyceride values were enzymatically measured, and the HDL cholesterol values were measured using a homogeneous method. The serum samples of leptin and adiponectin were frozen until they were used for measurement (within 3 months). Leptin level was measured using an enzyme-immunoassay kit with intra- and inter-assay coefficients of variation of 5.6% and 6.7%, respectively (Cayman Chemical Company, Ann Arbor, MI, USA). Adiponectin was measured using an enzyme-linked immunosorbent assay kit with intra- and inter-assay coefficients of variation of 5.2% and 3.4%, respectively (Otsuka Pharmaceutical Co Ltd, Tokyo, Japan).
All values are expressed as the mean±standard deviation (SD) or median+interquartile range, unless otherwise specified. The between-group differences were analyzed by the t-test or chi-square test. The within-group trends and differences were analyzed by one-way ANOVA with post-hoc tests for multiple comparisons. ANOVA was also performed with an adjustment for age. The variables associated with L:A were determined by a multiple linear regression analysis after adjustment for age, systolic BP, triglyceride, HDL cholesterol and glucose levels (diastolic BP was not included in this analysis model because it had a close colinearity with the systolic BP). ROC curves were plotted to identify an optimal cut-off level of the L:A for detecting MetS [13]. The values of triglyceride, leptin, adiponectin, and L:A were calculated after a log-transformation because of their skewed distribution. Differences were considered significant at P≤0.05.
RESULTS
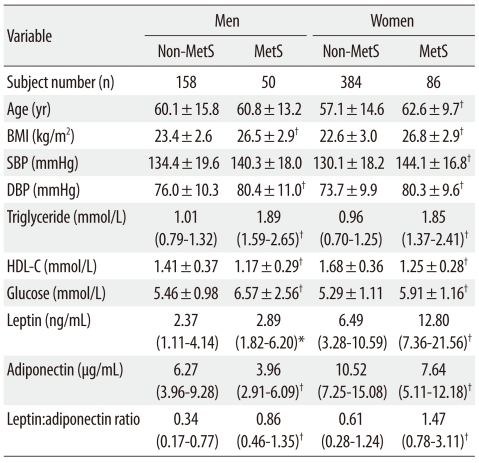
The characteristics of the subjects included in this study are shown in Table 1. Mean/median ages (women), levels of BMI, systolic BP (women), diastolic BP, triglyceride, glucose, leptin, and L:A were significantly higher, whereas the mean/median levels of HDL cholesterol and adiponectin were significantly lower, in MetS subjects (men and women) than in non-MetS subjects.
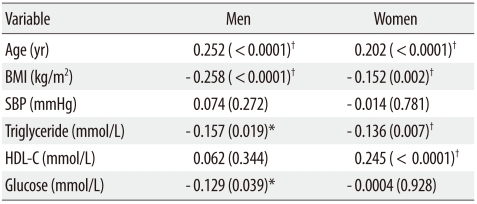
The correlations between the L:A and the other cardiometabolic variables determined by the multivariate-adjusted regression analysis are shown in Table 2. In men, the variables that were significantly and independently associated with the L:A were age (positively), BMI (inversely), triglyceride (inversely), and glucose (inversely). In women, the variables that were significantly and independently associated with the L:A were age (positively), BMI (inversely), triglyceride (inversely), and HDL cholesterol (positively).
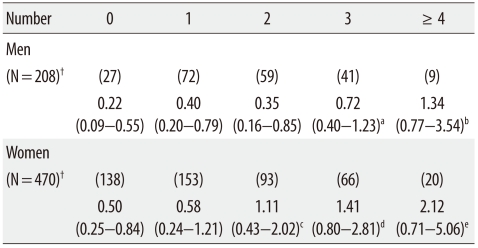
A trend toward an increase in the L:A with an increase in the number of components of MetS was observed, as shown in Table 3. Only 6 (2 men and 4 women) of the subjects presented with all 5 components of the MetS; therefore, the group of subjects presenting with all 5 components of MetS was combined with the group presenting with 4 components to form a group presenting with ≥4 components of MetS. On the basis of the number of components of MetS, the L:A levels were found to have a significantly and gradually increasing trend in all subjects, regardless of gender.
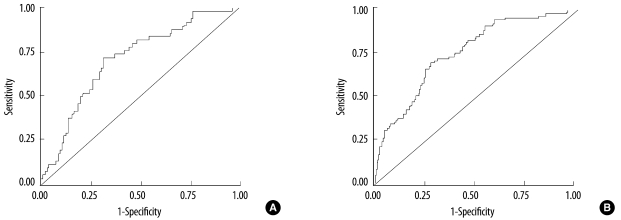
Fig. 1 shows the ROC curves for the L:A. The area under the ROC curve was 0.712 (95% confidence interval: 0.632-0.791, P<0.0001) in men and 0.755 (95% confidence interval: 0.700-0.809, P<0.0001) in women. On the basis of the plotted ROC curves, the cut-off level of L:A for detecting MetS was determined to be 0.59 (sensitivity: 0.72, specificity: 0.70, positive likelihood ratio: 2.4, negative likelihood ratio: 2.5) in men and 1.04 (sensitivity: 0.72, specificity: 0.69, positive likelihood ratio: 2.3, negative likelihood ratio: 2.5) in women.
DISCUSSION
In the subjects of the present study, the L:A levels were significantly higher in MetS subjects than in non-MetS subjects, regardless of gender. The L:A was shown to be significantly and positively associated with the number of components of MetS present in both genders. The L:A was also significantly and independently associated with each MetS-component variable such as the BMI, triglyceride and glucose levels (in men), and HDL cholesterol levels (in women).
Leptin and adiponectin are individually known to be involved in the pathogenesis of obesity and MetS [6, 14, 15]. Under such an obesity-related condition, the leptin levels are higher and adiponectin levels are lower, and thus, the L:A can be relatively high [6, 7]. This fact seems to explain the results obtained in the present study. On the basis of these results, the L:A can be considered to be a plausible index for detecting the presence or the multiple components of MetS. In addition, although the reasons for the between-gender differences in the association of the L:A with glucose/lipid variables of MetS components remain unclear, it may be partially due to gender-based differences in glucose and lipid (i.e., HDL cholesterol) metabolism, requiring further research [16, 17].
Simultaneous occurrence of multiple components of MetS reportedly contribute to the development of CVD [1, 2]. Leptin and adiponectin can be more relevant to atherosclerosis in subjects with obesity and diabetes mellitus than conventional atherosclerotic factors such as BP and lipid levels [7, 14, 15]. In this study, we proposed a gender-based cut-off level of L:A for the detection of MetS in the general Japanese population; thus, this may be valuable in future studies. These proposed values had a moderate degree of accuracy for the area under the ROC curves, as well as showed a twofold higher L:A cut-off level for MetS in women than in men. Whether an increase in the L:A or the L:A cut-off level can predict the development of CVD in MetS is an important issue that will need to be examined in more studies.
A possible limitation of this study is that it was designed to be cross-sectional. In the present study, although we determined the variables associated with L:A, the cross-sectional design did not clearly elucidate the cause-and-effect relationship between these variables. The prevalence of MetS in women of the present study appeared to be high in a comparison to a prior study [18]. Because these results might be partially affected by the study settings and methodologies (e.g., the recruitment of subjects, and diagnostic criteria for MetS), the generalizability of the results must be interpreted carefully. Unfortunately, we did not measure the waist circumference, fat distribution (e.g., by computed tomography) and nutritional status, which might also influence the L:A. More studies with a prospective design and including various other measurements are needed to confirm our theory.
In summary, our results suggest that the L:A can serve as a clinically useful marker for MetS traits in the general Japanese population. The clinical significance of the L:A as an easily determinable value for the management of MetS and the atherosclerotic disease associated with MetS in this population warrants further study.
 XML Download