Abstract
Background:
Despite the diagnostic utility of immunophenotyping for myelodysplastic syndromes (MDS), it has not been widely performed, and reports on this are absent in Korea. We aimed to evaluate the immunophenotypic features of non-blastic granulocytes, monocytes, and blasts in patients with MDS and non-clonal disorders using routine flow cytometry (FCM). Moreover, we evaluated the phenotypic abnormalities of mature cells in leukemic patients.
Methods:
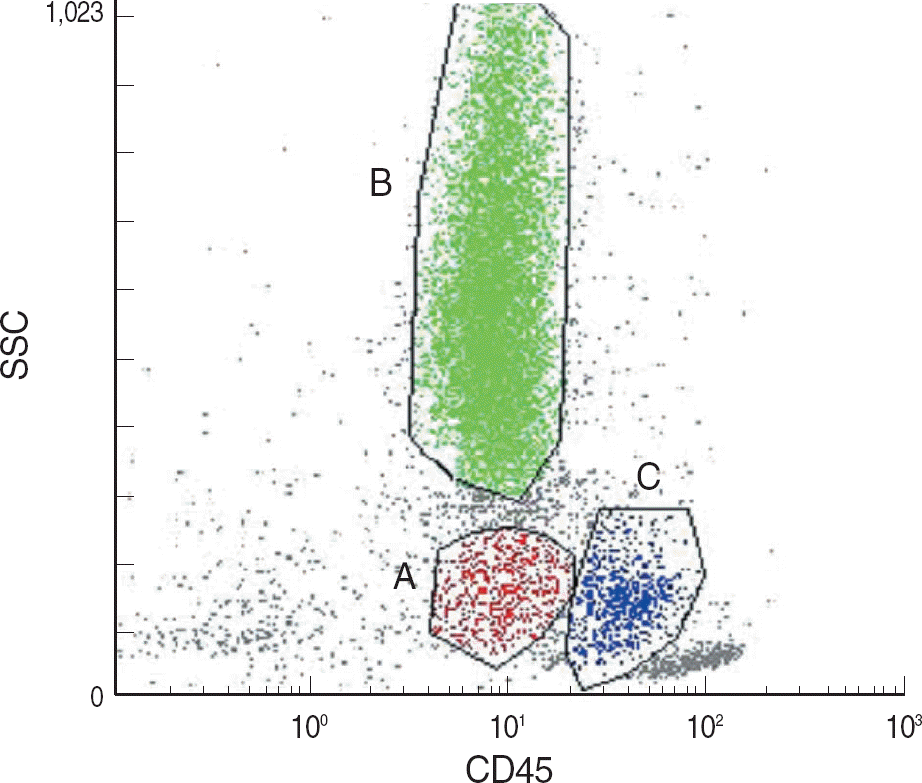
Marrow aspirates from 60 patients, including 18 with MDS, 18 with leukemia, and 24 with non-clonal disorders (control group), were analyzed using FCM. Blasts, non-blast myeloid cells, and monocytes were gated based on CD45 expression and side scatter (SSC). The phenotypes were then compared among the 3 groups.
Results:
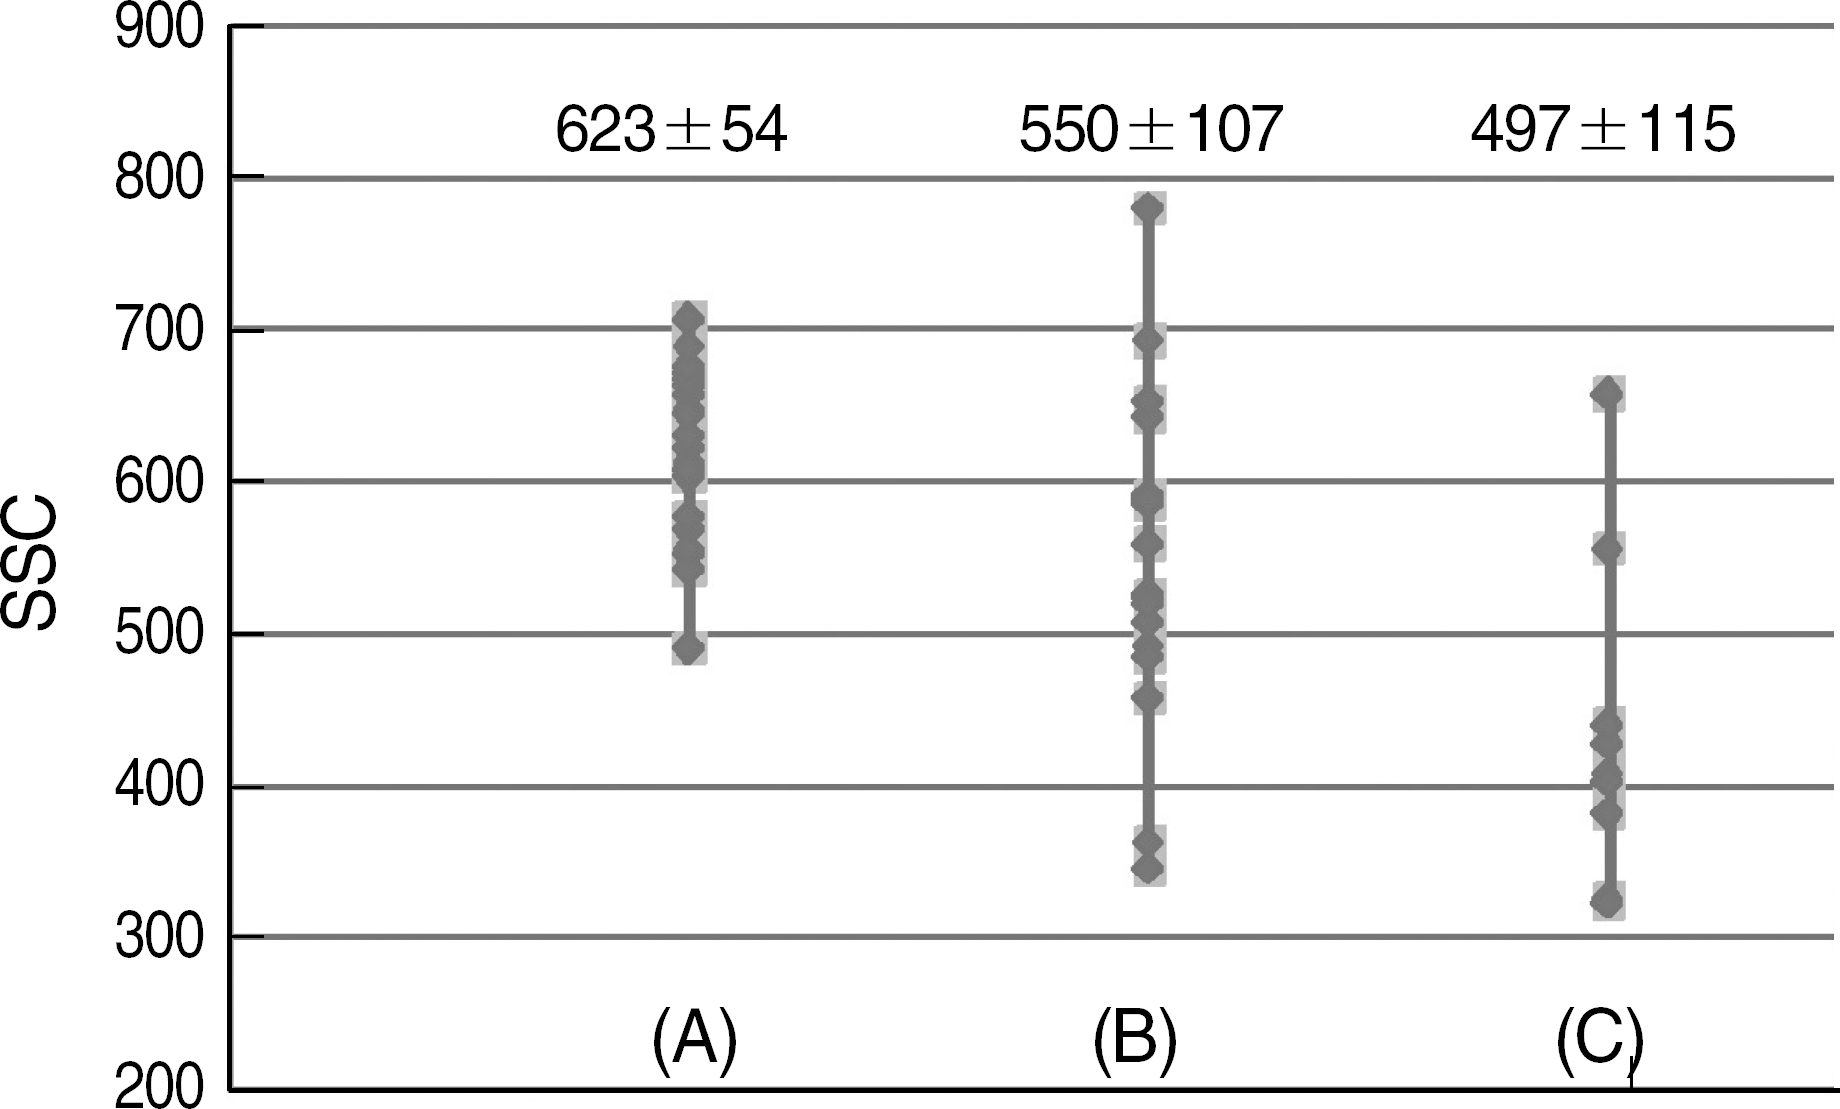
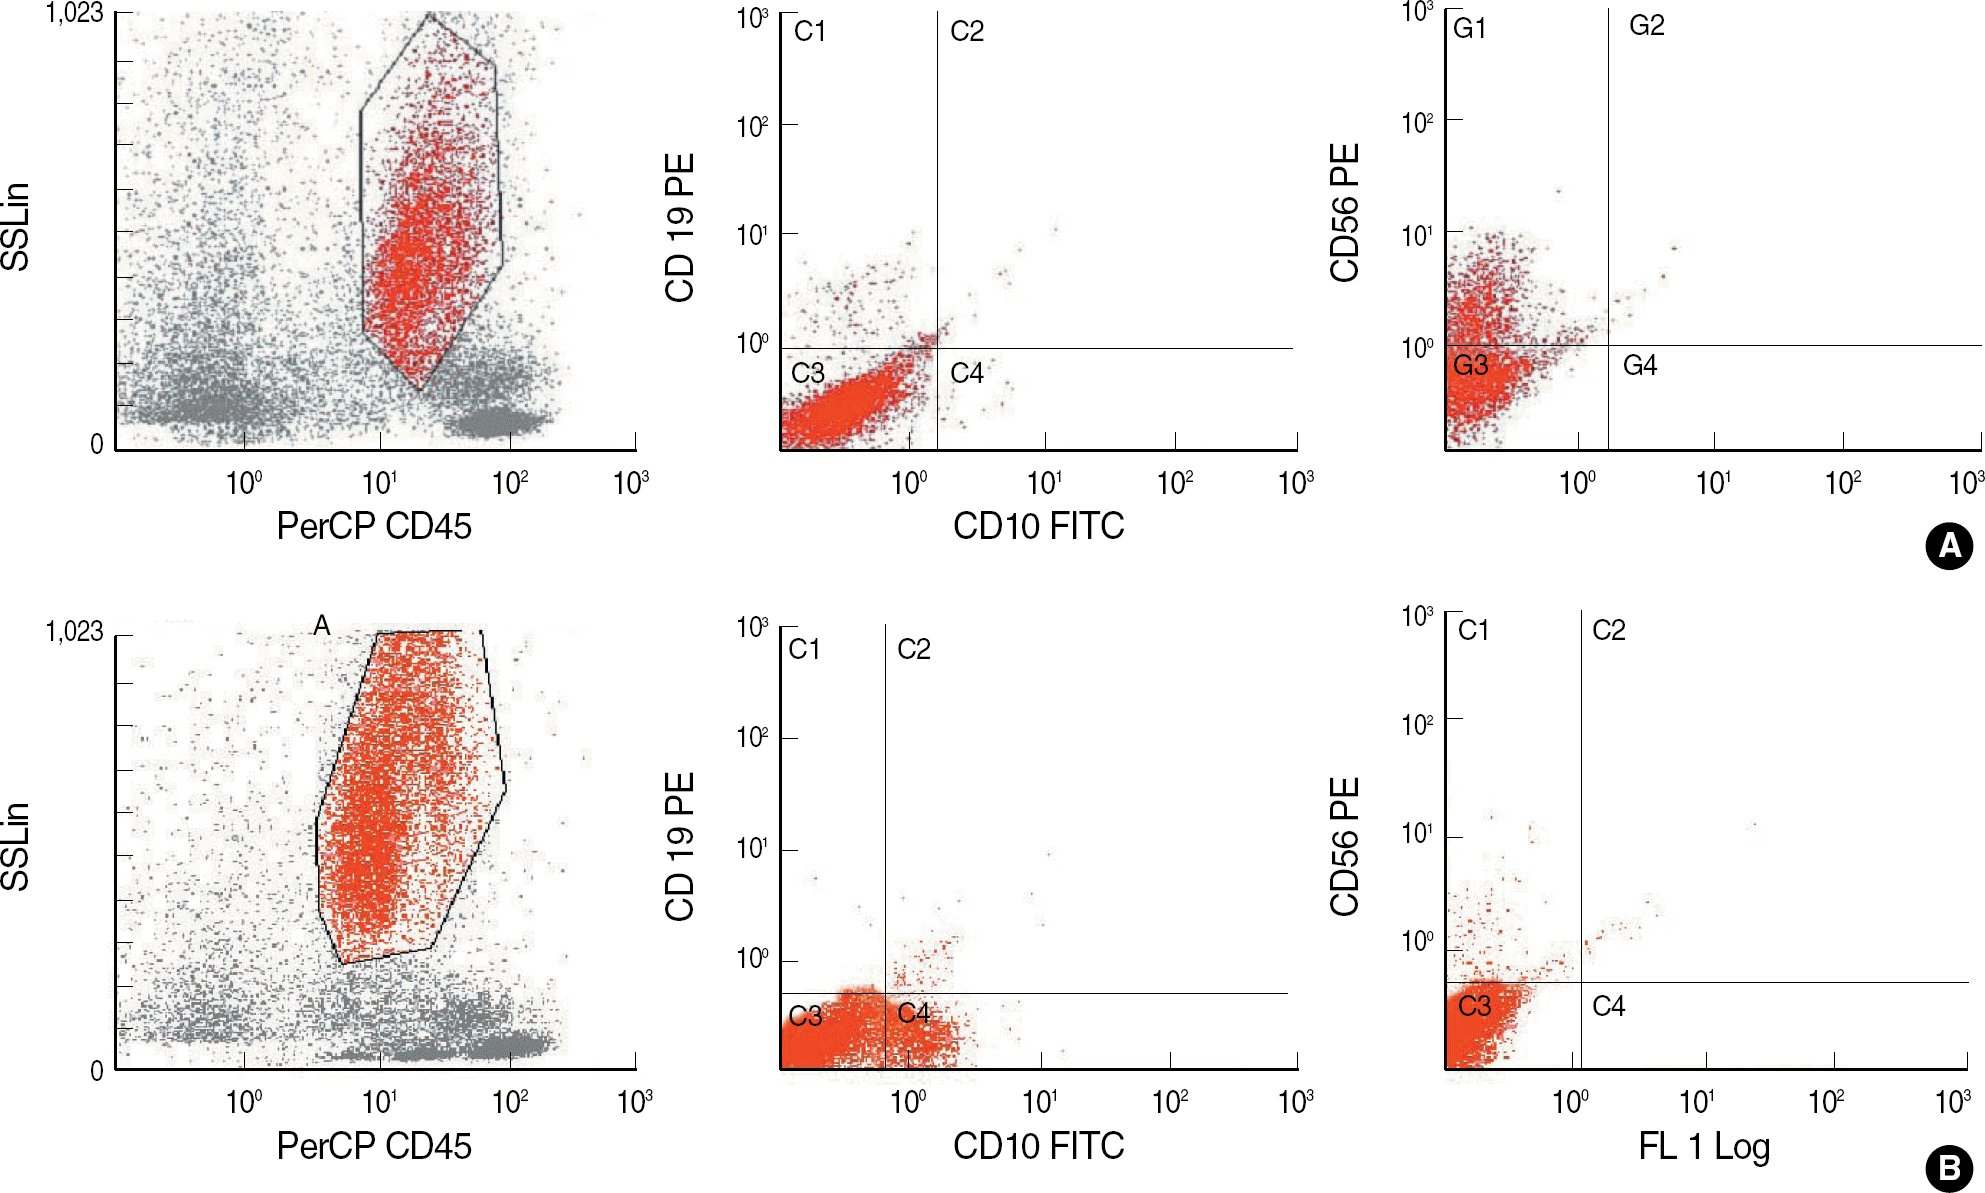
Compared to non-clonal disorders, the granulocytic lineages of MDS showed decreased SSC (P=0.005), increased CD45 intensity (P=0.020), decreased CD10-positive granulocytes (P= 0.030), and a higher CD56-positive rate (P=0.005). It is noteworthy that similar results were obtained in the leukemia group, and these findings were not related to the phenotypes of the leukemic cells. Using blast and monocytic gating, useful parameters for generating a differential diagnosis were not found.
Conclusions:
Gating the granulocytic region is a relatively easy method for MDS immunophenotyping. Among the parameters studied, SSC, CD10, and CD56 were the most useful for differentiating MDS from non-clonal disorders. While immunophenotypic changes in MDS appear to be useful for differentiating MDS from non-clonal disorders, these changes were also noted in the mature cells of leukemic patients.
Go to : 
REFERENCES
1.Kussick SJ., Fromm JR., Rossini A., Li Y., Chang A., Norwood TH, et al. Four-color flow cytometry shows strong concordance with bone marrow morphology and cytogenetics in the evaluation for myelodysplasia. Am J Clin Pathol. 2005. 124:170–81.

2.Ogata K., Kishikawa Y., Satoh C., Tamura H., Dan K., Hayashi A. Diagnostic application of flow cytometric characteristics of CD34+ cells in low-grade myelodysplastic syndromes. Blood. 2006. 108:1037–44.

3.Ogata K., Nakamura K., Yokose N., Tamura H., Tachibana M., Taniguchi O, et al. Clinical significance of phenotypic features of blasts in patients with myelodysplastic syndrome. Blood. 2002. 100:3887–96.

4.Xu D., Schultz C., Akker Y., Cannizzaro L., Ramesh KH., Du J, et al. Evidence for expression of early myeloid antigens in mature, non-blast myeloid cells in myelodysplasia. Am J Hematol. 2003. 74:9–16.

5.Wells DA., Benesch M., Loken MR., Vallejo C., Myerson D., Leisenring WM, et al. Myeloid and monocytic dyspoiesis as determined by flow cytometric scoring in myelodysplastic syndrome correlates with the IPSS and with outcome after hematopoietic stem cell transplantation. Blood. 2003. 102:394–403.

6.Stetler-Stevenson M., Arthur DC., Jabbour N., Xie XY., Molldrem J., Barrett AJ, et al. Diagnostic utility of flow cytometric immunophenotyping in myelodysplastic syndrome. Blood. 2001. 98:979–87.

7.Wood BL. Flow cytometric diagnosis of myelodysplasia and myeloproliferative disorders. J Biol Regul Homeost Agents. 2004. 18:141–5.
8.Swerdlow SH, Campo E, editors. WHO classification of tumours of haematopoietic and lymphoid tissues. 4th ed.Lyon: IARC Press;2008.
9.Casasnovas RO., Slimane FK., Garand R., Faure GC., Campos L., Deneys V, et al. Immunological classification of acute myeloblastic leukemias: relevance to patient outcome. Leukemia. 2003. 17:515–27.

10.Elghetany MT. Diagnostic utility of flow cytometric immunophenotyping in myelodysplastic syndrome. Blood. 2002. 99:391–2.

11.Chang CC., Cleveland RP. Decreased CD10-positive mature granulocytes in bone marrow from patients with myelodysplastic syndrome. Arch Pathol Lab Med. 2000. 124:1152–6.

12.Cherian S., Moore J., Bantly A., Vergilio JA., Klein P., Luger S, et al. Peripheral blood MDS score: a new flow cytometric tool for the diagnosis of myelodysplastic syndromes. Cytometry B Clin Cytom. 2005. 64:9–17.

13.Del Canizo MC., Fernandez ME., Lopez A., Vidriales B., Villaron E., Arroyo JL, et al. Immunophenotypic analysis of myelodysplastic syndromes. Haematologica. 2003. 88:402–7.
14.Orfao A., Ortuno F., de Santiago M., Lopez A., San Miguel J. Immunophenotyping of acute leukemias and myelodysplastic syndromes. Cytometry A. 2004. 58:62–71.

15.Ribeiro E., Matarraz Sudon S., de Santiago M., Lima CS., Metze K., Giralt M, et al. Maturation-associated immunophenotypic abnormalities in bone marrow B-lymphocytes in myelodysplastic syndromes. Leuk Res. 2006. 30:9–16.

16.Kussick SJ., Wood BL. Using 4-color flow cytometry to identify abnormal myeloid populations. Arch Pathol Lab Med. 2003. 127:1140–7.

17.Cermak J., Belickova M., Krejcova H., Michalova K., Zilovcova S., Zemanova Z, et al. The presence of clonal cell subpopulations in peripheral blood and bone marrow of patients with refractory cytopenia with multilineage dysplasia but not in patients with refractory anemia may reflect a multistep pathogenesis of myelodysplasia. Leuk Res. 2005. 29:371–9.
18.Dunphy CH., Orton SO., Mantell J. Relative contributions of enzyme cytochemistry and flow cytometric immunophenotyping to the evaluation of acute myeloid leukemias with a monocytic component and of flow cytometric immunophenotyping to the evaluation of absolute monocytoses. Am J Clin Pathol. 2004. 122:865–74.

19.Lorand-Metze I., Ribeiro E., Lima CS., Batista LS., Metze K. Detection of hematopoietic maturation abnormalities by flow cytometry in myelodysplastic syndromes and its utility for the differential diagnosis with non-clonal disorders. Leuk Res. 2007. 31:147–55.

20.Pirruccello SJ., Young KH., Aoun P. Myeloblast phenotypic changes in myelodysplasia. CD34 and CD117 expression abnormalities are common. Am J Clin Pathol. 2006. 125:884–94.
21.Terstappen LW., Safford M., Loken MR. Flow cytometric analysis of human bone marrow. III. Neutrophil maturation. Leukemia. 1990. 4:657–63.
22.Mann KP., DeCastro CM., Liu J., Moore JO., Bigner SH., Traweek ST. Neural cell adhesion molecule (CD56)-positive acute myelogenous leukemia and myelodysplastic and myeloproliferative syndromes. Am J Clin Pathol. 1997. 107:653–60.

23.Schlesinger M., Silverman LR., Jiang JD., Yagi MJ., Holland JF., Bekesi JG. Analysis of myeloid and lymphoid markers on the surface and in the cytoplasm of mononuclear bone marrow cells in patients with myelodysplastic syndrome. J Clin Lab Immunol. 1996. 48:149–66.
24.Malcovati L., Della Porta MG., Lunghi M., Pascutto C., Vanelli L., Travaglino E, et al. Flow cytometry evaluation of erythroid and myeloid dysplasia in patients with myelodysplastic syndrome. Leukemia. 2005. 19:776–83.

Go to : 
 | Fig. 1.Flow cytometric gating of bone marrow cells: Gating of sub-populations were based on CD45 intensities and side scatter (S-SC). Blasts (A, CD45intermediateSSClow), granulocytes (B, CD45intermediate SSChigh), and monocytes (C, CD45highSSClow-intermediate). |
 | Fig. 2.The distributions of granulocyte SSC in non-clonal disorders (A), MDS (B), and leukemia (C). Compared to non-clonal disorders, granulocyte SSC was significantly lower in the MDS and leukemia groups (P=0.005 and 0.000, respectively). Values are mean±2 SD of the SSC in each group.
Abbreviation: SSC, side scatter.
|
 | Fig. 3.Examples of immunophenotypes of granulocytes in MDS (A) and non-clonal disorders (B). In a patient with MDS, decreased SSC, absence of the CD10-positive population, and CD56 expression were noted (A) whereas CD10-positive cells were present, and CD56 was not expressed in patients with non-clonal disorders (B).
Abbreviation: SSC, side scatter.
|
Table 1.
Characteristics of non-clonal disorders, MDS, and leukemia
| Non-clonal disorders (N=24) | MDS (N=18) | Leukemia (N=18) | |
|---|---|---|---|
| Age (yr) | 37 (3-85) | 69 (3-80)∗ | 39 (1-76) |
| Sex (M:F) | 12:12 | 8:10 | 9:9 |
| Peripheral blood count | |||
| WBC (×109/L) | 5.3 (2.7-14.6) | 3.7 (0.5-58.9) | 17.1 (0.6-170.8)∗1 |
| Hb (g/dL) | 11.9 (7.3-15.7) | 8.9 (5.9-12.5)∗ | 9.2 (4.8-16.0)∗ |
| PLT (×109/L) | 162 (6-505) | 67 (4-741) | 53 (8-192)∗ |
| Bone marrow | |||
| Blast (%) | 1.6 (0.8-4.4) | 1.5 (0.2-14.8) | 60 (14-92.8)∗† |
| Granulocyte | 47.2 (21.8-72.4) | 41.5 (7.2-66.4) | 13.2 (0.2-52.0)∗† |
| lineage (%) | |||
| Monocyte | 1.5 (0.4-14.3) | 1.6 (0.4-33.0) | 1.6 (0.0-10.8) |
| lineage (%) | |||
| Cytogenetics | |||
| Normal (%) | 22/22 (100) | 11/16 (69)∗ | 11/18 (61)∗ |
| Abnormal (%) | 0 | 5/16 (31) | 7/18 (39) |
Table 2.
Combinations of monoclonal antibodies
| FITC | PE | PC5 |
|---|---|---|
| CD10 | CD19 | CD45 |
| CD20 | CD5 | CD45 |
| CD3 | CD22 | CD45 |
| CD7 | CD33 | CD45 |
| HLA-DR | CD13 | CD45 |
| CD14 | CD34 | CD45 |
| CD56 | CD45 |
Table 3.
Immunophenotypic features of non-blast, myeloid cells
| Non-clonal disorders (N=24) | MDS (N=18) | AML (N=9) | All leukemia (N=18) | |
|---|---|---|---|---|
| % of gated cells | 51.8 (12.8-66.9) | 42.0 (6.0-70.3)∗ | 12.2 (2.4-50.8)∗ | 12.2 (2.4-50.8)∗ |
| SSC, MFI | 627 (491-707) | 543 (346-780)∗ | 408 (323-658)∗† | 504 (323-772)∗ |
| CD45, MFI | 12.8 (6.0-25.2) | 16.8 (9.1-43.0)∗ | 17.1 (0.9-25.2) | 13.8 (0.9-25.2) |
| CD33 | ||||
| Positive rate (%) | 22/24 (91.6) | 16/18 (88.9) | 8/9 (88.8) | 13/18 (72.2) |
| % of positive cells | 58.7 (11.8-92.4) | 63.0 (10.6-93.6) | 76.3 (4.7-93.7) | 58.8 (4.3-93.7) |
| MFI | 1.2 (0.7-2.2) | 1.4 (0.7-6.0) | 2.0 (1.4-5.3)∗ | 1.0 (0.6-5.2)∗ |
| CD13 | ||||
| Positive rate (%) | 24/24 (100.0) | 18/18 (100.0) | 9/9 (100.0) | 18/18 (100.0) |
| % of positive cells | 72.6 (28.5-90.2) | 75.7 (41.4-92.4) | 84.4 (64.8-94.8)∗ | 82.9 (58.7-99.6)∗ |
| MFI | 2.0 (1.5-4.3) | 1.9 (1.2-7.7) | 3.4 (1.3-5.5)∗ | 2.8 (1.2-6.1)∗ |
| CD10 | ||||
| Positive rate (%)‡ | 8/24 (33.3) | 1/18 (5.5)∗ | 0/9 (0.0)∗ | 1/18 (5.6)∗ |
| % of positive cells | 13.2 (8.7-50.1) | - | - | 81.5 |
| MFI | 1.4 (1.2-2.0) | - | - | 2.12 |
| CD56, positive rate (%) | 1/24 (4.1) | 7/18 (38.9)∗ | 4/9 (44.4)∗ | 6/18 (33.3)∗ |
| CD14, positive rate (%) | 0/24 (0.0) | 2/18 (11.1) | 1/9 (11.1) | 1/18 (5.6) |
Table 4.
Characteristics of leukemic patients with CD56-positive granulocytes
Table 5.
Immunophenotypic features of monocytic cells
| Non-clonal disorders (N=24) | MDS (N=16) | Leukemia (N=6) | |
|---|---|---|---|
| Percentage of gated cells | 4.4 (1.3-7.6) | 7.0 (1.9-35.7)∗ | 6.9 (2.2-33.6)∗ |
| SSC, MFI | 148 (120-186) | 157 (126-204)∗ | 152 (96-184) |
| CD45, MFI | 51.5 (36.7-95.5) | 61.9 (40.5-121.0) | 57.1 (3.4-64.9)† |
| CD33 | |||
| Positive rate (%) | 24/24 (100) | 16/16 (100.0) | 6/6 (100.0) |
| % of positive cells | 83.2 (63.7-94.8) | 81.9 (53.6-96.5) | 92.4 (81.0-94.5) |
| MFI | 3.7 (1.3-8.0) | 4.0 (0.8-5.2) | 4.1 (2.4-5.5) |
| CD13 | |||
| Positive rate (%) | 24/24 (100.0) | 16/16 (100.0) | 6/6 (100.0) |
| % of positive cells | 81.0 (33.0-96.2) | 81.6 (50.6-96.5) | 92.6 (77.3-97.0) |
| MFI | 3.4 (1.6-11.1) | 2.9 (1.4-8.3) | 5.1 (2.4-12) |
| CD14 | |||
| Positive rate (%) | 24/24 (100.0) | 16/16 (100.0) | 6/6 (100.0) |
| Percentage of positive cells | 69.6 (36.1-84.4) | 62.9 (27.6-95.8) | 82.3 (72.3-93.7) |
| MFI | 5.9 (2.3-14.9) | 8.2 (4.5-11.3) | 12 (6.6-14) |
| CD56, positive rate | 0/24 (0.0) | 1/16 (6.3) | 0/6 (0.0) |
Table 6.
Immunophenotypic features of blast gating
| Non-clonal disorders (N=19) | MDS (N=14) | |
|---|---|---|
| Percentage of gated cells | 4.6 (0.5-6.7) | 4.1 (0.2-9.4) |
| SSC, MFI | 130 (45-164) | 105 (46.3-149.0) |
| CD45, MFI | 10.2 (7.3-18.7) | 12.4 (6.9-21.7) |
| CD33 | ||
| Positive rate (%) | 16/19 (84.2) | 11/14 (78.6) |
| % of positive cells | 30.8 (0.0-53.7) | 36.1 (0.0-78.4) |
| MFI | 2.9 (1.3-5.2) | 2.6 (0.8-3.6) |
| CD13 | ||
| Positive rate (%) | 17/19 (89.5) | 12/14 (85.7) |
| % of positive cells | 53.7 (0.0-79.0) | 52 (0.0-71.6) |
| MFI | 3.0 (1.6-7.0) | 2.2 (1.4-3.1)∗ |
| CD34 | ||
| Positive rate (%) | 18/19 (94.7) | 13/14 (92.9) |
| % of positive cells | 30.8 (14.8-70.3) | 33.2 (12.9-81.9) |
| MFI | 3.1 (1.9-3.9) | 3.4 (1.7-6.4) |
| HLA-DR | ||
| Positive rate (%) | 19/19 (100.0) | 14/14 (100.0) |
| % of positive cells | 50.0 (26.0-82.7) | 58.4 (30.5-90.5) |
| MFI | 7.2 (3.9-13.5) | 6.0 (2.0-13.2) |
| CD19 | ||
| Positive rate (%)† | 14/19 (73.6) | 11/14 (78.6) |
| % of positive cells | 20 (6.3-60.0) | 13.3 (4.5-81.6) |
| CD56, Positive rate (%) | 0/19 (0.0) | 3/14 (21.4)∗ |
| CD5, Positive rate (%) | 0/19 (0.0) | 1/14 (7.1) |


 PDF
PDF ePub
ePub Citation
 Print
Print


 XML Download