Abstract
Background:
The bone marrow (BM) cellularity has been used as a major index for the evaluation of hematologic diseases and malignancies. However, the microscopic evaluation lacks objectivity because of considerable variations among different observers. We measured myelocrit cellularity as an objective method to evaluate the cellularity.
Methods:
Between November 2007 and January 2008, 489 consecutive BM aspirates including 25 cases of AML D7 marrow (7 days after initiation of chemotherapy) were examined. The conventional BM cellularity was evaluated using BM needle biopsies after hematoxylin-eosin stain. EDTA-anticoagulated BM aspirates were put into the Wintrobe tubes, centrifuged and the thickness of 5 layers from the bottom was measured: RBC, buffy coat (BC), plasma, BM particle, and fat layers. The myelocrit cellularity was defined as the ratio of BC to the BC plus fat layers.
Results:
Both of the thickness of BC layer (r=0.721, P=0.000) and the myelocrit cellularity (r=0.735, P=0.000) correlated well with the conventional cellularity. However, the AML D7 BM cellularity correlated with BC layer (r=0.589, P=0.002), but not with the myelocrit cellularity (r=0.281, P=0.231). The cellularity of the BM other than AML D7 marrow showed a better correlation with the myelocrit cellularity (r=0.826, P=0.000) than the BC layer (r=0.713, P=0.000).
Go to : 
REFERENCES
1.Dirnhofer S., Went P., Tichelli A. Diagnostic problems in follow-up bone marrow biopsies of patients treated for acute and chronic leukaemias and MDS. Pathobiology. 2007. 74:115–20.

2.Hartsock RJ., Smith EB., Petty CS. Normal variations with aging of the amount of hematopoietic tissue in bone marrow from the anterior iliac crest. A study made from 177 cases of sudden death examined by necropsy. Am J Clin Pathol. 1965. 43:326–31.

3.Alyas F., Saifuddin A., Connell D. MR imaging evaluation of the bone marrow and marrow infiltrative disorders of the lumbar spine. Magn Reson Imaging Clin N Am. 2007. 15:199–219.

4.Richards MA., Webb JA., Malik S., Jewell SE., Amess JA., Lister TA. Low field strength magnetic resonance imaging of bone marrow in acute leukaemia. Hematol Oncol. 1988. 6:285–90.

Go to : 
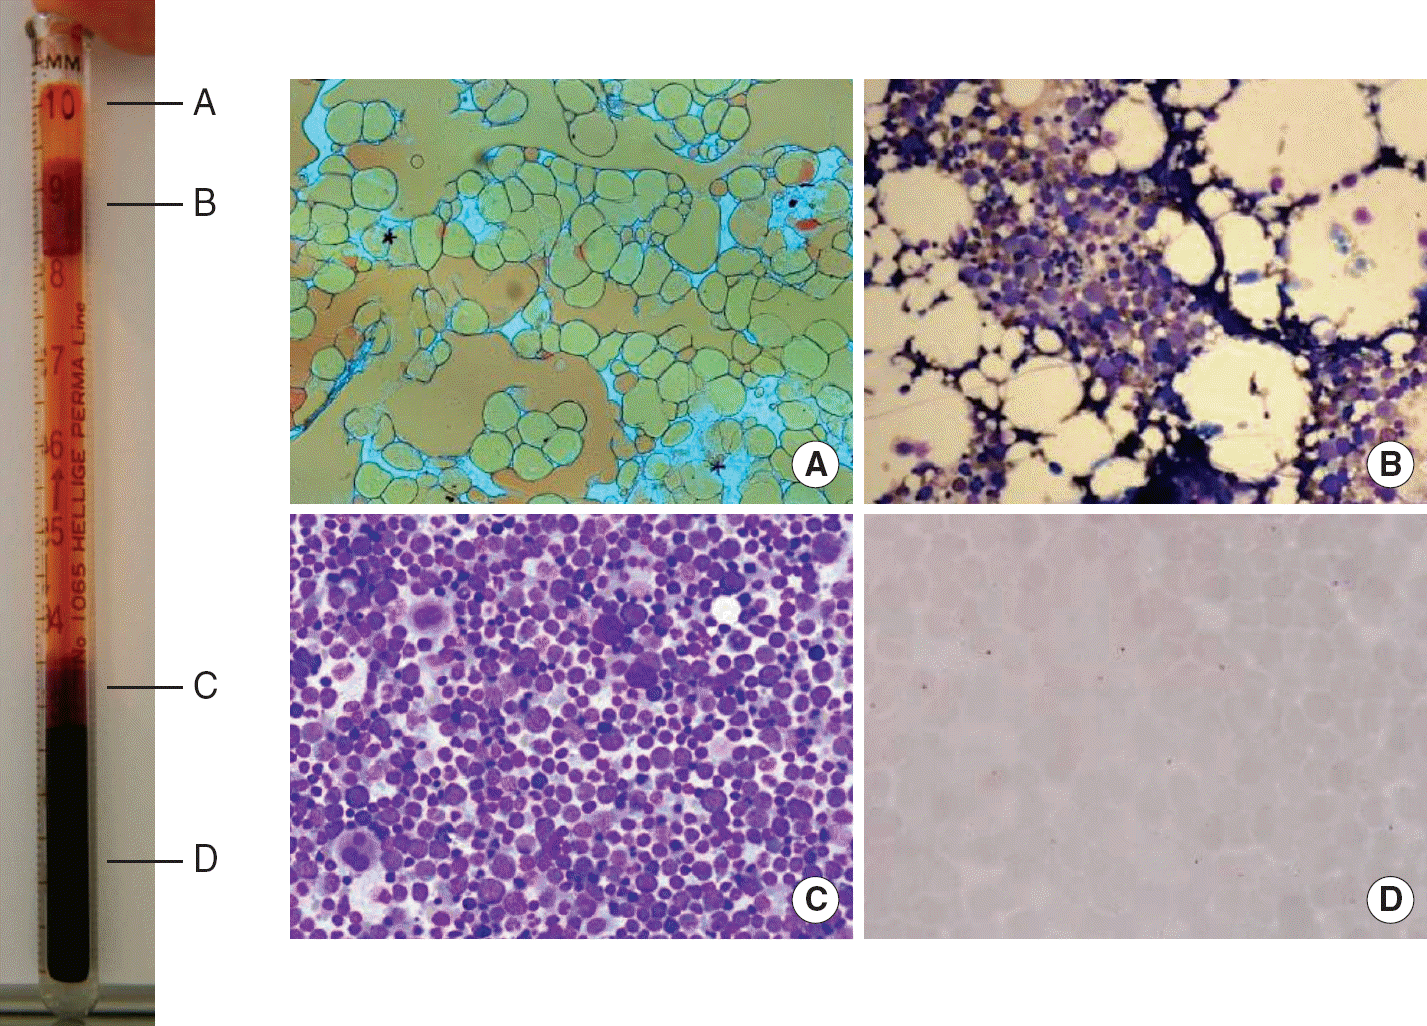
 | Fig. 1.Myelocrit measurement of a normal bone marrow aspirate sample in Wintrobe tube and microscopic findings of the separated layers. From the surface, 5 layers are well separated: fat (A, oil red O stain, ×100), bone marrow particle (B, Wright stain, ×100), plasma, nucleated cells (C, Wright stain, ×200) and red blood cells (D, Wright stain, ×200). |
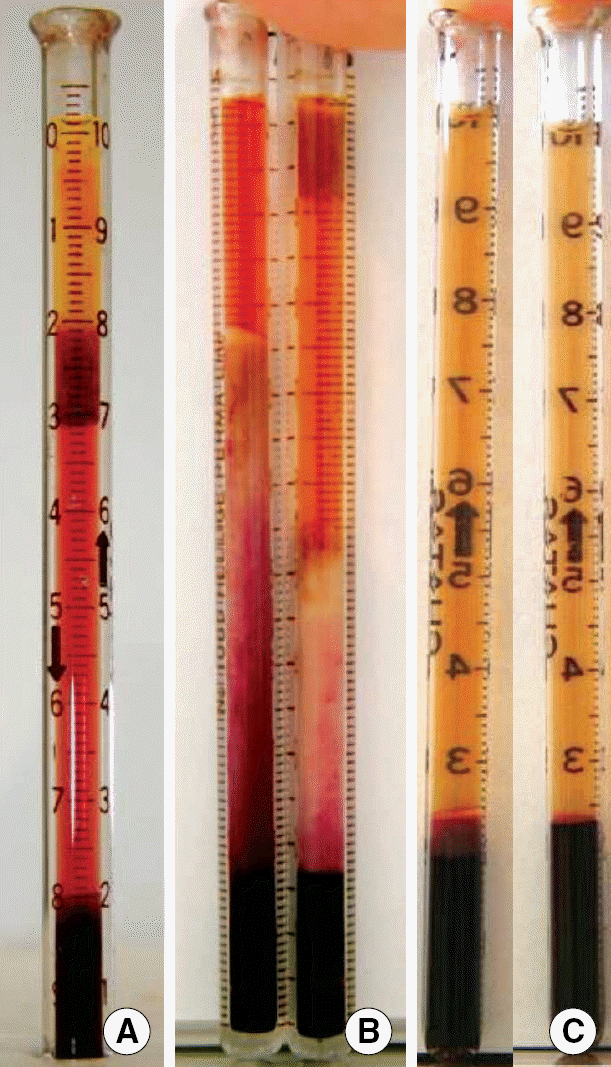
 | Fig. 2.Myelocrits of bone marrow aspirates of patients with various diseases. The myelocrit of aplastic anemia (A) shows a long fat layer (22 mm), particle layer (10 mm), plasma layer and a small buffy coat layer (2 mm). The myelocrits of acute leukemia (B) show very large buffy coat layers and thin fat layers without (left) or with (right) a bone marrow particle layer. The myelocrits of AML 7 days after chemotherapy (C) show indistinct fat and bone marrow particle layers with (5 mm, left) or without (<0.5 mm, right) distinct nucleated cell layers. The bone marrow smear of the case with distinct nucleated cell layer shows remaining leukemic cells. However, that of the case without distinct nucleated cell layer shows no definite leukemic cells. |
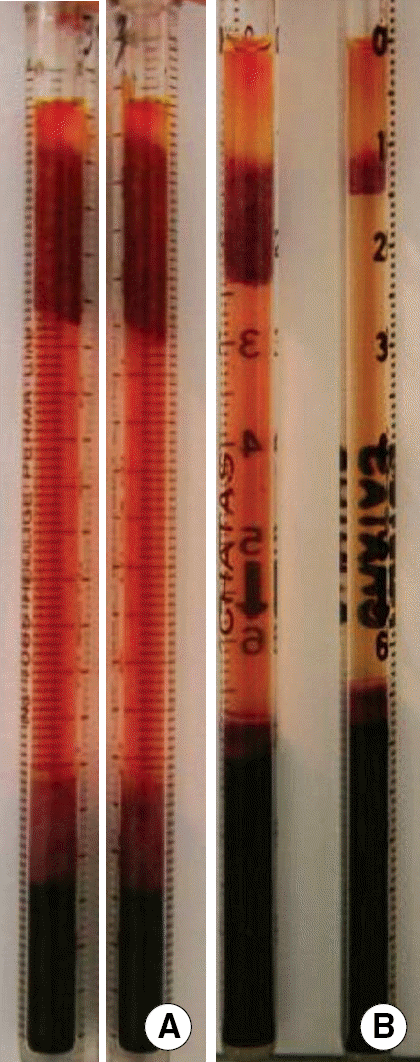
 | Fig. 3.(A) Duplication of myelocrit test shows less than 5% of variation in thickness of each layer. (B) After resuspension of the bone marrow aspirates using Pasteur pipette several times, the thickness of bone marrow particle layer decreases and that of other layers increases proportionally. |
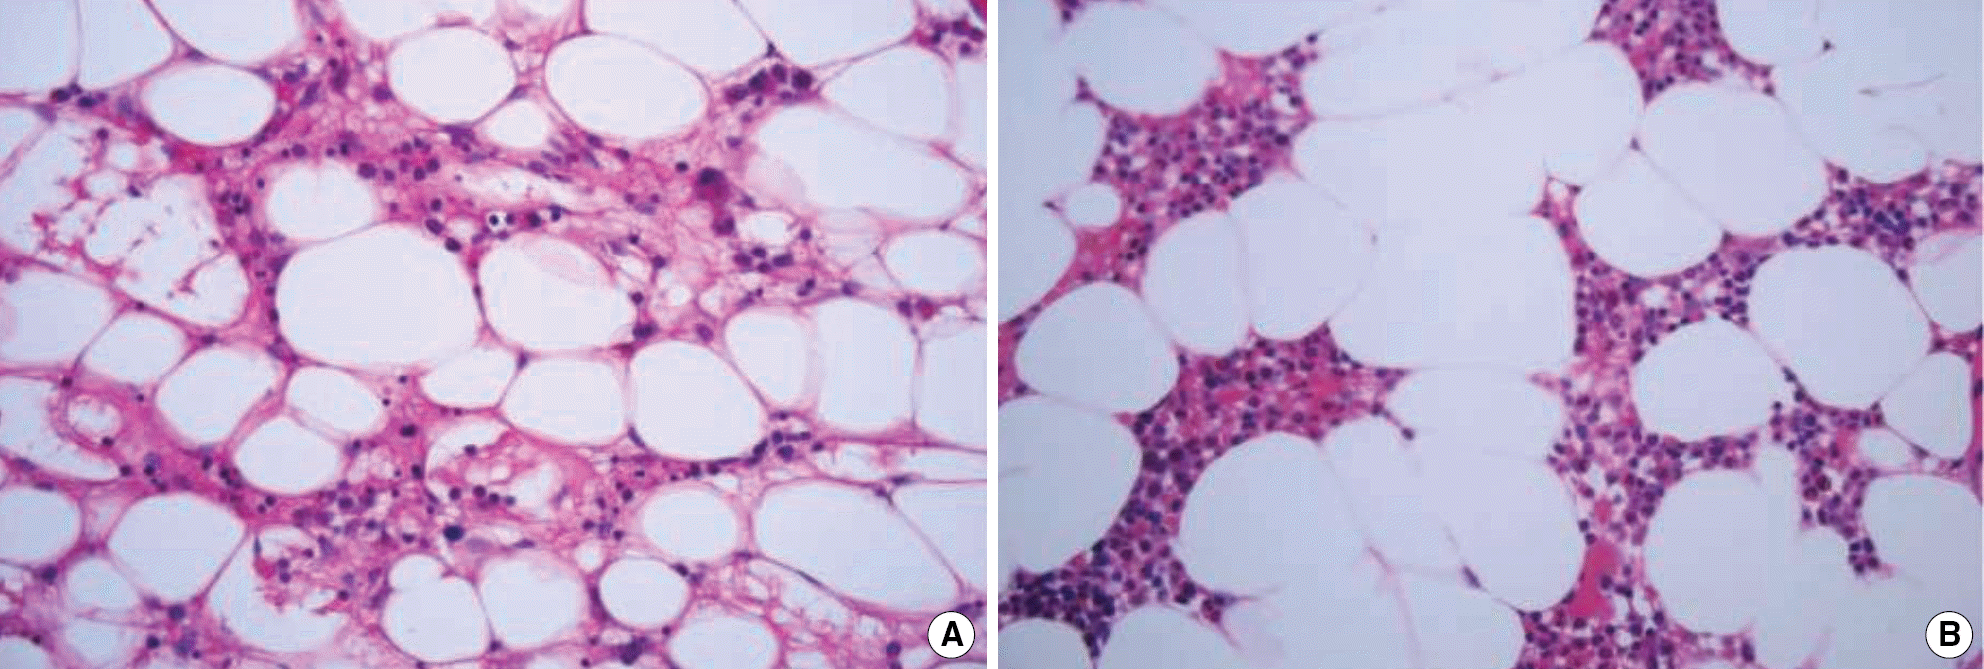
 | Fig. 4.The bone marrow biopsy of an AML patient 7 days after chemotherapy (A) shows sparsely distributed nucleated cells with incomplete regeneration of fat compared to a normal bone marrow (B) (hematoxylin and eosin stain, ×100). |
Table 1.
Myelocrits of patients according to diagnosis
Table 2.
Myelocrits of AML D7 patients in comparison with others
| Group | RBC | Buffy coat | Plasma | BM particle | Fat | BM cellularity (%) | Myelocrit cellularity∗ (%) |
|---|---|---|---|---|---|---|---|
| Total (N=489) | 26.1 ±7.3† | 7.5±8.9 | 54.9±11.8 | 3.7±5.2 | 4.9±5.5 | 44.1±26.9 | 57.5±30.0 |
| AML D7 (N=25) | 26.1±3.6 | 1.4±1.4 | 71.4±5.4 | 0.3±0.5 | 0.2±0.3 | 20.4±15.4 | 85.4±21.0 |
| Others (N=464) | 26.1±7.5 | 8.1±9.1 | 53.9±11.4 | 3.9±5.3 | 5.3±5.5 | 45.1±27.3 | 55.4±29.4 |
Table 3.
Correlations of myelocrit cellularities to bone marrow cellularities in patients
| Group | RBC | Buffy coat∗ | Plasma | BM particle | Fat | Myelocrit cellularity∗, † |
|---|---|---|---|---|---|---|
| r (P) | r (P) | r (P) | r (P) | r (P) | r (P) | |
| Total | -0.187 | 0.721 | -0.170 | -0.152 | -0.414 | 0.735 |
| (<0.001) | (<0.001) | (<0.001) | (<0.001) | (<0.001) | (<0.001) | |
| AML D7 | -0.181 | 0.589 | 0.054 | -0.152 | -0.102 | 0.281 |
| (0.387) | (0.002) | (0.798) | (0.469) | (0.628) | (0.231) | |
| Others | -0.194 | 0.713 | -0.157 | -0.173 | -0.478 | 0.826 |
| (<0.001) | (<0.001) | (0.001) | (<0.001) | (<0.001) | (<0.001) |


 PDF
PDF ePub
ePub Citation
 Print
Print


 XML Download