Abstract
Background:
Point-of-care (POC) tests are used increasingly due to fast results and simple test procedures, which enables rapid diagnosis and therapeutic monitoring. We evaluated the performance of the Piccolo xpress Chemistry Analyzer (Abaxis, USA) a POC chemistry analyzer.
Methods:
Fourteen analytes, Na+, K+, Cl-, Ca2+, total carbon dioxide, AST, ALT, total bilirubin, alkaline phosphatase, blood urea nitrogen, creatinine, albumin, total protein, and glucose; were measured simultaneously with a 100 μL of whole blood sample using a Comprehensive Metabolic Reagent disk. Within-run and total precision and linearity were evaluated according to CLSI EP15-A and EP6-A guidelines, respectively. Comparison with a central laboratory chemistry analyzer was performed using 144 patient samples.
Results:
The coefficients of variations of within-run and total precision were all within 5% for three levels except for total carbon dioxide, ALT, alkaline phosphatase, total bilirubin, and creatinine in low level, and creatinine in middle level. The results of 14 analytes were linear within a commonly encountered range in clinical samples (r2≥0.98). More than 10% of samples in Na+, AST, ALT, glucose, BUN did not satisfy CLIA analytical quality requirement.
Conclusions:
The Piccolo xpress Chemistry Analyzer can analyze multiple analytes with a minimal amount of whole blood in a short time. It showed an acceptable performance for precision, linearity and comparison with central laboratory analyzer. It can be useful as a screening tests modality in mobile clinics, ambulances, and field clinics for military use, and for pediatric patients from whom enough sample volume is difficult to obtain.
REFERENCES
2.Min WK. The trend of clinical chemistry. Medical Postgraduates. 2003. 31:251–4. (민원기. 임상화학의현황. 녹십자의보 2003;31:251-4.).
3.Clinical and Laboratory Standards Institute. User verification of performance for precision and trueness; Approved guideline-2nd edi. Document EP15-A2. Wayne, PA: Clinical and Laboratory Standards Institute;2005. p. 25.
4.Clinical and Laboratory Standards Institute. Evaluation of the linearity of quantitative measurement procedures: a statistical approach; Approved guideline. Document EP6-A. Wayne, PA: Clinical and Laboratory Standards Institute;2003. p. 23.
5.Clinical and Laboratory Standards Institute. Method comparison and bias estimation using patient samples; Approved guideline-2nd edi. Document EP9-A2. Wayne, PA: Clinical and Laboratory Standards Institute;2002. p. 22.
6.Mestric ZF., Perkov S. Comparability of point-of-care whole-blood electrolyte and substrate testing using a Stat Profile Critical Care Xpress analyzer and standard laboratory methods. Clin Chem Lab Med. 2006. 44:898–903.

7.Drenck NE. Point of care testing in critical care medicine: the clinician's view. Clin Chim Acta. 2001. 307:3–7.

8.Tortella BJ., Lavery RF., Lavery RF., Siegel JH. Precision, accuracy, and managed care implications of a hand-held whole blood analyzer in the prehospital setting. Clin Chem. 1996. 106:124–7.

9.Ricos C., Alverez V., Caba F., Garcia-Lario JV., Hernandez A., Jiminez CV, et al. Current databases on biologic variation: pros, cons, and progress. Scand J Clin Lab Invest. 1999. 59:491–500.
10.Barrett AE., Cameron SJ., Fraser CG., Penberthy LA., Shand KL. A clinical view of analytical goals in clinical biochemistry. J Clin Pathol. 1979. 32:893–6.

11.Harding PJ., Fraser CG. Biological variation of blood acidbase status: consequences for analytical goal-setting and interpretation of results. Clin Chem. 1987. 33:1416–8.

12.Kost GJ., VU HT., Inn M., DuPlantier R., Fleisher M., Kroll MH, et al. Multicenter study of whole-blood creatinine, total carbon dioxide content, and chemistry profiling for laboratory and point-of care testing in critical care in the United States. Crit Care Med. 2000. 28:2379–89.
13.Zady FM. Z-STATS 12: correlation and simple least squares regression. [Westgard Website]. Available at. www.westgard.com/lesson42.htm. Accessed December 6,. 2006.
14.Westgard J. Charts of operational process specifications (“OPSpecs charts”) for assessing the precision, accuracy, and quality control needed to satisfy proficiency testing performance criteria. Clin Chem. 1992. 38:1226–33.

15.Yi SG., Lee SY., Kim JW. Evaluation of the i-STAT point-of-care testing analyzer. Korean J Lab Med. 2002. 22:304–11. ((이상곤, 이수연, 김종원. 현장검사기기 i-STAT 의평가. 대한진단검사의학회지 2002;22:304-11.).
16.Vanavanan S., Chittamma A. Performance of a multi-profile critical care testing analyzer. Clin Chem Lab Med. 2008. 46:9–14.

17.Burtis CA, Ashwood ER, editors. Tietz Textbook of Clinical Chemistry and Molecular Diagnostics. 4th ed.Missouri: Elsevier Saunders;2006. :47.
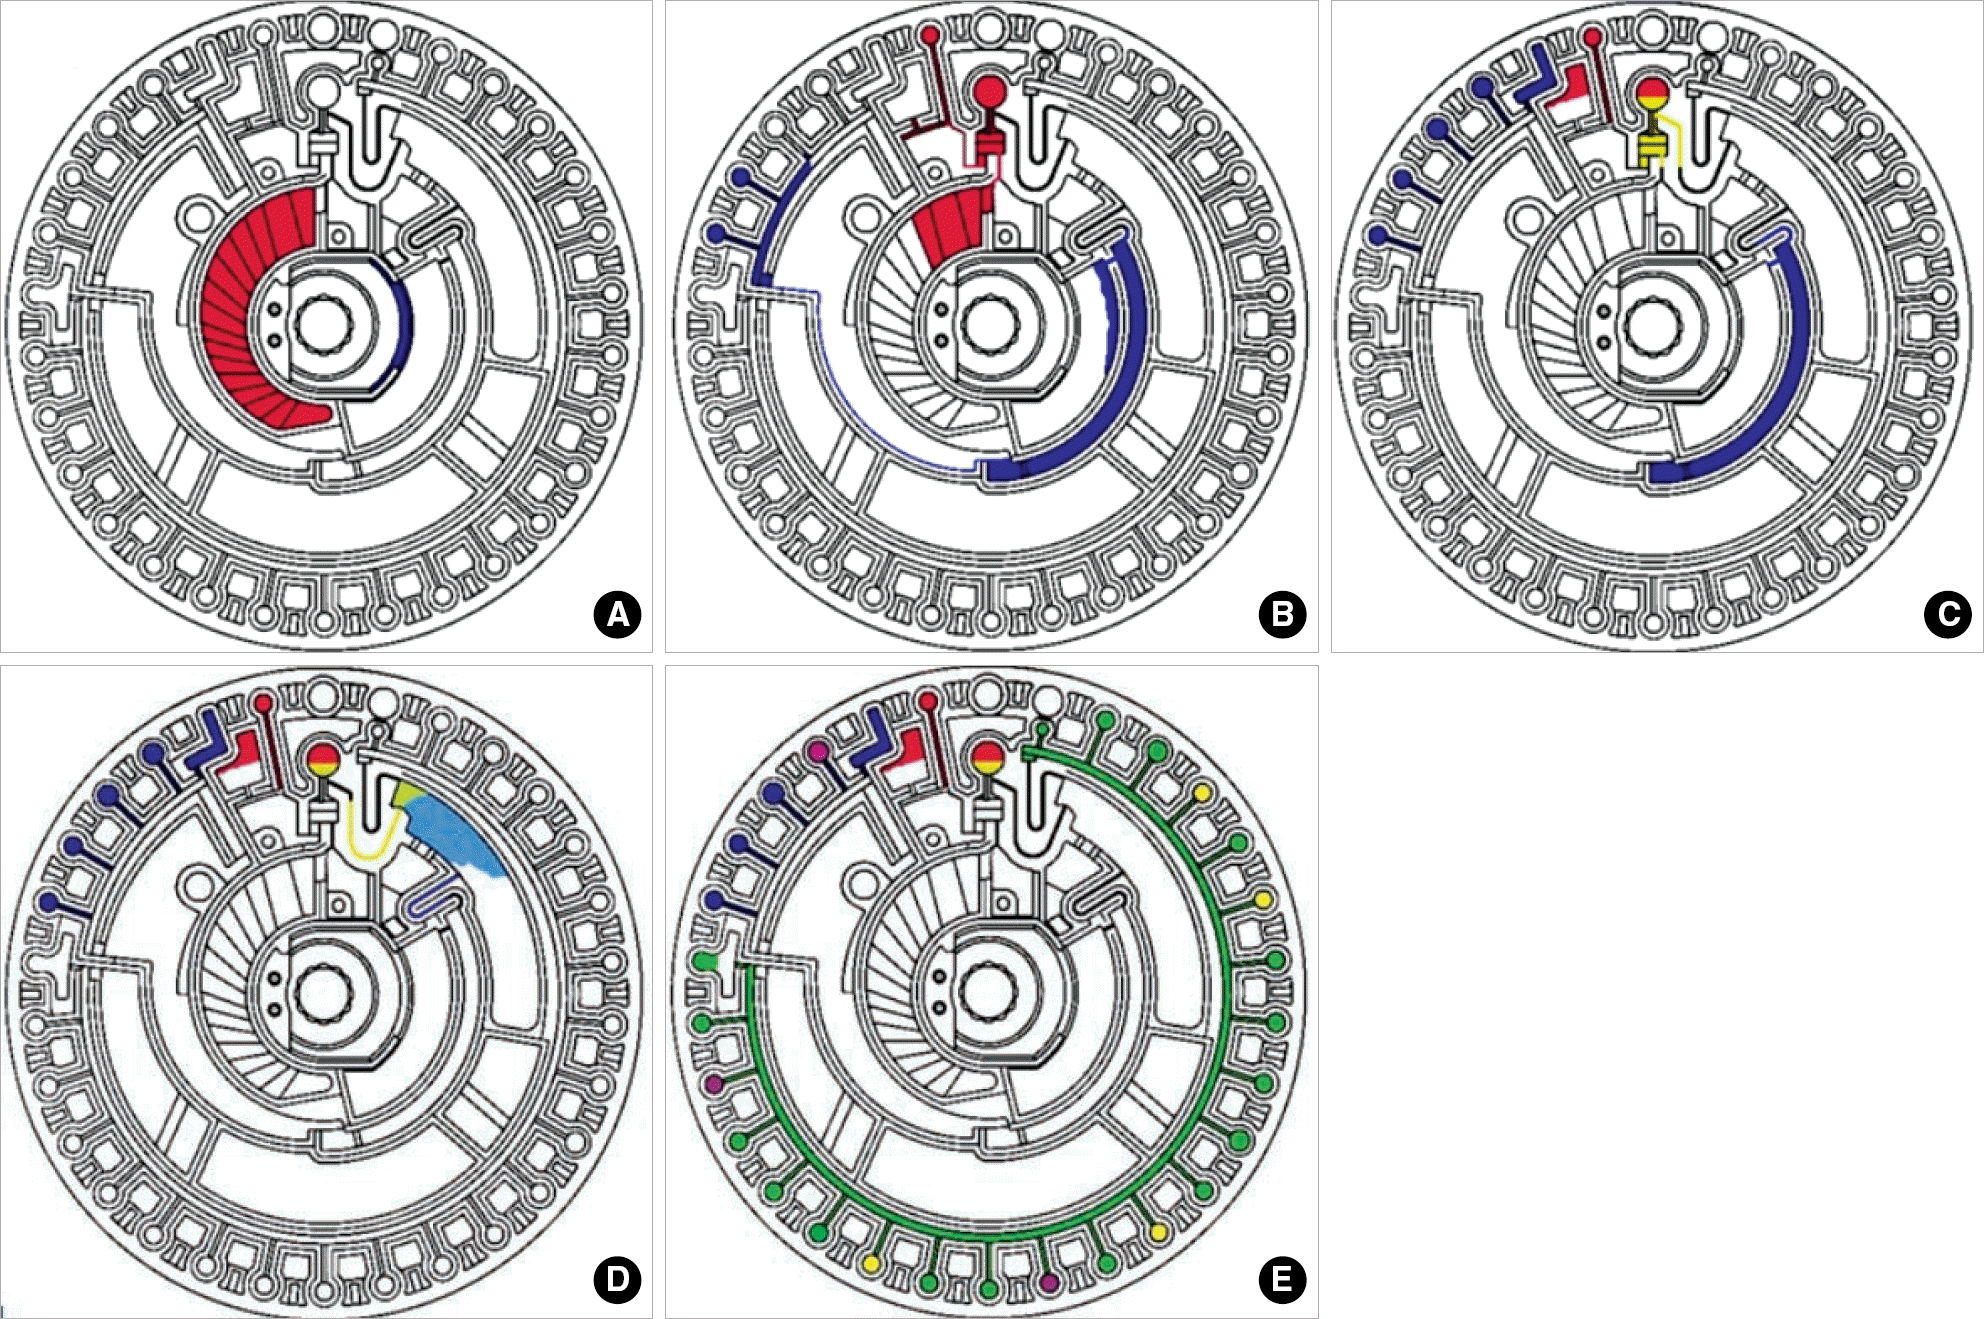
Fig. 1.
Measuring sequence of Piccolo xpress Chemistry Analyzer. (A) Blood sample is applied and diluent container is opened. (B) Diluent and blood sample enter the quality control cuvettes and blood sample enters the centrifugal chamber. (C) Centrifuge is performed. (D) Centrifuged sample and diluent are mixed. (E) The assay cuvettes are filled and analysis is performed (This schematic diagram was permitted from Abaxis system).

Fig. 2.
Correlations of 14 analytes of Comprehensive Metabolic Reagent disk between Piccolo xpress Chemistry Analyzer and TBA 200-FR. Dashed line indicates mean bias.
Abbreviations: tCO2, total carbon dioxide; ALP, alkaline phosphatase; BUN, blood urea nitrogen.

Table 1.
Principles of procedures of Piccolo xpress Chemistry Analyzer
Table 2.
Precision of the Piccolo xpress Chemistry Analyzer by Liquid Unassayed Multiqual®
Table 3.
Linearity of the Piccolo xpress Chemistry Analyzer
Table 4.
Correlations between Piccolo xpress Chemistry Analyzer and TBA 200-FR
| Analytes | Unit | Range | Slope (95% CI) | Intercept (95% CI) | Bias (Mean±SD) | P value∗ | Bias% (Mean±SD) | CLIA requirement | Percent of samples not satisfying CLIA requirement† | R |
|---|---|---|---|---|---|---|---|---|---|---|
| Na+ | mmol/L | 110-170 | 0.977 (0.919-1.036) | 6.0 (-2.1-14.2) | 2.9±4.0 | <0.001 | 2.1±3.2 | Target±4 | 34.7 | 0.9355 |
| K+ | mmol/L | 2.9-8.5 | 0.968 (0.942-0.993) | 0.19 (0.05-0.33) | 0.0±0.2 | 0.198 | 0.8±5.1 | Target±0.5 | 1.4 | 0.9874 |
| Cl- | mmol/L | 80-133 | 0.943 (0.907-0.978) | 4.8 (1.0-8.7) | -1.4±2.8 | <0.001 | -1.3±2.6 | Target±5% | 4.2 | 0.9748 |
| Ca2+ | mg/dL | 6.4-16.0 | 0.955 (0.930-0.980) | 0.75 (0.49-1.01) | 0.3±0.5 | <0.001 | 3.4±5.5 | Target±1.0 | 3.5 | 0.9879 |
| tCO2 | mmol/L | 10-37 | 0.696 (0.592-0.799) | 9.4 (7.0-11.9) | 2.3±3.5 | <0.001 | 11.9±16.5 | NA | NA | 0.6534 |
| AST | U/L | 16-269 | 0.889 (0.877-0.902) | 11.8 (11.2-12.4) | 8.0±5.1 | <0.001 | 41.9±28.2 | Target±20% | 10.5 | 0.9966 |
| ALT | U/L | 8-560 | 0.846 (0.834-0.858) | 11.2 (10.4-12.1) | 5.5±10.9 | <0.001 | 47.6±56.1 | Target±20% | 42.7 | 0.9965 |
| ALP | U/L | 30-601 | 0.798 (0.786-0.810) | 5.4 (3.4-7.4) | -19.4±25.4 | <0.001 | -13.4±7.0 | Target±30% | 0 | 0.9960 |
| Total bilirubin | mg/dL | 0.4-13.4 | 0.902 (0.891-0.913) | 0.17 (0.15-0.20) | 0.1±0.23 | 0.006 | 19.5±26.8 | Target±0.4 or ±20% (greater) | 1.4 | 0.9973 |
| Glucose | g/dL | 44-451 | 0.938 (0.916-0.960) | -0.5 (-3.5-2.5) | -7.9±9.4 | <0.001 | -1.9±58.2 | Target±6 or ±10% (greater) | 25.0 | 0.9905 |
| BUN | g/dL | 5-101 | 0.982 (0.968-0.997) | -0.9 (-1.3~-0.6) | -1.3±1.4 | <0.001 | -6.3±11.8 | Target±2 or ±9% (greater) | 14.7 | 0.9963 |
| Creatinine | mg/dL | 0.2-10.8 | 1.045 (1.033-1.057) | -0.26 (-0.28~-0.23) | -0.2±0.2 | <0.001 | -21.1±15.9 | Target±0.3 or ±15% (greater) | 2.2 | 0.9978 |
| Albumin | mg/dL | 1.6-4.9 | 1.058 (1.011-1.105) | -0.61 (-0.80~-0.42) | -0.4±0.2 | <0.001 | -10.1±6.9 | Target±10% | 3.5 | 0.9646 |
| Total protein | mg/dL | 4.3-9.5 | 1.080 (1.024-1.136) | -0.34 (-0.72-0.04) | 0.2±0.3 | <0.001 | 3.0±4.0 | Target±10% | 2.8 | 0.9520 |


 PDF
PDF ePub
ePub Citation
 Print
Print


 XML Download