Abstract
Background
Methods
Results
REFERENCES
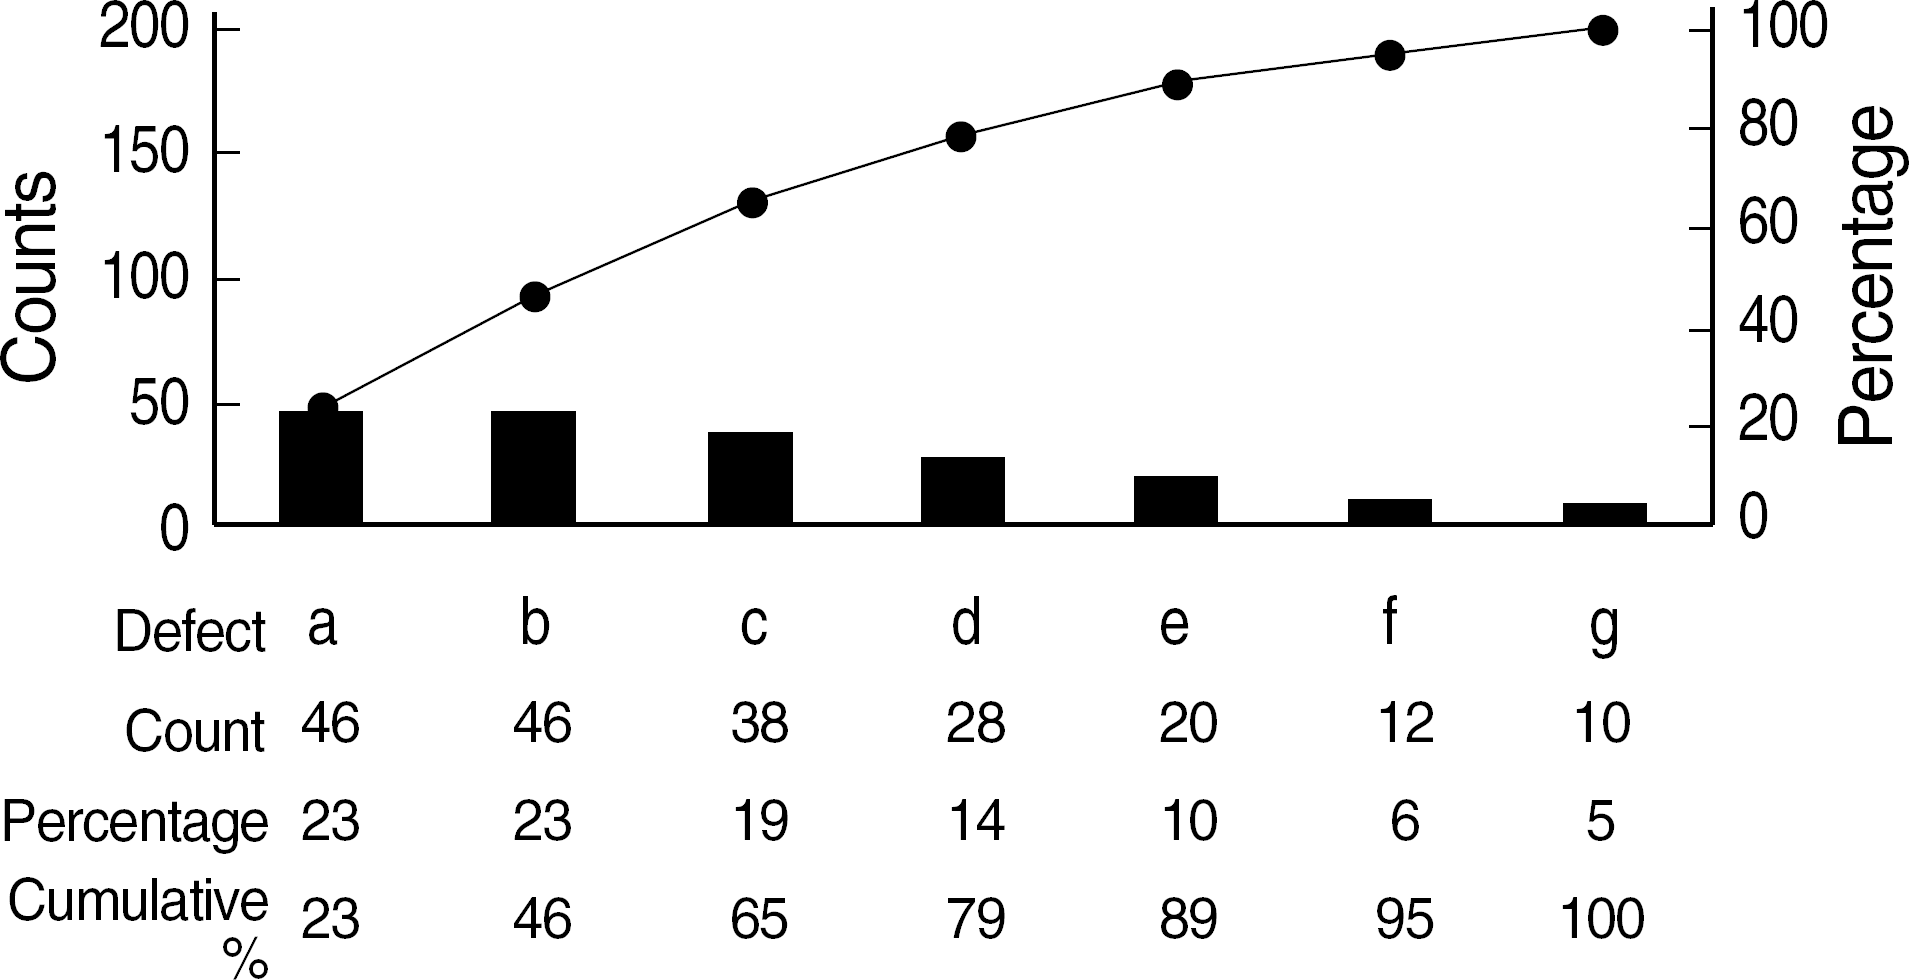
 | Fig. 1.Graphical display of analysis of defective details using Pare-to chart. Abbreviations: a, space arrangement of phlebotomy station; b, waiting times; c, location of phlebotomy station; d, laboratory information; e, solution on customer's inquiry; f, friendliness of the phlebotomist; g, skill of the phlebotomist; •, cumulative percentage. |
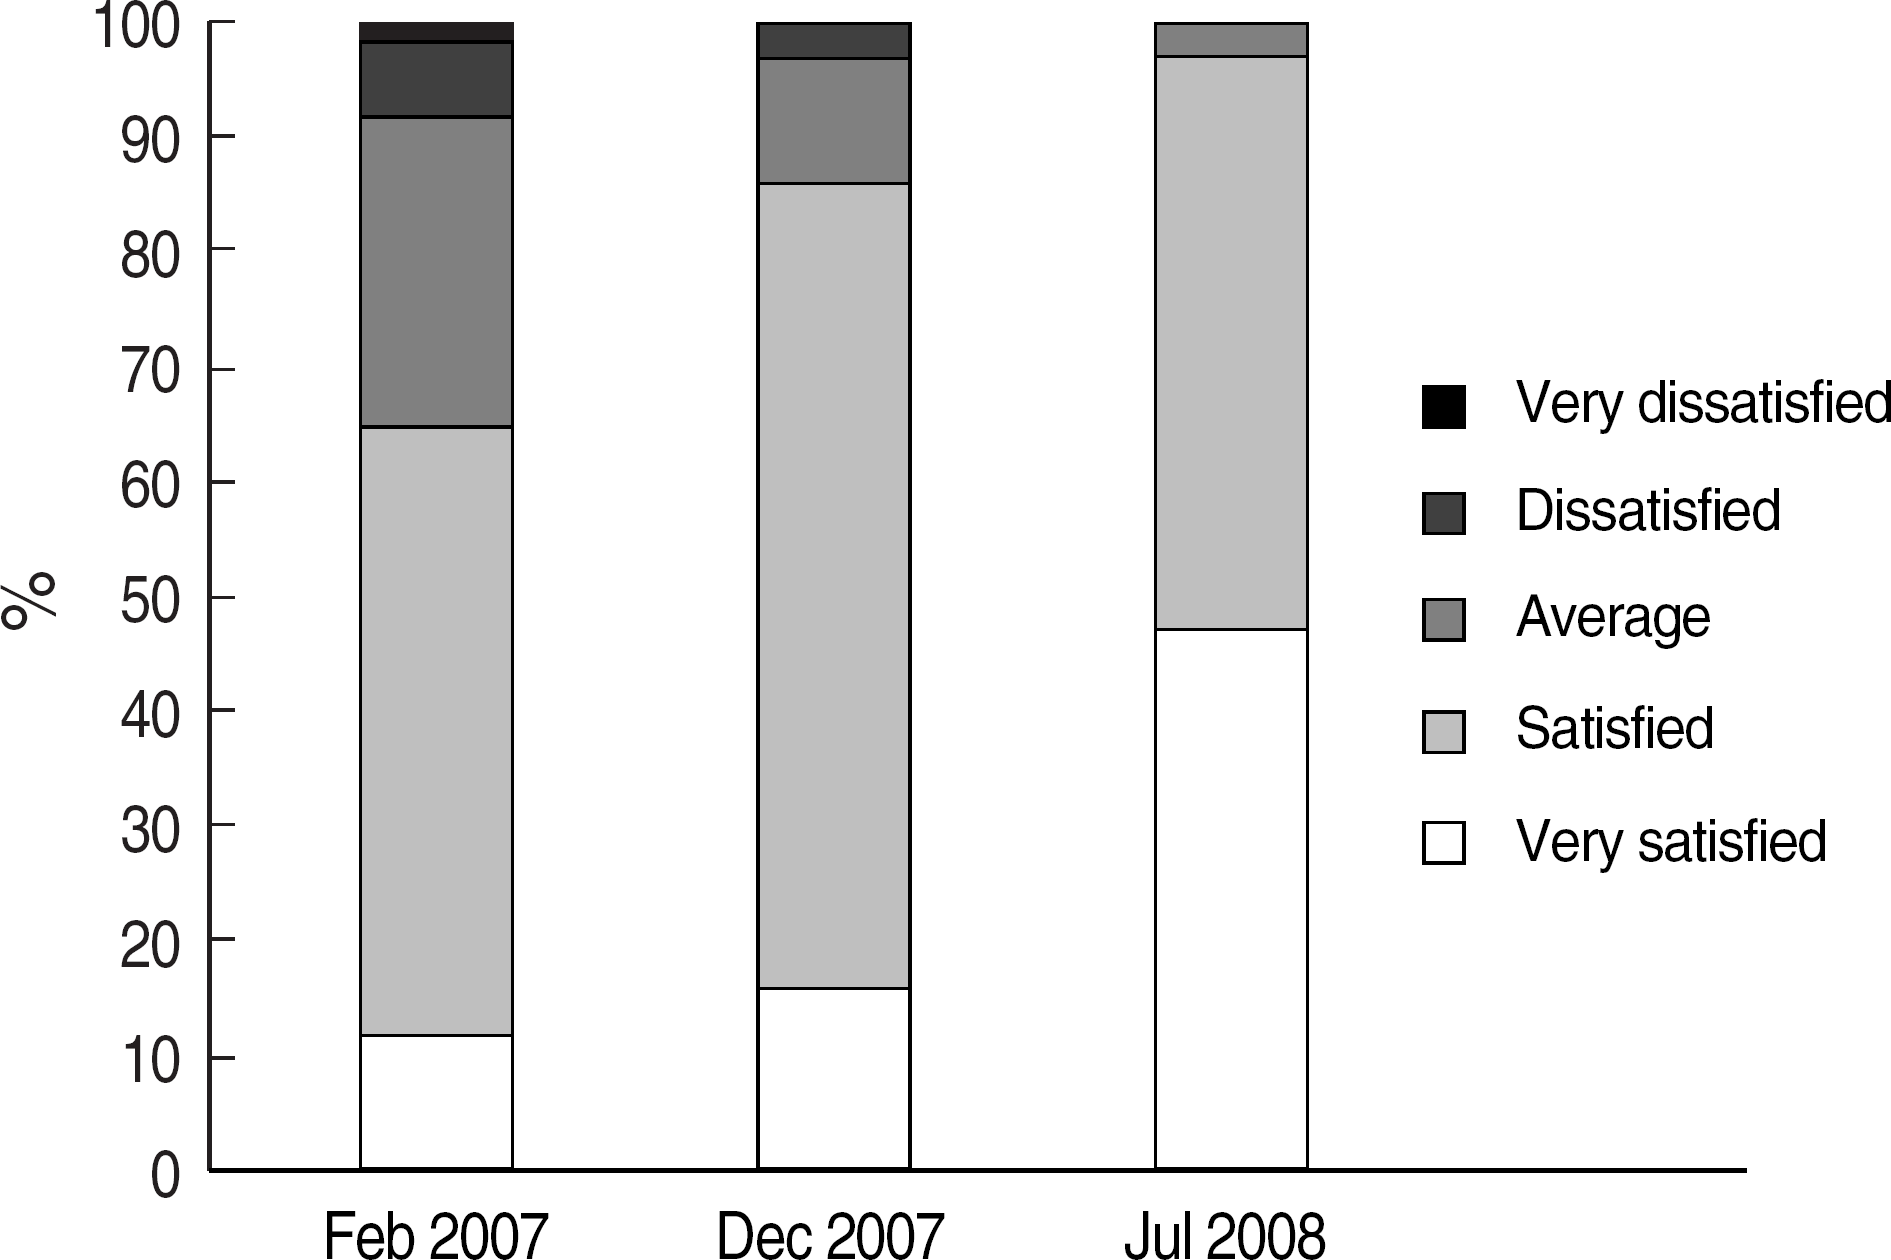
 | Fig. 2.Percentage distribution of patient satisfaction with time spent in the phlebotomy station. Abbreviations: a, space arrangement of phlebotomy station; b, waiting times; c, location of phlebotomy station; d, laboratory information; e, solution on customer's inquiry; f, friendliness of the phlebotomist; g, skill of the phlebotomist; •, cumulative percentage. |
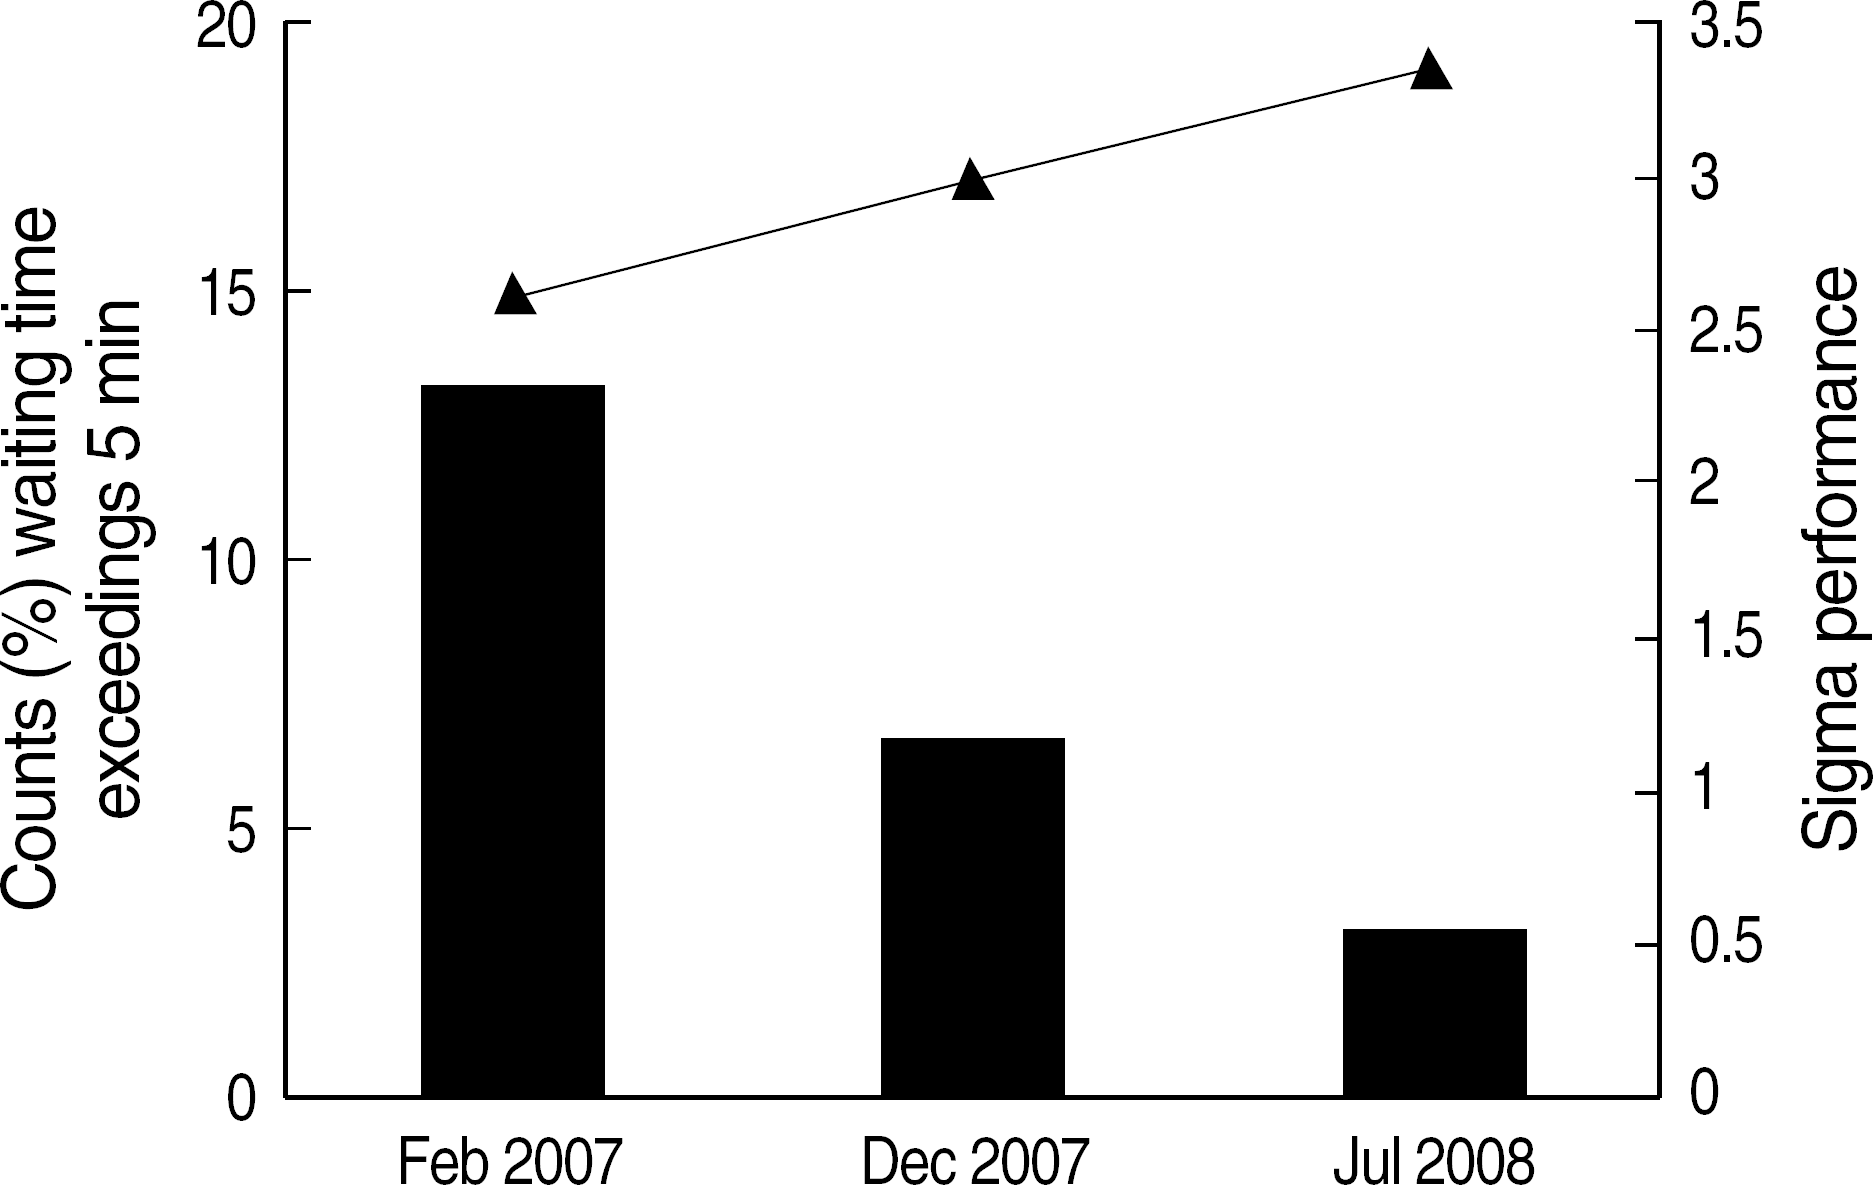
 | Fig. 3.Changes of sigma performance (▴) and waiting time (▪). Abbreviations: a, space arrangement of phlebotomy station; b, waiting times; c, location of phlebotomy station; d, laboratory information; e, solution on customer's inquiry; f, friendliness of the phlebotomist; g, skill of the phlebotomist; •, cumulative percentage. |
 | Fig. 4.Changes of average waiting time of the day (♦, February 2007; ▪, December 2007; ▴, July 2008). Abbreviations: a, space arrangement of phlebotomy station; b, waiting times; c, location of phlebotomy station; d, laboratory information; e, solution on customer's inquiry; f, friendliness of the phlebotomist; g, skill of the phlebotomist; •, cumulative percentage. |


 PDF
PDF ePub
ePub Citation
 Print
Print


 XML Download