Journal List > Korean J Lab Med > v.28(1) > 1011514

Ryu, Suh, and Cho: Protein Profile Changes in Platelet Concentrates According to Storage and Leukoreduction – Analysis Using Proteomics Technology

Abstract

Background

Knowing how the protein profile of platelet products changes with storage or leuko-reduction may give us greater insight into cell physiology and the cause of transfusion reactions other than cytokines and chemokines.

Methods

We filtered four packs of platelet concentrates (PC) within 24 hr of blood collection and after 120 hrs of storage. Four aliquots of each supernatant in PC were obtained: pre-storage+pre-filtration, pre-storage+post-filtration, post-storage+pre-filtration and post-storage+post-filtration. Routine chemistry tests and a two-dimensional electrophoresis (2-DE) were performed. The stained images were analyzed and the significant spots were identified using a peptide mass finger printing (PMF) with matrix assisted laser desorption/ionization-time of flight (MALDI-TOF) analysis after trypsin digestion.

Results

The protein spots increased with storage and decreased after filtration (P<0.05, pre-storage+post-filtration). The spot density of various proteins, including macrophage inflammatory protein-2 alpha, megakaryocyte colony stimulating factor and interleukin-22 changed with storage and leukoreduction.

Conclusions

The database of identified protein spots and their changes produced in this study is a useful basic tool for future studies on the mechanism of transfusion reactions. Further studies should validate the significance of each protein spot.

REFERENCES

1.Heddle NM. Febrile nonhemolytic transfusion reactions to platelets. Curr Opin Hematol. 1995. 2:478–83.
crossref
2.Seghatchian J., Krailadsiri P., Dilger P., Thorpe R., Wadhwa M. Cytokines as quality indicators of leucoreduced red cell concentrates. Transfus Apher Sci. 2002. 26:43–6.
crossref
3.Boehlen F., Clemetson KJ. Platelet chemokines and their receptors: what is their relevance to platelet storage and transfusion practice? Transfus Med. 2001. 11:403–17.
crossref
4.Muylle L., Peetermans ME. Effect of prestorage leukocyte removal on the cytokine levels in stored platelet concentrates. Vox Sang. 1994. 66:14–7.
crossref
5.Yazer MH., Podlosky L., Clarke G., Nahirniak SM. The effect of pre-storage WBC reduction on the rates of febrile nonhemolytic transfusion reactions to platelet concentrates and RBC. Transfusion. 2004. 44:10–5.
crossref
6.Paglino JC., Pomper GJ., Fisch GS., Champion MH., Snyder EL. Reduction of febrile but not allergic reactions to RBCs and platelets after conversion to universal prestorage leukoreduction. Transfusion. 2004. 44:16–24.
crossref
7.Kluter H., Bubel S., Kirchner H., Wilhelm D. Febrile and allergic transfusion reactions after the transfusion of white cell-poor platelet preparations. Transfusion. 1999. 39:1179–84.
8.Miletic VD., Popovic O. Complement activation in stored platelet concentrates. Transfusion. 1993. 33:150–4.
crossref
9.Silliman CC., Johnson CA., Clay KL., Thurman GW., Ambruso DR. Compounds biologically similar to platelet activating factor are present in stored blood components. Lipids. 1993. 28:415–8.
crossref
10.Heddle NM., Klama L., Singer J., Richards C., Fedak P., Walker I, et al. The role of the plasma from platelet concentrates in transfusion reactions. N Engl J Med. 1994. 331:625–8.
crossref
11.Muylle L., Joos M., Wouters E., De Bock R., Peetermans ME. Increased tumor necrosis factor alpha (TNF alpha), interleukin 1, and inter-leukin 6 (IL-6) levels in the plasma of stored platelet concentrates: relationship between TNF alpha and IL-6 levels and febrile transfusion reactions. Transfusion. 1993. 33:195–9.
crossref
12.Seghatchian J. The platelet storage lesion: A comparative analysis of six leukoreduction processes in terms of biocompatability, microve-siculation, retention of prions, and generation/removal of biological response modifiers. Transfus Apher Sci. 2005. 15:[Epub ahead of print].
13.Zhou M., Conrads TP., Veenstra TD. Proteomics approaches to bio-marker detection. Brief Funct Genomic Proteomic. 2005. 4:69–75.
14.Omenn GS., States DJ., Adamski M., Blackwell TW., Menon R., Hermjakob H, et al. Overview of the HUPO Plasma Proteome Project: results from the pilot phase with 35 collaborating laboratories and multiple analytical groups, generating a core dataset of 3020 proteins and a publicly-available database. Proteomics. 2005. 5:3226–45.
crossref
15.Reddy KS., Perrotta PL. Proteomics in transfusion medicine. Transfusion. 2004. 44:601–4.
crossref
16.Sarkodee-Adoo CB., Kendall JM., Sridhara R., Lee EJ., Schiffer CA. The relationship between the duration of platelet storage and the development of transfusion reactions. Transfusion. 1998. 38:229–35.
crossref
17.Omenn GS. The Human Proteome Organization Plasma Proteome Project pilot phase: reference specimens, technology platform comparisons, and standardized data submissions and analyses. Proteomics. 2004. 4:1235–40.
crossref
18.O'Neill EE., Brock CJ., von Kriegsheim AF., Pearce AC., Dwek RA., Watson SP, et al. Towards complete analysis of the platelet proteome. Proteomics. 2002. 2:288–305.
19.Garcia A., Zitzmann N., Watson SP. Analyzing the platelet proteome. Semin Thromb Hemost. 2004. 30:485–9.
crossref
20.Kakhniashvili DG., Bulla LA Jr., Goodman SR. The human erythrocyte proteome: analysis by ion trap mass spectrometry. Mol Cell Proteomics. 2004. 3:501–9.
21.Anderson NL., Polanski M., Pieper R., Gatlin T., Tirumalai RS., Conrads TP, et al. The human plasma proteome: a nonredundant list developed by combination of four separate sources. Mol Cell Proteomics. 2004. 3:311–26.
22.Anniss AM., Glenister KM., Killian JJ., Sparrow RL. Proteomic analysis of supernatants of stored red blood cell products. Transfusion. 2005. 45:1426–33.
crossref
23.Thiele T., Steil L., Gebhard S., Scharf C., Hammer E., Brigulla M, et al. Profiling of alterations in platelet proteins during storage of platelet concentrates. Transfusion. 2007. 47:1221–33.
crossref
24.Ledent E., Berlin G. Factors influencing white cell removal from red cell concentrates by filtration. Transfusion. 1996. 36:714–8.
crossref
25.Aye MT., Palmer DS., Giulivi A., Hashemi S. Effect of filtration of platelet concentrates on the accumulation of cytokines and platelet release factors. Transfusion. 1995. 35:117–24.
26.Wolpe SD., Sherry B., Juers D., Davatelis G., Yurt RW., Cerami A. Identification and characterization of macrophage inflammatory protein 2. Proc Natl Acad Sci USA. 1989. 86:612–6.
crossref
27.King AG., Johanson K., Frey CL., DeMarsh PL., White JR., McDevitt P, et al. Identification of unique truncated KC/GRO beta chemokines with potent hematopoietic and anti-infective activities. J Immunol. 2000. 164:3774–82.
28.Driscoll KE. TNFalpha and MIP-2: role in particle-induced inflammation and regulation by oxidative stress. Toxicol Lett. 2000. 112-113:177–83.
29.Fishley B., Alexander WS. Thrombopoietin signalling in physiology and disease. Growth Factors. 2004. 22:151–5.
crossref
30.Xie MH., Aggarwal S., Ho WH., Foster J., Zhang Z., Stinson J, et al. Interleukin (IL)-22, a novel human cytokine that signals through the interferon receptor-related proteins CRF2-4 and IL-22R. J Biol Chem. 2000. 275:31335–9.
crossref
31.Boniface K., Bernard FX., Garcia M., Gurney AL., Lecron JC., Morel F. IL-22 inhibits epidermal differentiation and induces proinflammatory gene expression and migration of human keratinocytes. J Immunol. 2005. 174:3695–702.
crossref

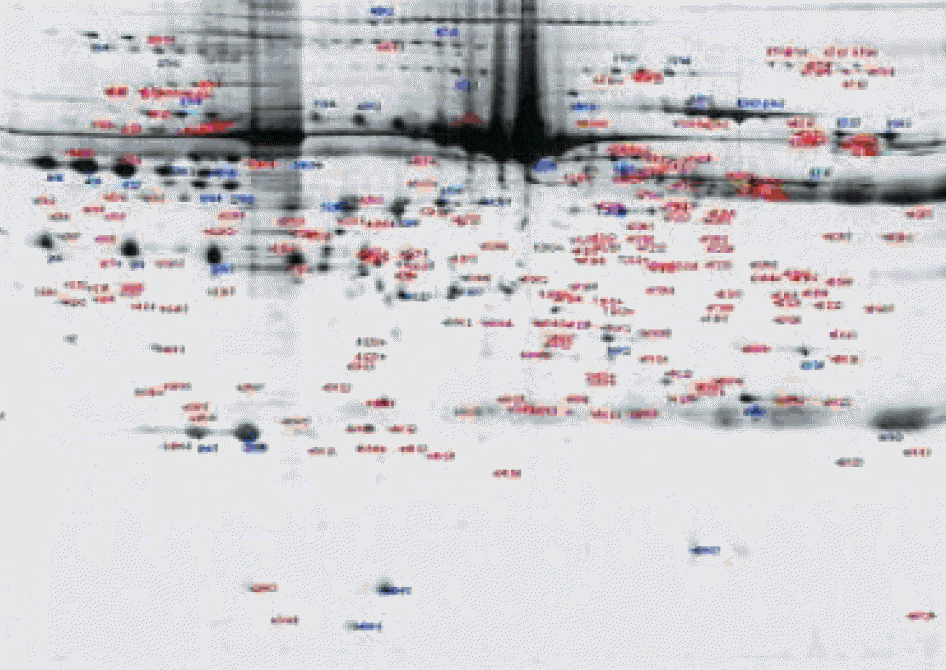
Fig. 1.
2-DE protein profiles of supernatant in pre-storage + pre-filtration PC. Aliquots were rehydrated in a 24-cm IPG strip covering the pH range of 3 to 10 and were subjected to isoelectric focusing. In the second dimension the protein were separated on a SDS-PAGE and stained with modified silver stain.
kjlm-28-53f1.tif
Table 1.
Chemistry test results of supernatant of platelet concentrate according to storage without leukoreduction
  Pre-storage (within 24 hr) Post-storage (after 120 hr) % change P value
Mean (Median) SD Mean (Median) SD
C-reactive protein 0.04 (0.04) 0.01 0.06 (0.06) 0.03 43.8 0.102
Creatine kinase 142.0 (142.0) 20.6 196.3 (193.0) 31.0 38.2 0.068
Lactate dehydrogenase 329.3 (333.5) 25.8 434.3 (423.5) 103.5 31.9 0.068
HDL-cholesterol 38.5 (38.5) 3.9 44.8 (44.5) 6.1 16.3 0.066
Total bilirubin 1.3 (1.2) 0.2 1.4 (1.3) 0.5 16.3 0.102
BUN 13.2 (13.0) 2.5 13.8 (12.9) 3.7 4.6 0.593
Potassium 3.5 (3.5) 0.3 3.6 (3.6) 0.2 4.3 0.063
Calcium 7.6 (7.5) 0.4 7.9 (7.8) 0.3 4.0 0.063
Phosphorus 11.9 (11.9) 0.3 12.3 (12.3) 0.4 3.8 0.066
Total protein 6.2 (6.2) 0.1 6.4 (6.4) 0.1 2.8 0.066
T-cholesterol 155.8 (150.0) 33.7 160.0 (154.0) 34.8 2.7 0.066
Albumin 3.6 (3.7) 0.2 3.7 (3.7) 0.2 1.4 0.157
Chloride 80.8 (80.0) 4.1 81.8 (81.0) 4.1 1.2 0.0461
Sodium 171.5 (173.0) 5.2 173.3 (175.0) 5.8 1.0 0.059
Uric acid 5.8 (5.9) 0.6 5.9 (5.9) 0.6 0.9 0.157
Creatinine 1.1 (1.1) 0.1 1.1 (1.1) 0.0 0.0 1.000
LDL-cholesterol 100.3 (93.5) 27.8 96.5 (91.0) 32.2 -3.7 0.144
Amylase 46.0 (46.0) 4.4 44.0 (44.0) 4.2 -4.3 0.066
Triglyceride 141.3 (140.0) 7.3 133.5 (134.0) 2.6 -5.5 0.068
Direct bilirubin 0.2 (0.2) 0.02 0.2 (0.2) 0.02 -7.7 0.059
Glucose 298.0 (348.5) 153.7 209.8 (246.0) 117.6 -29.6 0.068

P values are calculated by Wilcoxon's signed-rank test;

statistically significant.

Table 2.
Chemistry test results of supernatant in pre-storage platelet concentrate before and after leukoreduction
  Pre-filtration Mean±SD Post-filtration Mean±SD % change P value
Direct bilirubin 0.16±0.02 0.37±0.04 126.2 0.068
Total bilirubin 1.3±0.2 1.5±0.2 20.4 0.059
Phosphorus 11.9±0.3 13.1±0.9 10.3 0.068
HDL-cholesterol 38.5±3.9 44.8±6.1 9.1 0.144
T-cholesterol 155.8±33.7 169.3±37.1 8.7 0.066
Triglyceride 141.3±7.3 151.8±10.5 7.4 0.068
Albumin 3.6±0.2 3.82±0.2 5.5 0.066
Total protein 6.2±0.1 6.5±0.1 4.8 0.066
BUN 13.2±2.5 13.5±2.4 2.3 0.066
Glucose 298±153 302±155 1.3 0.066
Chloride 80.8±4.1 81.8±4.1 1.2 0.046
Lactate dehydrogenase 329.3±25.8 331.8±33.4 0.8 0.715
Uric acid 5.8±0.6 5.8±0.6 0.0 1.000
Creatinine 1.1±0.1 1.1±0.1 0.0 1.000
Amylase 46±4.4 45.8±5.7 -0.5 0.705
LDL-cholesterol 100.3±27.8 96.8±33.3 -3.5 0.465
Calcium 7.6±0.4 7.1±0.5 -5.6 0.066
C-reactive protein 0.04±0.01 0.38±0.01 -6.3 0.564
Sodium 171.5±5.2 160±2.4 -6.7 0.068
Potassium 3.5±0.3 3.2±0.3 -7.9 0.066
Creatine kinase 142±20.6 126.5±29.8 -10.9 0.068

P values are calculated by Wilcoxon's signed-rank test.

Table 3.
Chemistry test results of supernatant in post-storage platelet concentrate before and after leukoreduction
  Pre-filtration Mean±SD Post-filtration Mean±SD % change P value
Direct bilirubin 0.15±0.02 0.36±0.04 138.3 0.068
Total bilirubin 1.4±0.5 0.7±0.4 15.8 0.066
Phosphorus 12.3±0.4 13.4±0.4 8.9 0.066
HDL-cholesterol 44.8±6.1 47.3±6.1 5.6 0.068
T-cholesterol 160±34.8 172.5±36.7 7.8 0.068
Triglyceride 133.5±2.7 140.5±6.2 5.2 0.068
Albumin 3.7±0.2 3.9±0.2 5.4 0.066
Total protein 6.4±0.1 6.7±0.1 5.2 0.059
BUN 13.6±3.7 12.7±3.7 -7.8 0.581
Glucose 209.8±117.6 214±119.1 2.0 0.068
Chloride 81.8±4.1 83±4.5 1.5 0.059
Lactate dehydrogenase 434.3±103.5 373.8±102.1 -13.9 0.068
Uric acid 5.8±0.6 5.8±0.6 0.0 1.000
Creatinine 1.1±0 1±0.5 -6.8 0.083
Amylase 44±4.2 45±5.4 2.3 0.414
LDL-cholesterol 96.5±32.2 101±39.1 4.7 0.465
Calcium 7.9±0.3 7.6±0.4 -2.9 0.066
C-reactive protein 0.06±0.02 0.05±0.02 -6.3 0.285
Sodium 173.3±5.7 163±2.9 -5.9 0.068
Potassium 3.6±0.2 3.4±0.2 -6.2 0.059
Creatine kinase 196.3±31 175.3±29.6 -10.7 0.068

P values are calculated by Wilcoxon's signed-rank test.

Table 4.
Mean difference in chemistry test results of supernatant between pre-storage and post-storage leukoreduced platelet concentrate
  Mean difference±SD P value
Pre-storage (within 24 hrs) changes from pre-filtration to post-filtration Post-storage (after 120 hrs) changes from pre-filtration to post-filtration
Direct bilirubin 0.2±0.04 0.2±0.02 0.715
Total bilirubin 0.3±0.1 0.2±0.1 0.450
Phosphorus 1.2±0.8 1.1±0.5 0.461
HDL-cholesterol 3.5±3.1 2.5±1.3 0.713
T-cholesterol 13.5±3.8 12.5±2.1 0.414
Triglyceride 10.5±5.3 7.0±4.1 0.066
Albumin 0.2±0.1 0.2±0.1 0.157
Total protein 0.3±0.1 0.3±0.1 1.000
BUN 0.3±0.4 -1.1±2.2 0.144
Glucose 4.0±1.4 4.3±2.6 0.785
Chloride 1.0±0.0 1.3±0.5 0.313
Lactate dehydrogenase 2.5±13.3 -60.5±37.5 0.068
Uric acid 0.0±0.0 0.0±0.1 1.000
Creatinine 0.0±0.0 -0.1±0.1 0.083
Amylase -0.3±1.5 1.0±2.2 0.102
LDL-cholesterol -3.5±8.9 4.5±8.1 0.144
Calcium -0.4±0.1 -0.2±0.1 0.046′
C-reactive protein -0.003±0.01 -0.01±0.02 0.357
Sodium -11.5±3.9 -10.3±3.6 0.102
Potassium -0.3±0.1 -0.2±0.1 0.357
Creatine kinase -15.5±22.8 -21.0±5.1 0.715

Amount of changes are calculated by subtracting pre-filtration from post-filtration;

P values are calculated by Wilcoxon's signed-rank test;

statistically significant.

Table 5.
The number of protein spots in supernatant of platelet concentrate
  Pre-filtration Post-filtration P value
Pre-storage (within 24 hr) 973.25±26.9 928.25±22.6 0.048
Post-storage (after 120 hr) 998.50±32.6 992.50±13.4 0.254

P values are calculated by Kruskal-Wallis’ test;

statistically significant.

Table 6.
Percent change of identified protein spots in supernatant of platelet concentrate according to storage
No ID MW (kDa) pI P value Cov (%) Pre-storage (within 24 hr) Post-storage (after 120 hr) % change
Mean %Vol SD Mean %Vol SD
603 GUC1C 22 5.5 1.1E-10 54 6558.0 1103.3 11431.5 3616.5 74.3
717 MPCP 35 9.3 2.5E-06 32 23517.6 1959.5 38593.3 5785.2 64.1
775 TPO 37 9.5 1.6E-08 32 3726.4 2527.0 5792.3 3945.5 55.4
807 RIR2 45 5.3 3.7E-11 35 4838.9 156.1 7245.5 296.4 49.7
604 SGCD 32 9.2 8.1E-08 31 80153.5 33116.2 115976.3 5148.2 44.7
917 ALBU 66 5.7 3.9E-11 25 55883.2 50004.3 77771.1 2293.3 39.2
876 KAD4 25 8.5 4.9E-09 40 64371.3 36928.7 81268.9 9246.7 26.3
854 IL22 17 7.1 7.8E-08 37 53196.2 5687.8 66157.5 6719.3 24.4
734 HPT 27 6.3 1.4E-15 53 93712.9 13763.6 115819.1 18839.2 23.6
730 ALBU 66 5.7 2.3E-10 27 91908.9 16376.5 109659.6 24751.2 19.3
702 ATP4B 33 7.0 1.2E-07 27 3022.4 464.6 3337.2 2272.5 10.4
692 ALBU 66 5.7 7.0E-19 44 173209.2 28424.6 175899.9 63775.0 1.6
906 KAC 12 5.6 6.3E-08 58 176437.8 41050.0 167253.4 43672.7 -5.2
636 XRCC4 38 4.9 7.4E-07 34 36734.9 7477.0 33119.6 7655.5 -9.8
810 CECR2 58 5.5 2.7E-06 22 14525.9 2197.4 12746.9 1943.9 -12.2
615 MED31 16 8.7 8.5E-09 58 50796.2 13535.2 42855.1 11780.8 -15.6
958 APOA1 28 5.3 9.8E-15 54 43274.5 19932.5 33862.4 18009.9 -21.7
932 MIP2A 8 9.8 1.2E-07 67 109936.3 40473.4 76024.2 63924.8 -30.8
743 OASL 59 8.0 4.8E-07 22 45294.5 7854.7 30611.9 5459.7 -32.4

P value is probability of a random match between the query and the entry in the data base (P<1E-05);

Sequence coverage.

Protein ID description: 603, Splice isoform 2 of O95843; 717, Phosphate carrier protein; 775, Splice isoform 2 of P40225; 807, Ribonucleoside-diphosphate reductase M2; 604, Delta-sarcoglycan (SG-delta); 917, Serum albumin; 876, Adenylate kinase isoenzyme 4; 854, Interleukin 22; 734, Haptoglobin beta chain; 702, Potassium-transporting ATPase beta chain; 730, 692, albumin; 906, Ig kappa chain C region; 636, Splice isoform 2 of Q13426; 810, Splice isoform B of Q9BXF3; 615, Mediator of RNA polymerase II transcription; 958, Apolipoprotein A-I (1-242); 932, Macrophage inflammatory protein 2-alpha; 743, 59 kDa 2′-5′-oligoadenylate synthetase-1.

Abbreviations: MW, molecular weight; pI, isoelectric point; Cov, coverage.

Table 7.
Percent change of identified protein spots in pre-storage platelet concentrate after leukoreduction
No ID MW (kDa) pI P value Cov (%) Pre-filtration Post-filtration % change
Mean %Vol SD Mean %Vol SD
775 TPO 37 9.5 1.60E-08 24 3726.4 2526.9 8968.4 241.5 140.7
702 ATP4B 33 7 1.20E-07 19 3022.4 464.6 6845.6 2474.8 126.5
960 APOA1 28 5.3 9.80E-15 31 23667.6 16189.8 53333.7 7567.8 125.3
693 TRAIP 58 8.8 2.00E-06 15 5549.2 1341.5 10428.9 2133.9 87.9
807 RIR2 45 5.3 3.70E-11 27 4822.9 111.5 8206.9 4125.8 70.2
810 CECR2 58 5.5 2.70E-06 14 14535.9 2197.4 24519.7 4417.3 68.8
717 MPCP 35 9.3 2.50E-06 24 23517.6 1959.5 36732.5 5168.4 56.2
959 APOA1 28 5.3 9.80E-15 34 31290.5 2645.2 46830.7 4785.9 49.7
709 BOK 23 9.3 2.00E-07 32 18332.8 706.3 11526.9 930.1 38.3
958 APOA1 28 5.3 9.80E-15 46 43274.5 19932.5 59508.4 27814.4 37.5
854 IL22 17 7.1 7.80E-08 29 5196.2 5687.8 69461.2 15175.9 30.6
604 SGCD 32 9.2 8.10E-08 23 80153.5 33116.2 101515.8 40831.7 26.7
735 TPM2 29 4.6 3.10E-08 27 50393.1 5854 63443.3 13110.9 25.9
743 OASL 59 8 4.80E-07 14 45294.5 7854.7 55838.7 10263.7 23.3
703 ACA 16 4.7 1.00E-07 21 81655.6 12815.5 97793.5 15424.5 19.8
876 KAD4 25 8.5 4.90E-09 32 40627.6 33023.4 46999.5 30960.1 15.7
603 GUC1C 22 5.5 1.10E-10 46 6558 1103.3 5698.7 1036.2 -13.1
906 KAC 12 5.6 6.30E-08 50 176437.8 41050.1 134479.9 43106.7 -23.8
615 MED31 16 8.7 8.50E-09 50 50796.2 13535.2 36999.8 5236.9 -27.2
601 NB4M 15 10 1.00E-07 36 115464.8 54555.2 69748.8 4822.5 -39.6

P value is probability of a random match between the query and the entry in the data base (P<1E-05);

Sequence coverage.

Protein ID description: 702, Potassium-transporting ATPase beta chain; 775, Splice isoform 2 of P40225; 960, Apolipoprotein A-I (1-242); 807, Ribonucleoside-diphosphate reductase M2; 693, TRAF-interacting protein; 876, Adenylate kinase isoenzyme 4, mitochondria; 810, Splice isoform B of Q9BXF3; 735, Splice isoform 3 of P07951; 959, Apolipoprotein A-I (1-242); 717, Phosphate carrier protein; 703, ACA protein (Fragments); 854, Interleukin 22; 743, 59 kDa 2′-5′-oligoadenylate synthetase-l; 709, Bcl-2-related ovarian killer protein; 958, Apolipoprotein A-I (1-242); 604, Delta-sarcoglycan (SG-delta); 603, Splice isoform 2 of O95843; 906, Ig kappa chain C region; 615, Mediator of RNA polymerase II transcript; 601, NADH-ubiquinone oxidoreductase B14 subunit.

Abbreviations: See Table 6.

Table 8.
Percent change of identified protein spots in post-storage platelet concentrate after leukoreduction
No ID MW (kDa) pI P value Cov (%) Pre-filtration Post-filtration % change
Mean %Vol SD Mean %Vol SD
702 ATP4B 33 7.0 1.2E-07 19 3337.2 2272.4 10135.7 2228.1 203.7
775 TPO 37 9.5 1.6E-08 24 5792.2 3945.5 14423.8 2369.2 149.0
807 RIR2 45 5.3 3.7E-11 27 7245.5 296.4 12973.1 4996.7 79.1
703 ACA 16 4.7 1.0E-07 21 75472.8 14090.1 126464.7 28806.7 67.6
960 APOA1 28 5.3 9.8E-15 31 344096.5 23117.8 56866.6 5090.9 66.8
735 TPM2 29 4.6 3.1E-08 27 42874.9 8864.0 71425.3 16230.8 66.6
876 KAD4 25 8.5 4.9E-09 32 81268.9 39246.7 120201.9 58800.8 47.9
693 TRAIP 58 8.8 2.0E-06 15 5529.7 1232.6 7831.2 2025.5 41.6
810 CECR2 58 5.5 2.7E-06 14 12746.9 1943.9 18044.7 3010.8 41.6
709 BOK 23 9.3 2.0E-07 32 10743.1 1414.1 15101.5 3995.8 40.6
743 OASL 59 8.0 4.8E-07 14 30611.9 5459.7 39369.3 5158.4 28.6
854 IL22 17 7.1 7.8E-08 29 66157.5 6719.3 83291.5 4892.2 25.9
717 MPCP 35 9.3 2.5E-06 24 38593.3 5785.2 48441.4 3408.8 25.5
958 APOA1 28 5.3 9.8E-15 46 33862.7 18009.9 37881.9 20331.5 11.9
604 SGCD 32 9.2 8.1E-08 23 115976.4 55148.2 126549.1 56424.3 9.1
601 NB4M 15 10.0 1.0E-07 36 83186.7 32144.0 72022.4 17603.8 -13.4
615 MED31 16 8.7 8.5E-09 50 42855.1 11780.8 34260.5 6451.7 -20.1
603 GUC1C 22 5.5 1.1E-10 46 11431.5 3616.5 8720.0 1941.2 -23.7
906 KAC 12 5.6 6.3E-08 50 167253.4 43672.7 86629.4 27899.8 -48.2

P value is probability of a random match between the query and the entry in the data base (P<1E-05);

Sequence coverage.

Protein ID description and abbreviations: See Table 7.

Table 9.
Increased proteins of supernatant in platelet concentrate according to storage
Name of protein Comment Predominant source
Guanylyl cyclase activating factor Calcium regulatory protein in rod photoreceptor Eye
Phosphate carrier protein Transport phosphate Membrane protein
Megakaryocyte colony stimulating factor Major physiologic regulator of platelet Platelet
Ribonucleoside-diphosphate reductase M2 DNA synthesis Nucleus
Delta-sarcoglycan (SG-delta) Component of sarcoglycan complex Muscle
Albumin(including fragment) Regulate osmotic pressure Plasma
Potassium-transporting ATPase β chain Transport K+, H+ Membrane protein
Haptoglobin precursor: α and β chain Acute phase, scavenge protein Plasma
Interleukin-22 Inflammatory cytokine Lymphocytes
Adenylate kinase isoenzyme 4, mitochondrial Catalytic activity Mitochondrial matrix
Table 10.
Decreased proteins of supernatant in platelet concentrate according to storage
Name of protein Comment Predominant source
Ig Kappa chain C region Constant region of immunoglobulin Plasma
DNA-repair protein XRCC4 DNA repair Nucleus
Cat eye syndrome critical region protein 2 RNA or single stranded DNA binding Nucleus
Mediator of RNA polymerase II transcription subunit 31 Regulate transcription Nucleus
Apolipoprotein A-I Lipid transporting/binding protein Plasma
Macrophage inflammatory protein 2-alpha (Precursor) Hematoregulatory chemokine WBC
59 kDa 2′-5′-oligoadenylate synthetase-like protein Interact with ligand binding domain of thyroid receptor Most tissue (esp. WBC etc)
TOOLS
Similar articles