Abstract
Background
Atrophic gastritis is a well known risk factor for gastric adenocarcinoma. Its confirmatory diagnosis requires histology via endoscopy, which is an invasive method; therefore, periodic follow up evaluation as a screening method is difficult to perform. We evaluated the clinical utility of serum pepsinogens (PG) as a biomarker for screening of atrophic gastritis.
Methods
The study population consisted of 130 selected dyspeptic patients (M:F=52:78; age, 16-105 yrs; mean age, 50.8 yrs) who had undergone a diagnostic endoscopy. The serum pepsinogen test was performed by a latex turbidimetric immunoassay method (HBI, Korea) using Toshiba-200FR automatic analyzer. The PGI, II level and PGI:PGII ratio of non-atrophic gastritis group were compared with those of atrophic gastritis group, and a correlation with Helicobacter pylori infection was examined. Cut-off points for screening of atrophic gastritis were determined.
Results
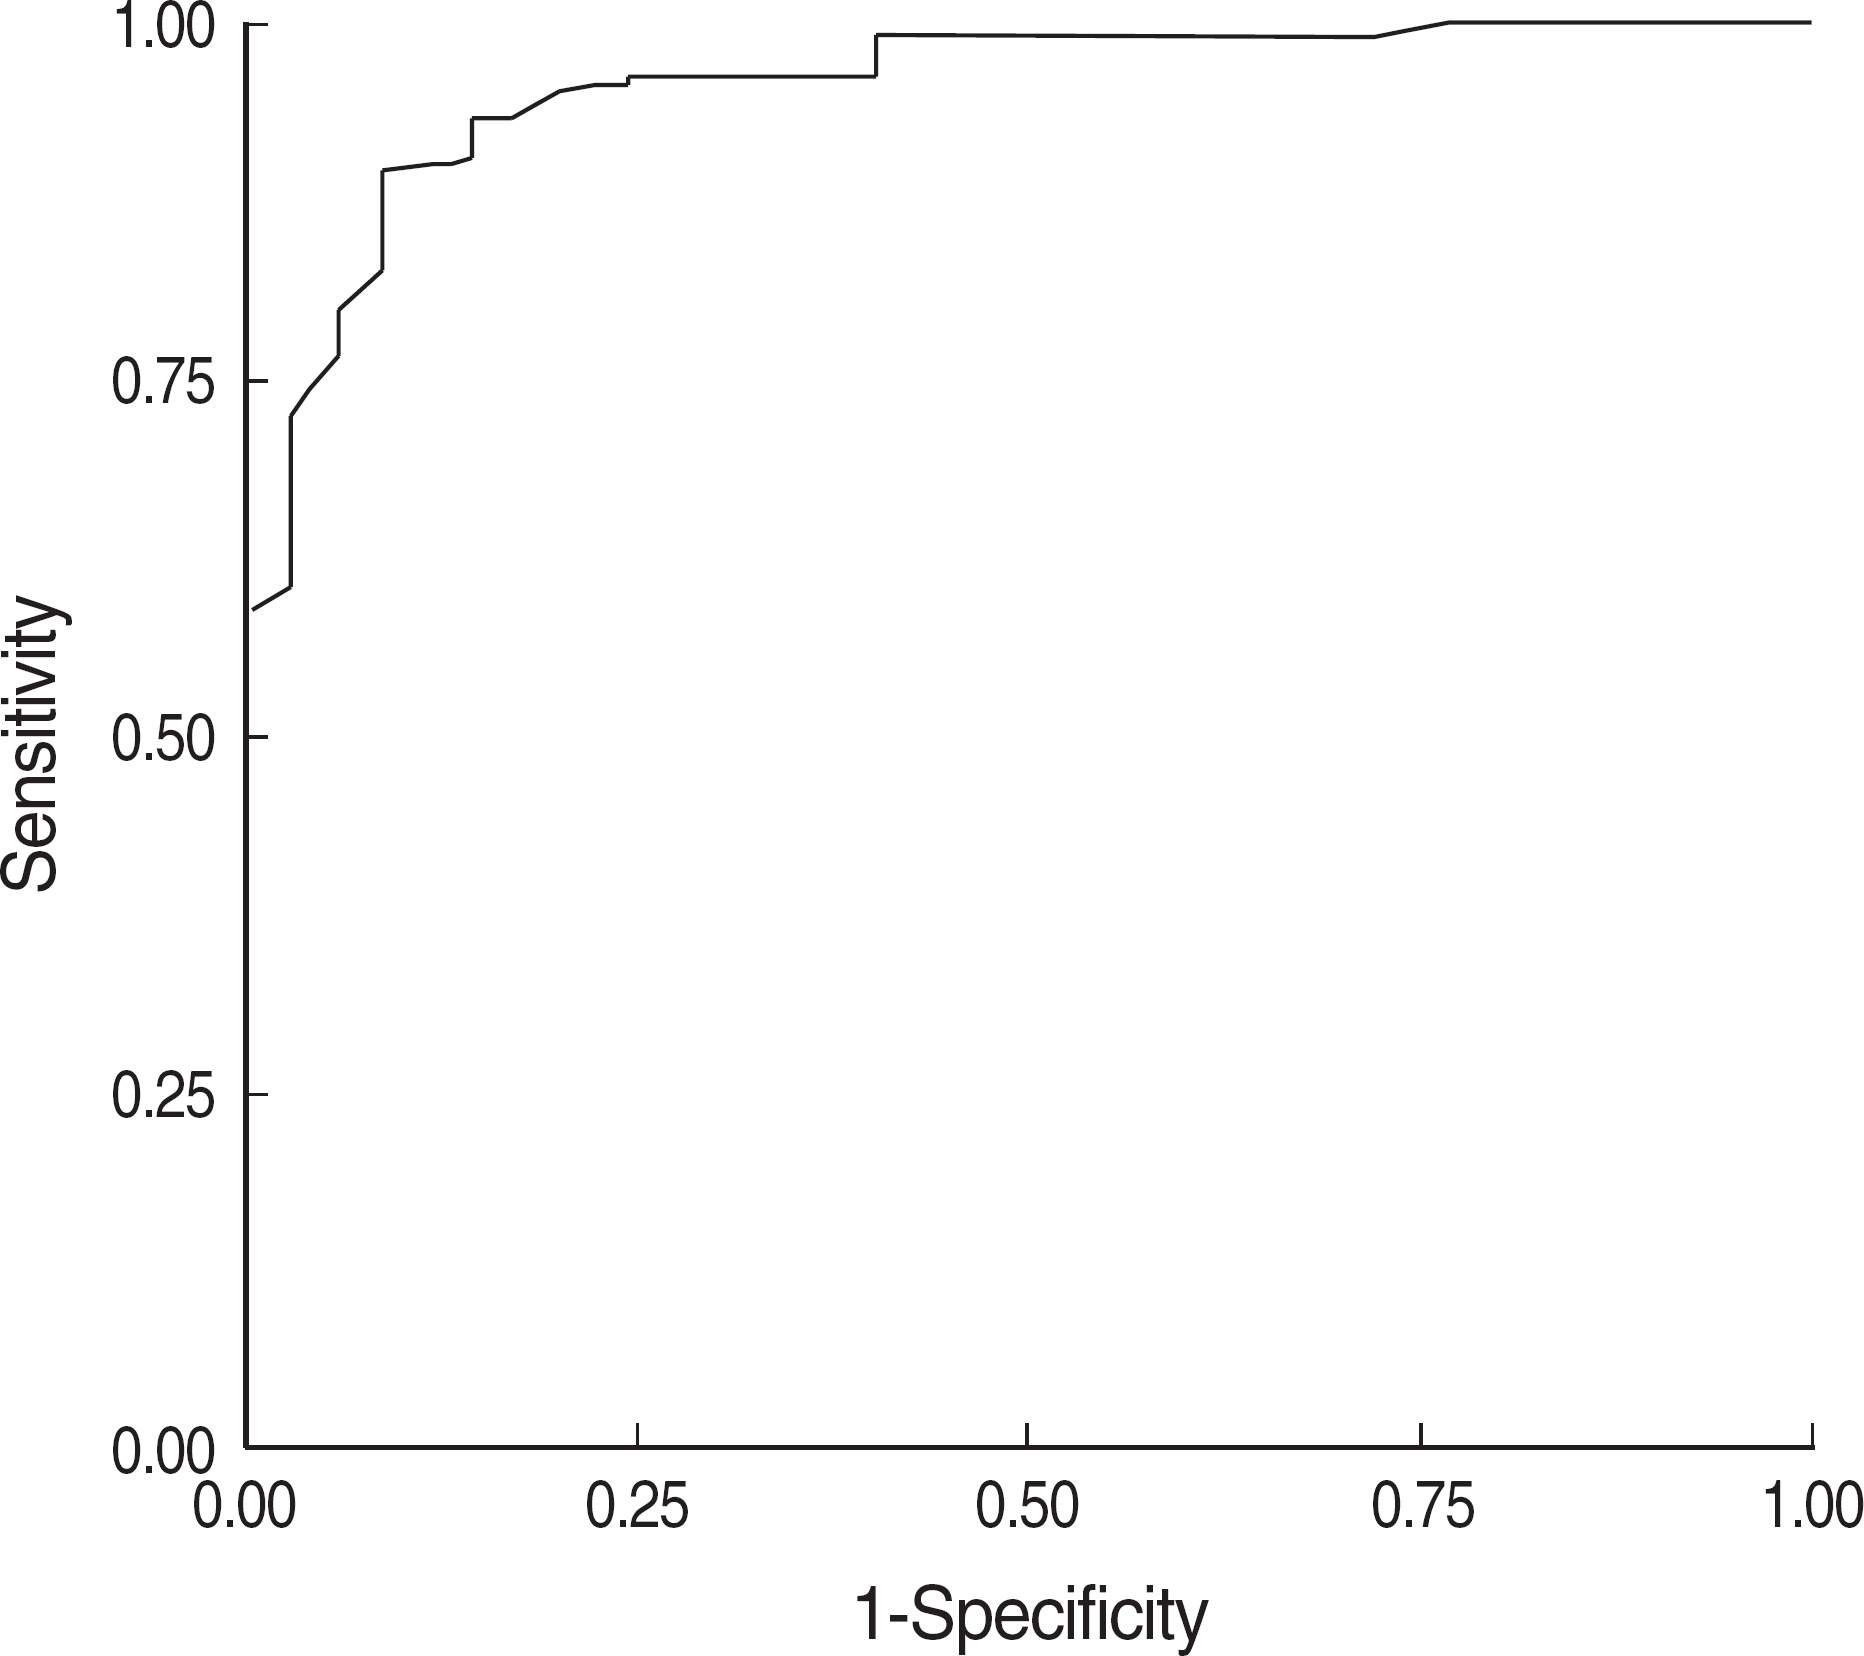
The mean serum concentration of PGI showed a decline from normal (60.7 ng/mL), non-atrophic gastritis (54.2 ng/mL), and atrophic gastritis (51.8 ng/mL) to gastric adenocarcinoma (32.6 ng/mL). The mean ratio of PGI:PGII was lower in atrophic gastritis (3.2) compared to non-atrophic gastritis (4.7) (P=0.021). In patients with H. pylori infection, the mean serum PGII level was higher and the PGI:PGII ratio was lower than those in patients without H. pylori infection, and the differences were statistically significant. For screening of atrophic gastritis, the best cut-off point of PGI:PGII ratio was 4, with a sensitivity of 82.6% and specificity of 91.7%.
Conclusions
The serum pepsinogen test is a useful biomarker for screening of atrophic gastritis, a well-known precancerous lesion of gastric adenocarcinoma. Measuring both pepsinogen I and II concentrations simultaneously to obtain pepsinogen I/II ratio provides a clinically useful information for the detection of atrophic gastritis.
REFERENCES
1.Shin HR., Jung KW., Won YJ., Park JG. 2002 annual report of Korea central cancer resistry: based on registered data from 139 hospitals. Cancer Res Treat. 2004. 36:103–14.
2.Sipponen P., Kekki M., Haapakoski J., Ihamaki T., Siurala M. Gastric cancer risk in chronic atrophic gastritis: statistical calculations of cross-sectional data. Int J Cancer. 1985. 35:173–7.
3.Di Gregorio C., Morandi P., Fante R., De Gaetani C. Gastric dysplasia. A follow-up study. Am J Gastroenterol. 1993. 88:1714–9.
4.Samloff IM. Cellular localization of group I pepsinogens in human gastric mucosa by immunofluorescence. Gastroenterology. 1971. 61:185–8.

5.Samloff IM., Liebman WM. Cellular localization of the group II pepsinogens in human stomach and duodenum by immunofluorescence. Gastroenterology. 1973. 65:36–42.

6.Korstanje A., den Hartog G., Biemond I., Lamers CB. The serological gastric biopsy: a non-endoscopical diagnostic approach in management of the dyspeptic patient: significance for primary care based on a survey of the literature. Scand J Gastroenterol Suppl. 2002. 236(S):S22–6.

7.Mukoubayashi C., Yanaoka K., Ohata H., Arii K., Tamai H., Oka M, et al. Serum pepsinogen and gastric cancer screening. Intern Med. 2007. 46:261–6.

8.Sipponen P., Harkonen M., Alanko A., Suovaniemi O. Diagnosis of atrophic gastritis from a serum sample. Clin Lab. 2002. 28:505–15.
9.Lorente S., Doiz O., Trinidad Serrano M., Castillo J., Lanas A. Helicobacter pylori stimulates pepsinogen secretion from isolated human peptic cells. Gut. 2002. 50:13–8.

10.Fukuda H., Saito D., Hayashi S., Hisai H., Ono H., Yoshida S, et al. Helicobacter pylori infection, serum pepsinogen level and gastric cancer: a case-control study in Japan. Jpn J Caner Res. 1995. 86:64–71.
11.Miki K., Urita Y. Using serum pepsinogens wisely in a clinical practice. J Dig Dis. 2007. 8:8–14.

12.Paik CN., Chung IS., Nam KW., Kwon JH., Chang JH., Suh JP, et al. Relationship between pepsinogen I/II ratio and age or upper gastrointestinal diseases in Helicobacter pylori-positive and negative subjects. Korean J Gastroenterol. 2007. 50:84–91. (백창렬, 정인식, 남관우, 권정현, 장재혁, 서정필 등. Helicobacter pylori 양성, 음성 환자에서각종상부위장관질환과나이에따른펩시노겐 I/II 비. 대한소화기학회지 2007;50: 84-91.).
13.Broutet N., Plebani M., Sakarovitch C., Sipponen P., Megraud F. Eurohepygast Study Group. Pepsinogen A, pepsinogen C, and gastrin as markers of atrophic chronic gastritis in European dyspeptics. Br J Cancer. 2003. 88:1239–47.

14.Miki K., Ichinose M., Shimizu A., Huang SC., Oka H., Furihata G, et al. Serum pepsinogens as a screening test of extensive chronic gastritis. Gastroenterol Jpn. 1987. 22:133–41.

15.Kitahara F., Kobayashi K., Sato T., Kojima Y., Araki T., Fujino AM. Accuracy of screening for gastric cancer. J Gastroenterol. 1995. 30:452–60.
16.Aoki K., Misumi J., Kimura T., Zhao W., Xie T. Evaluation of cutoff levels for screening of gastric cancer using serum pepsinogens and distributions of levels of serum pepsinogen I, II and of PG I/PG II ratios in a gastric cancer case-control study. J Epidemiol. 1997. 7:143–51.
Fig. 1.
Receiver operating curve (ROC) for pepsinogen I/II ratio for screening of atrophic gastritis (cut-off value: pepsinogen I/II ratio <4, sensitivity: 82.6%, specificity: 91.7%).

Table 1.
Characteristics of the study population
Table 2.
Serum concentrations of pepsinogen I, II and pepsinogen I/II ratios in subjects with normal gastric mucosa (NM), non-atrophic gastritis (NAG), atrophic gastritis (AG) and gastric adenocarcinoma (CA) (mean±SD)
| NM (n=16) | NAG (n=51) | AG (n=59) | CA (n=4) | |
|---|---|---|---|---|
| PGI (ng/mL) | 60.7±41.3 | 54.2±33.2 | 51.8±33.2 | 32.6±40.0 |
| PGII (ng/mL) | 9.3±6.2 | 13.5±7.9 | 16.2±7.9 | 14.8±10.0 |
| PGI:PGII | 6.5±2.5 | 4.7±1.5 | 3.2±1.5 | 2.2±2.0 |
Table 3.
Mean serum concentrations of pepsinogen I, II and pepsinogen I/II ratios in subjects with non-atrophic gastritis (NAG) and atrophic gastritis (AG)
| NAG (n=51) | AG (n=59) | P-value | |
|---|---|---|---|
| PGI (ng/mL) | 54.2 | 51.8 | 0.578 |
| PGII (ng/mL) | 11.5 | 16.2 | 0.074 |
| PGI:PGII | 4.7 | 3.2 | 0.021 |
Table 4.
Mean serum concentrations of pepsinogen I, II and the pepsinogen I/II ratios in subjects with non-atrophic gastritis (NAG) and atrophic gastritis (AG) according to Helicobacter pylori infection status


 PDF
PDF ePub
ePub Citation
 Print
Print


 XML Download