Abstract
Background
An increased level of beta2-microglobulin (β2M) is seen in diseases such as lymphoproliferative diseases, renal diseases, solid tumors, liver diseases, certain viral infection, or chronic inflammatory diseases, etc. In this study, we evaluated a quantitative β2M assay for precision and linearity using an automated turbidimetric immunoassay (TIA) by Hitachi 7600-110 (Hitachi High Technologies Co., Japan). The TIA of β2M was compared with a chemiluminescent immunoassay (CLIA) by Immulite 2000 (Diagnostic Products Corporation, USA).
Methods
Two TIAs, the Hitachi 7600-110 with Roche reagent (Roche-TIA) and the Hitachi 7600-110 with HBI reagent (HBI-TIA), were evaluated for within-run precision, within-day precision, between-days precision, and linearity. With 68 serum samples, two TIAs were compared with Immulite 2000 using DPC reagent (DPC-CLIA). These data were analyzed by Passing-Bablok analysis and Bland-Altman analysis.
Results
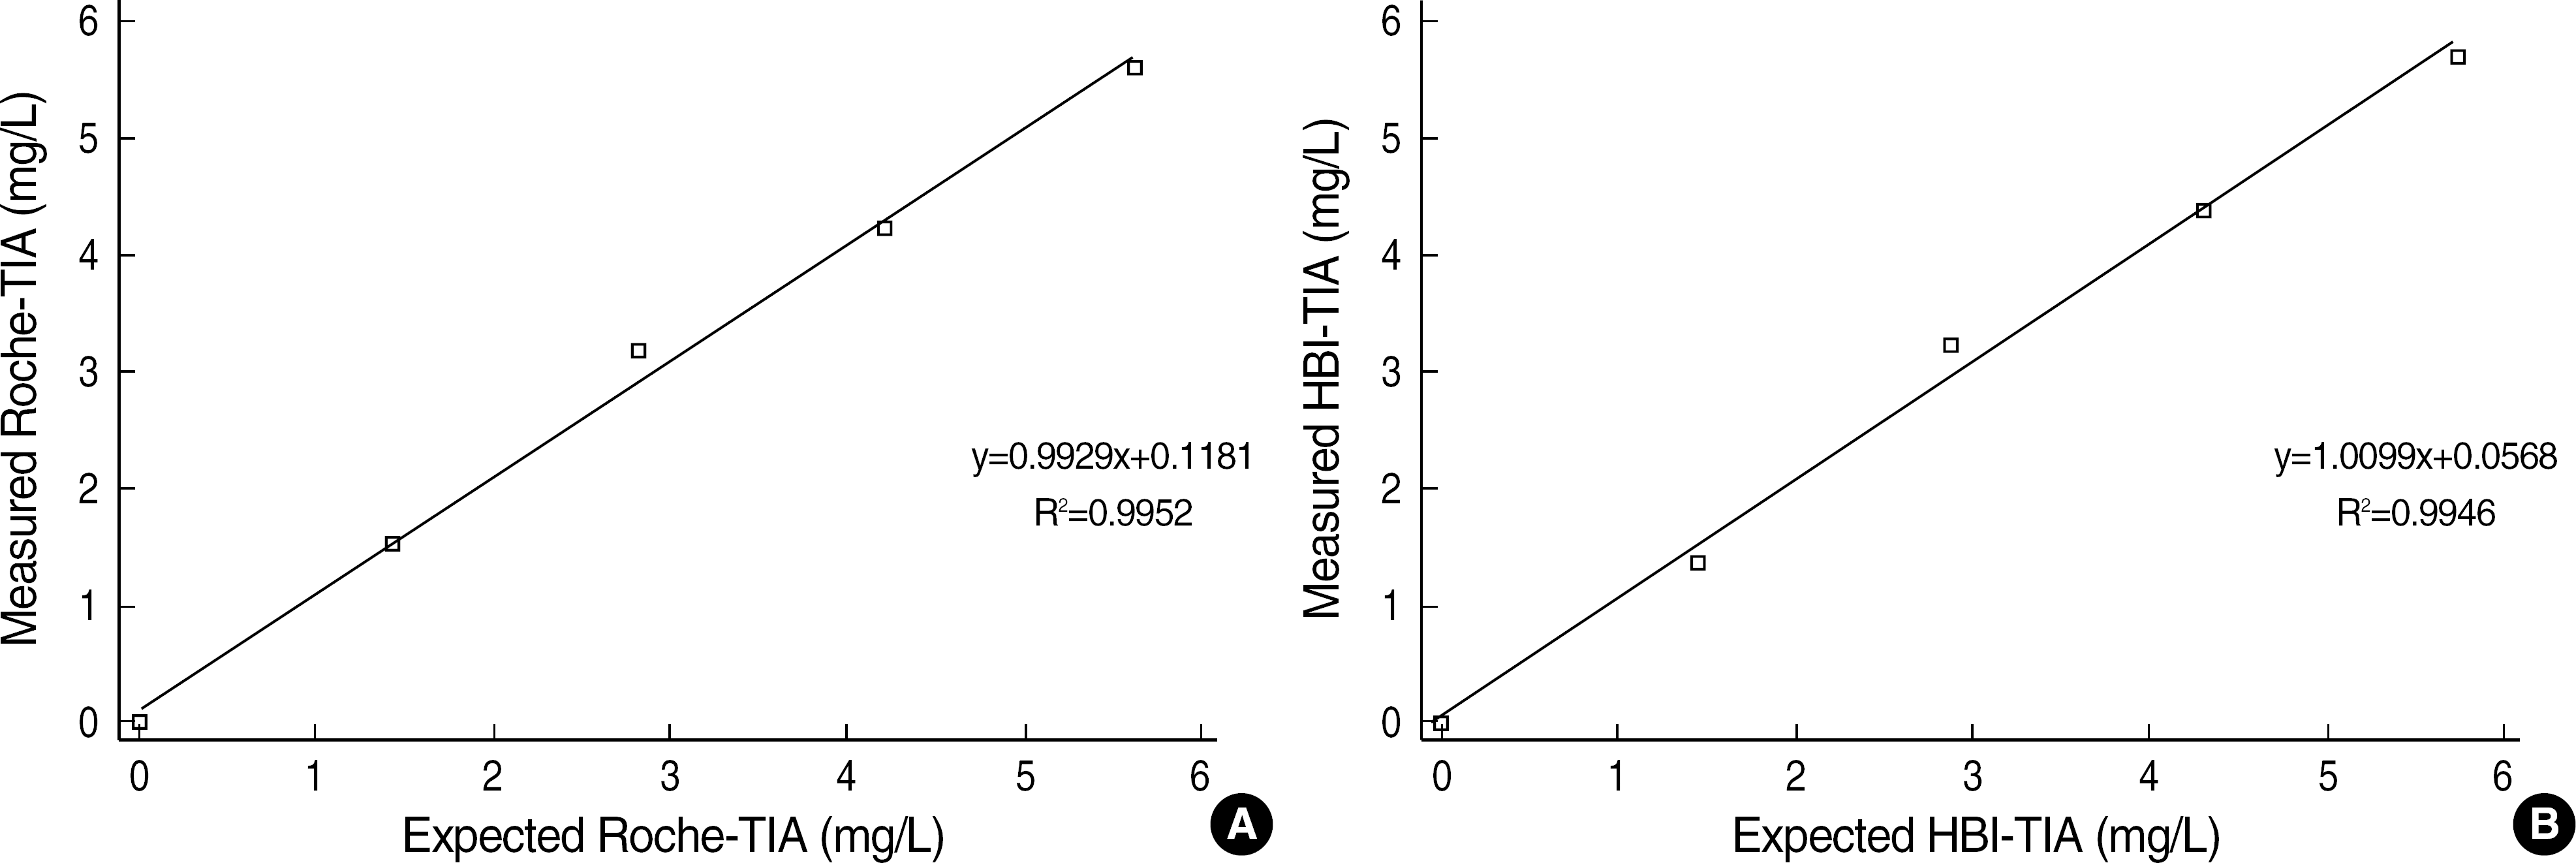
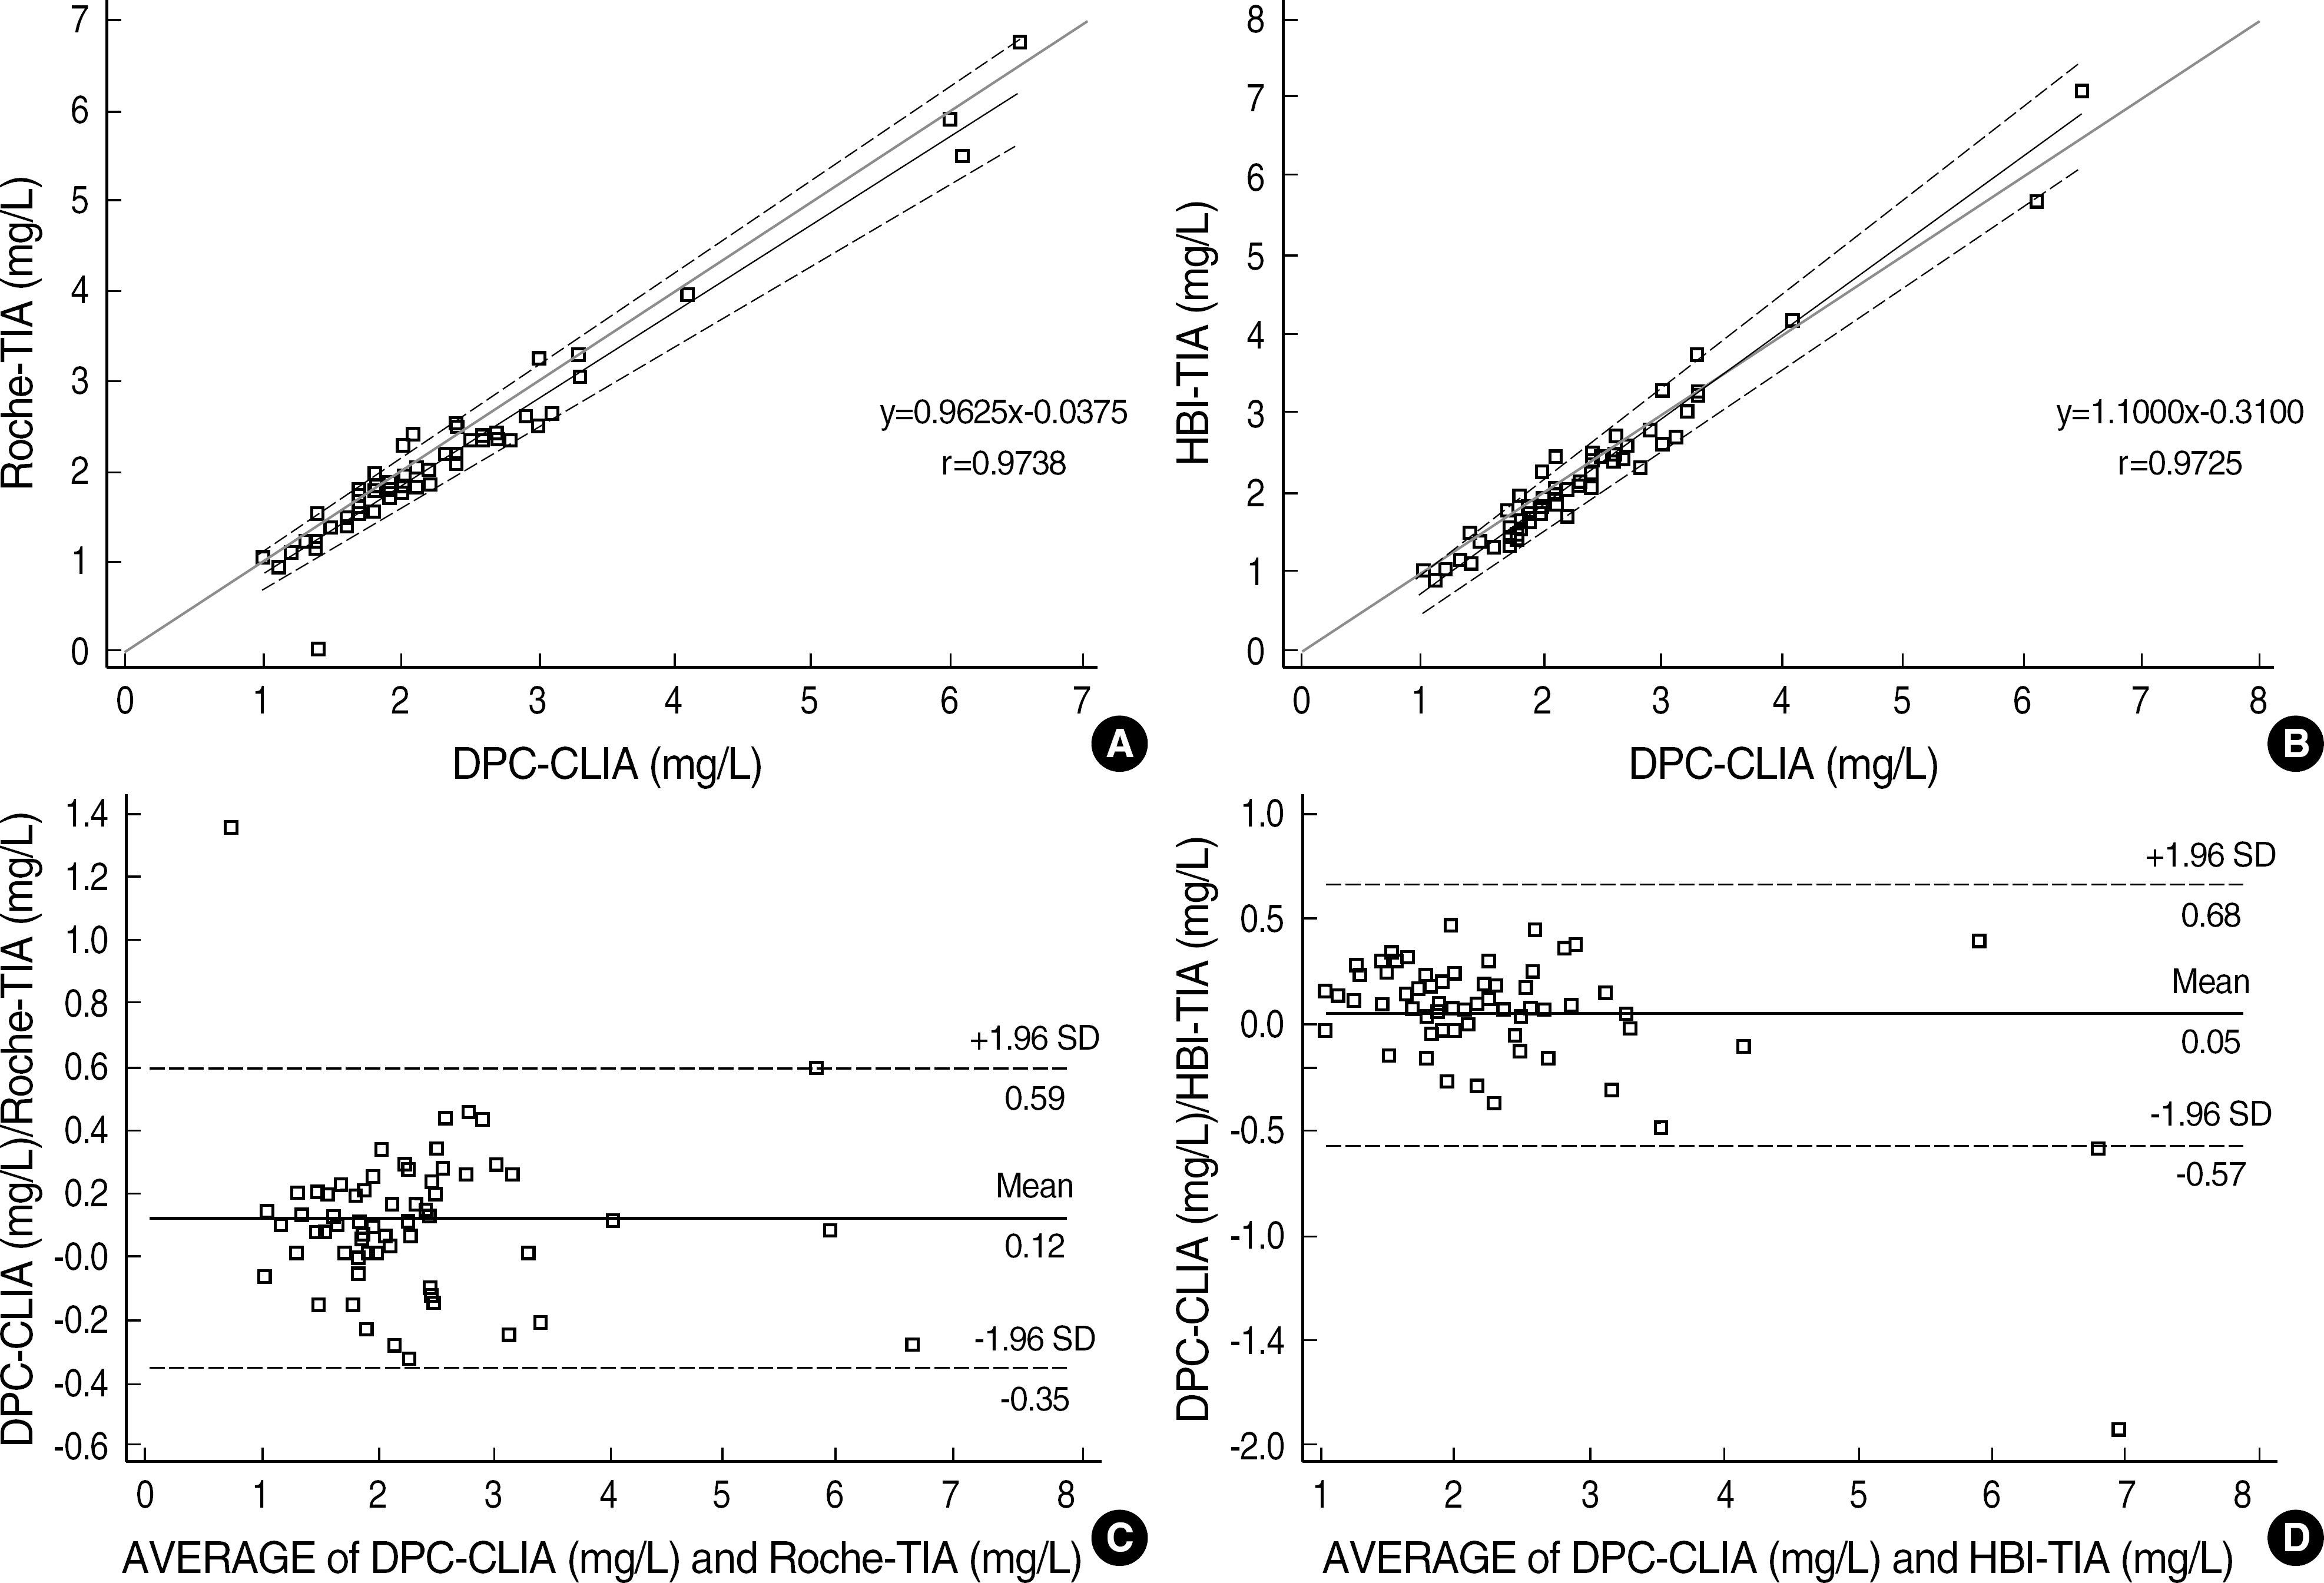
The coefficients of variation (CVs) of within-run precision, within-day precision, and between-days precision were less than 7% in all groups. The linearity tests of the two TIAs were maintained well (Roche-TIA: R2=0.9952; HBI-TIA: R2=0.9946). The comparison study indicated good correlations (Roche-TIA/DPC-CLIA: r=0.9738, y=0.9625x-0.0375; HBI-TIA/DPC-CLIA: r=0.9725, y=1.1000x-0.3100). In Bland-Altman analysis, less than 2SD differences were observed between the two groups.
Go to : 
REFERENCES
1.Terrier N., Bonardet A., Descomps B., Cristol JP., Dupuy AM. Determination of beta2-microglobulin in biological samples using an immunoenzymometric assay (chemiluminescence detection) or an immunoturbidimetric assay: comparison with a radioimmunoassay. Clin Lab. 2004. 50:675–83.
2.Bethea M., Forman DT. Beta2-microglobulin: its significance and clinical usefulness. Ann Clin Lab Sci. 1990. 20:163–8.
3.Shuster J., Gold P., Poulik MD. Beta2-microglogulin levels in cancerous and other disease states. Clin Chim Acta. 1976. 67:307–13.
4.Bosch JA., Ruibal A., Vilardell M., Encabo G., Usón M., Ordi J, et al. Serum beta2 microglobulin in patients with solid tumors and tumors of the hematopoietic system. Rev Esp Oncol. 1984. 31:21–5.
5.Haferlach T., Löffler H. Prognostic factors in multiple myeloma: practicability for clinical practice and future perspectives. Leukemia. 1997. 11(S):S5–9.
6.Anagnostopoulos A., Zervas K., Kyrtsonis M., Symeonidis A., Gika D., Bourantas K, et al. Prognostic value of serum beta2-microglobulin in patients with Waldenstrom's macroglobulinemia requiring treatment. Clin Lymphoma Myeloma. 2006. 7:205–9.
7.Ernerudh J., Olsson T., Berlin G., von Schenck H. Cerebrospinal fluid immunoglobulins and beta2-microglobulin in lymphoproliferative and other neoplastic diseases of the central nervous system. Arch Neurol. 1987. 44:915–20.
8.Tagarro A., Garcia-Alix A., Alarcon A., Hernanz A., Quero J. Congenital syphilis: beta2-microglobulin in cerebrospinal fluid and diagnosis of neurosyphilis in an affected newborn. J Perinat Med. 2005. 33:79–82.

9.Lifson AR., Hessol NA., Buchbinder SP., O'Malley PM., Barnhart L., Segal M, et al. Serum beta2-microglobulin and prediction of progression to AIDS to HIV infection. Lancet. 1992. 339:1436–40.
10.Falus A., Meretey K., Glikmann G., Svehag SE., Fabian F., Bohm U, et al. Beta2-microglobulin-containing IgG complexes in sera and synovial fluids of rheumatoid arthritis and systemic lupus erythematosus patients. Scand J Immunol. 1981. 13:25–34.

11.Hallgren R. Serum beta2-microglobulin in liver disease. Scand J Clin Lab Invest. 1979. 39:441–7.
12.Malaguarnera M., Di Fazio I., Ferlito L., Pistone G., Laurino A., Vinci E, et al. Increase of serum beta2-microglobulin in patients affected by HCV correlated hepatocellular carcinoma. Eur J Gastroenterol Hepatol. 2000. 12:937–9.
13.Woo J., Floyd M., Cannon DC. Albumin and beta2-microglobulin radioimmunoassay applied to monitoring of renal-allograft and in differentiating glomerular and tubular diseases. Clin Chem. 1981. 27:709–13.
14.National Committee for Clinical Laboratory Standards. How to define and determine reference intervals in the clinical laboratory; Approved guideline-second edition. NCCLS document C28-A2. Wayne, Pennsylvania: National Committee for Clinical Laboratory Standards;2000.
15.National Committee for Clinical Laboratory Standards. Evaluation of the linearity of quantitative measurement procedures: A statistical approach; Approved guideline. NCCLS document EP6-A. Wayne, Pennsylvania: National Committee for Clinical Laboratory Standards;2003.
16.Bablok W., Passing H., Bender R., Schneider B. A general regression procedure for method transformation. Application of linear regression procedures for method comparison studies in clinical chemistry, Part III. J Clin Chem Clin Biochem. 1988. 26:783–90.

17.Dewitte K., Fierens C., Stockl D., Thienpont LM. Application of the Bland-Altman plot for interpretation of method-comparison studies: a critical investigation of its practice. Clin Chem. 2002. 48:799–801.

18.Berggard I., Bearn AG. Isolation and properties of a low molecular weight beta2-globulin occurring in human biological fluids. J Biol Chem. 1968. 243:4095–103.
19.Plesner T., Norgaard-Pedersen B., Boenisch T. Radioimmunoassay of beta2-microglobulin. Scand J Clin Lab Invest. 1975. 35:729–35.
20.Bernard AM., Vyskocil A., Lauwerys PR. Determination of beta2-microglobulin in human urine and serum by latex immunoassay. Clin Chem. 1981. 27:832–7.
21.Viedma JA., Pacheco S., Albaladejo MD. Determination of beta2-microglobulin in serum by a microparticle-enhanced nephelometric immunoassay. Clin Chem. 1992. 38:2464–8.
22.Newman DJ., Kassai M., Craig AR., Gorman EG., Price CP. Validation of a particle enhanced immunoturbidimetric assay for serum beta 2-microglobulin on the Dade aca. Eur J Clin Chem Clin Biochem. 1996. 34:861–5.
Go to : 
 | Fig. 1.Linearity of concentrations of beta2-microglobulin analyzed by Hitachi 7600-110. (A) Roche-TIA. (B) HBI-TIA. |
 | Fig. 2.Method comparisons of beta2-microglobulin concentrations from 68 samples. (A, B) Passing-Bablok regression analysis. (A) DPC-CLIA vs Roche-TIA; (B) DPC-CLIA vs HBI-TIA. (C, D) Bland-Altman analysis. (C) DPC-CLIA vs Roche-TIA: mean difference, 0.12 mg/L; (D) DPC-CLIA vs HBI-TIA: mean difference, 0.05 mg/L. |
Table 1.
Precision of beta2-microglobulin assay by turbidimetric immunoassay at low and high levels
| Low level (mg/L) Mean 0.90 Range 0.72-1.08 | High level (mg/L) Mean 3.00 Range 2.40-3.60 | ||||
|---|---|---|---|---|---|
| Roche∗ | HBI† | Roche∗ | HBI† | ||
| Within-run | Mean (mg/L) | 0.85 | 0.94 | 2.94 | 3.43 |
| SD (mg/L) | 0.01 | 0.05 | 0.03 | 0.05 | |
| CV (%) | 1.17 | 5.32 | 1.02 | 1.46 | |
| Within-day | Mean (mg/L) | 0.85 | 0.91 | 2.96 | 3.37 |
| SD (mg/L) | 0.02 | 0.06 | 0.03 | 0.08 | |
| CV (%) | 2.04 | 6.46 | 1.08 | 2.34 | |
| Between-days | Mean (mg/L) | 0.77 | 0.80 | 2.80 | 3.34 |
| SD (mg/L) | 0.04 | 0.05 | 0.05 | 0.10 | |
| CV (%) | 4.84 | 6.42 | 1.85 | 2.86 | |
| Total CV (%) | 5.99 | 6.56 | 2.17 | 2.80 | |


 PDF
PDF ePub
ePub Citation
 Print
Print


 XML Download