Abstract
Background
This study was purposed to establish reference values for platelet activation markers and leukocyte-platelet aggregates in the evaluation of the platelet function tests using flow cytometry.
Methods
Whole blood samples were obtained from 30 volunteers of healthy adults. Diluted blood samples, either in the resting state or in activated state by the addition of agonist, 20 μM ADP or 100 μM TRAP, were stained with fluorescent conjugated monoclonal antibody of PAC1 or CD62P. Then, the percentages of expression for each marker were analyzed by flow cytometry. For leukocyte-platelet aggregates, monoclonal antibodies of CD41a, CD14 and CD45 were added simultaneously to undiluted whole blood.
Results
Reference values for the percentages of the expression of PAC1 and CD62P, respectively, were 0.1–12.5% and 0.0–4.7% at the resting state, 65.3–92.4% and 39.0–75.7% with the addition of 20 μM ADP, and 68.1–93.1% and 60.5–91.2% with the addition of 100 μM TRAP. Reference values for leukocyte-platelet aggregates, granulocyte-platelet aggregates, and lymphocyte-platelets aggregates were 2.8–23.6%, 5.3–34.2%, and 4.9–21.6%, respectively.
References
1. Flores NA, Sheridan DJ. The pathophysiological role of platelets during myocardial ischaemia. Cardiovasc Res. 1994; 28:295–302.

3. Rinder HM, Bonan JL, Rinder CS, Ault KA, Smith BR. Activated and unactivated platelet adhesion to monocytes and neutrophils. Blood. 1991; 78:1760–9.

4. Harrison P, Cramer EM. Platelet alpha-granules. Blood Rev. 1993; 7:52–62.
5. Shattil SJ, Hoxie JA, Cunningham M, Brass LF. Changes in the platelet membrane glycoprotein IIb-IIIa complex during platelet activation. J Biol Chem. 1985; 260:11107–14.

6. Xiao Z, Theroux P. Clopidogrel inhibits platelet-leukocyte interactions and thrombin receptor agonist peptide-induced platelet activation in patients with an acute coronary syndrome. J Am Coll Cardiol. 2004; 43:1982–8.

7. Yamazaki M, Uchiyama S, Iwata M. Measurement of platelet fibrinogen binding and p-selectin expression by flow cytometry in patients with cerebral infarction. Thromb Res. 2001; 104:197–205.

8. Lim YA, Hyun BH. Evaluation of platelet parameters on the ADVIA 120 as the quality indicator for stored platelets. Clin Lab Haematol. 2002; 24:377–84.

9. Li N, Goodall AH, Hjemdahl P. A sensitive flow cytometric assay for circulating platelet-leucocyte aggregates. Br J Haematol. 1997; 99:808–16.

10. Villmow T, Kemkes-Matthes B, Matzdorff AC. Markers of platelet activation and platelet-leukocyte interaction in patients with myeloproliferative syndromes. Thromb Res. 2002; 108:139–45.

11. Jacoby RC, Owings JT, Holmes J, Battistella FD, Gosselin RC, Paglieroni TG. Platelet activation and function after trauma. J Trauma. 2001; 51:639–47.

12. Holmes MB, Sobel BE, Howard DB, Schneider DJ. Differences between activation thresholds for platelet P-selectin glycoprotein IIb-IIIa expression and their clinical implications. Thromb Res. 1999; 95:75–82.
13. Roshan TM, Normah J, Rehman A, Naing L. Effect of menopause on platelet activation markers determined by flow cytometry. Am J Hematol. 2005; 80:257–61.

14. Michelson AD, Barnard MR, Hechtman HB, MacGregor H, Connolly RJ, Loscalzo J, et al. In vivo tracking of platelets: circulating degranulated platelets rapidly lose surface P-selectin but continue to circulate and function. Proc Natl Acad Sci USA. 1996; 93:11877–82.

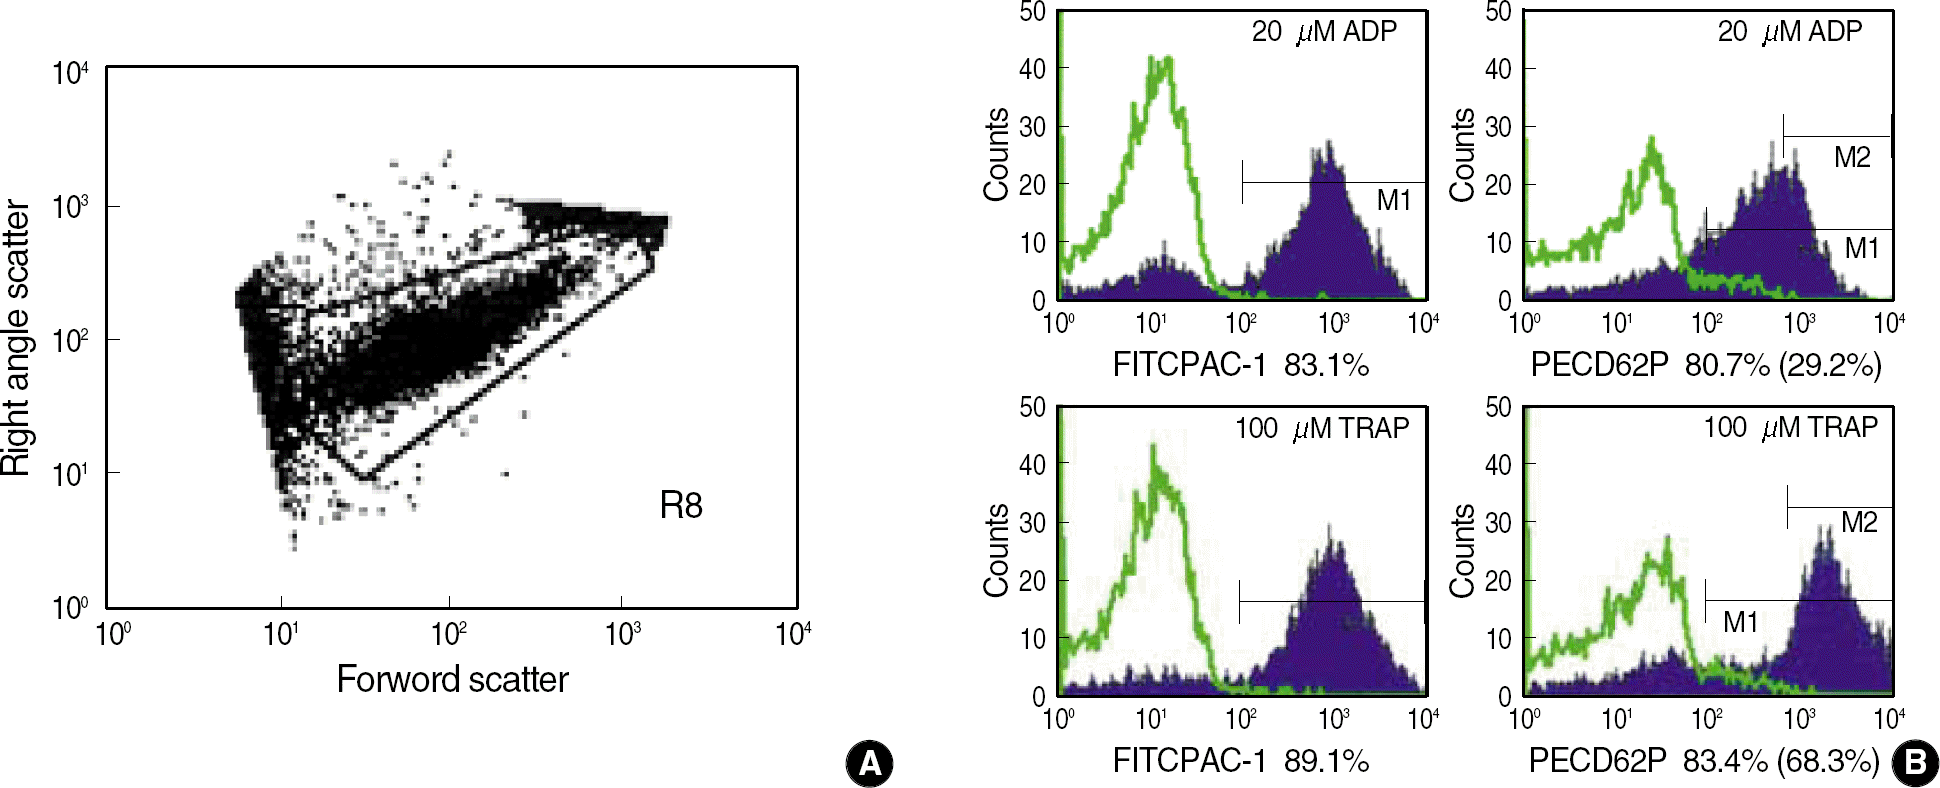
Fig. 1.
Dots plot (A) and histograms (B) for FITC-PAC1 and PE-CD62P platelets after stimulation by 20 μM ADP or 100 μM TRAP. Gated R8 was defined as platelets by forward and side scatter characteristics. Histograms (B) are overlayed with isotype control, and the percentages of PAC1 expressing platelets after stimulation by 20 μM ADP and 100 μM TRAP were 83.1% and 89.1% (M1), and those of CD62P were 80.7% and 83.4% (M1), 29.2% and 68.3 (M2).

Fig. 2.
Flow cytometric analysis of leukocyte-platelet aggregates using 3 color labeling (FITC-CD41a, PE-CD14, PerCP-CD45) in whole blood. The leukocyte populations are defined by their size (forward side scatter, FSC) and anti-CD45 densities (R1). Anti-CD45 and anti-CD14 were used to distinguish neutrophils (R3), lymphocyte (R4), monocytes (R5) and total leukocytes (R2). The histogram represents neutrophilplatelet aggregates as the percentages of CD41a expressed platelets (M1) in neutrophils (R3).

Table 1.
Reference values (central 95 percentile) for percentages of expression and delta expression (Δ) of platelets labeling FITC-PAC1 or PE-CD62P in the resting state or in an activated state with stimulation by 20 μM ADP or 100 μM TRAP
| Resting state |
Activated state with stimulation by |
Δ between resting state with stimulation by |
|||
|---|---|---|---|---|---|
| 20 μM ADP | 100 μM TRAP | 20 μM ADP | 100 μM TRAP | ||
| PAC1 | 0.3–12.5 | 65.3–92.4 | 68.1–93.1 | 64.2–89.7 | 63.6–91.6 |
| CD62P | 0.0–4.7 | 39.0–75.7* | 60.5–91.2 | 37.6–73.3* | 59.4–90.7 |


 PDF
PDF ePub
ePub Citation
 Print
Print


 XML Download