

 PDF
PDF ePub
ePub Citation
 Print
Print


INTRODUCTION
Ischemia and reperfusion (I/R) injury during liver surgery is an inevitable, unsolved problem that often leads to fatal, irreversible postoperative liver failure. Assessment of liver function has been an important clinical issue, but there is no direct, practical method to assess the liver function or cell viability during liver surgery in a real-time manner (like an electrocardiogram (ECG) in heart disease).
Recently, we focused on bioelectrical impedance (BEI) to monitor liver cell viability during I/R based on the fact that ischemia causes biochemical and physiological changes in living tissue, which influence its BEI.(1,2) Fortunately, we could publish significance of BEI during I/R injury(3) and found possible role of BEI to monitor I/R injury during liver surgery.(4,5) But the mechanism responsible for ischemia-related BEI changes has not been clearly determined.
The electrical properties of biologic tissue are expressed by 3 parameters; extracellular resistance, intracellular resistance, and cell membrane capacitance.(2) Ischemia causes biochemical and physiological changes in tissues which influence impedance, especially at lower frequencies,(1) because low frequency currents do not pass through the cell membrane.(6) Accordingly, BEI at lower frequency is responsible for the resistance of the extracellular fluid (ECF), and thus, in the present study, we focused on ECF changes to clarify the mechanism responsible for BEI changes during ischemia.
We investigated the mechanism underlying BEI changes during hepatic ischemia by analyzing intracellular ATP contents and cation concentrations in ECF using an in vivo microdialysis technique, and by measuring hepatocyte sizes and histological changes in liver.
METHODS
1) Animals
Male Sprague-Dawley rats (weighing 200~250 g) purchased from Hyo-Chang Science (Daegu, Korea) were used in this study. Prior to the experiment, all rats were fasted overnight with free access to water. The care, maintenance, and treatment of all animals used in this study complied with protocol 2008-11 issued by the Institutional Animal Care and Use Committee of Yeungnam University School of Medicine.
2) Liver ischemia and bioelectrical impedance measurements
A model of 70% partial hepatic ischemia was used in this study.(7) After being anesthetized with intraperitoneal ketamine (100 mg/kg) and xylazine® (10 mg/kg), each rat underwent a midline laparotomy, and the hepatoduodenal ligament was dissected. Ischemia was induced in median and left liver lobes by clamping the portal triad (portal vein, hepatic artery, and bile ducts) with a microvascular clamp. Livers were subjected to 120 minutes of warm ischemia. BEIs were measured at 0.12 KHz using a LCR meter (GS-4311B, Ando, Japan) every 10 minutes (n=6), as previously described.(3) The distance between the 2 platinum electrodes (length 25 mm, diameter 0.45 mm) inserted into the median lobe was 10 mm. The electrodes were coated with Teflon except for a 2 mm region at their tips. A heat mattress and transparent acryl case were used to maintain rat body temperature and ambient humidity.
3) Measurement of ATP contents
Approximately 100 mg of fresh liver tissue from the median lobe (n=6) was excised every 30 minutes during the 120 minute ischemic period and immediately placed into ice-cold 10% HClO4 buffer and homogenized. The ATP contents of liver tissue were measured as described by Khan.(8) Briefly, homogenates were centrifuged at 4,500 rpm for 10 minutes at 4℃. A 500 µl aliquot of supernatant was then neutralized with 200 µl of 2.5 mol/L KOH, and the precipitate was removed by centrifugation at 4,500 rpm for 5 minutes at 4℃. 10 µl of supernatant was then mixed (1:9) with 10 mmol/L of Tris-acetate buffer, and ATP relative luminescence units were measured using ATP Assay Kits (ENLITEN® ATP Assay System Bioluminescence Detection Kit for ATP, Promega, Madison, WI, USA) by using a luminometer (TD-20/20, Turner Designs, Sunnyvale, CA, USA).
4) Microdialysis
A microdialysis technique was used to determine recovery rate and cation concentrations in ECF. The microdialysis probe (CMA 30 Linear Microdialysis Probe, CMA/Microdialysis, Solna, Sweden) with a cuprophane membrane (length 10 mm, molecular cut off 6,000 Daltons, outer diameter 0.24 mm) was used. The inlet of the probe was connected to a perfusion pump (CMA 102 Microdialysis Pump, CMA/Microdialysis AB, Solna, Sweden). To remove the glycerol in which the probe was originally packaged, it was placed in 70% aqueous ethanol and perfused with Hartmann's solution at a rate of 8 µl/minute for 10 minutes.
The construction of Zero net flux (ZNF) curve: The probe used had a dialysis membrane, which enables ion movement. After perfusing the microdialysis probe with 4 different perfusates, depending upon the ion concentration gradient, we can have 4 different values which enable to construct the ZNF curve. For example, when the ion concentration in the dialysate is higher than that in the perfusate, we can have a positive value on the ordinate, conversely if the ion concentration in the dialysate is lower than that in the perfusate, we have a negative value on the ordinate. When no ions diffuses from ECF or probe (y=0), the value is equal to the ion concentration in the ECF (x value) Ion recovery was calculated from the slope of the line in the ZNF curve.(9)
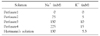
ZNF curves for [Na+] and [K+] in Hartmann's solution: 4 microdialysis probes were placed in Hartmann's solution, and perfused with 4 known different concentrations of perfusates (0, 75, 150, 225 mM for Na+ and 0, 5, 10, 15 mM for K+) (Table 1). The flow rate through the dialysis probe was increased to 8µl/minute for 10 minutes to ensure that liquid was flowing, and then reduced to a flow rate of 1µl/minute. After a 60-minute equilibrium period, dialysates were collected in 1.5 ml e-tubes every 30 minutes (n=6). Recoveries of Na+ and K+ from Hart-mann's solution were calculated from the slope of the line in the ZNF curve.
ZNF curves for [Na+] and [K+] in liver tissue ECF in vivo prior to ischemia: Prior to inserting the microdialysis probe into liver tissue, a rat was anesthetized and the abdomen was opened. Four microdialysis probes were inserted as described by the manufacturer (CMA/Microdialysis AB, Solna, Sweden). Briefly, the introducing needle was past through the median lobe of liver and the probe was slid through the needle end of the introducer. While ensuring that the membrane was located in the middle of the introducer and the introducer needle was carefully withdrawn. The 4 microdialysis probes were perfused with 4 known concentrations of perfusates (0, 75, 150, 225 mM for Na+ and 0, 5, 10, 15 mM for K+), respectively (Table 1). The flow rates were same to the above explanation in Hartmann's solution. After a 60-minutes equilibrium period, dialysates were collected in 1.5 ml e-tubes for 30 minutes (n=6). The dead space between the tip of the dialysis probe and the end of the outlet tube was 15µl. Sample collection was allowed for 15 minutes to compensate for the dead space volume in the microdialysis probe. Recoveries of Na+ and K+ from ECF in liver tissue in vivo were calculated from the slope of the line in the ZNF curve.
Measurement of [Na+] and [K+] in liver tissue ECF in vivo: After perfusing 4 known perfusates, 4 dialysates were collected during the following ischemic periods (0, 0~30, 30~60, 60~90, and 90~120 minutes). At each ischemic period, we can draw different ZNF curve. Depending on the ZNF curve at each ischemic time period, we obtained the concentrations of Na+ and K+ in liver tissue ECF in vivo (x value when y=0). Perfusates and dialysates were analyzed for Na+ and K+ using a Radiometer (ABL800 FLEX, Radiometer America Inc, Westlake, OH, USA) to construct the ZNF curves.
5) Histology
Median lobe liver tissue (n=6) was excised every 30 minutes during the 120 minute ischemic period, fixed in 10% formalin, dehydrated, and embedded in paraffin. Four micron-thick sections were stained with hematoxylin and eosin (H&E) and subjected to terminal deoxynucleotidyl transferase-mediated dUTP nick end-labeling (TUNEL) assays (ApopTag Peroxidase in situ Apoptosis Detection Kit, Chemicon, NY, USA). Hepatocyte diameters were measured using the Image J program provided by National Institutes of Health.
6) Statistical analysis
All data are expressed as means±SEs. Data were analyzed using SPSS v. 14.0. Mean values were compared using ANOVA with repeated measures to determine the significances differences at different time points during ischemia. P-values of less than 0.05 were considered statistically significant.
RESULTS
1) Changes in tissue bioelectrical impedance
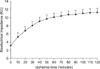
In our previous study,(3,4) we found that the BEI of hepatic tissue increased significantly during ischemia at low frequency versus high frequency. In the present study, BEI (kΩ) at 0.12 KHz were 3.1±0.2, 5.3±0.6, 6.8±0.7, 8.1±0.3, 9.1±0.3, 9.7±0.4, 10.1±0.5, 10.4±0.6, 10.8±0.7, 10.8±0.8, 11.1±0.9, 11.2±0.9, and 11.3±0.9 every 10 minutes in 120 minutes of ischemia, respectively. BEI increased gradually during 60 minutes of ischemia and then tended to plateau (Fig. 1).
2) ATP contents
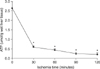
The ATP contents decreased to below 20% of baseline after 60 minutes of ischemia, but did not change significantly thereafter. ATP (µmol/g wet liver tissue) contents were 2.65±0.34, 0.61±0.07, 0.45±0.07, 0.25±0.09, and 0.22±0.09, at 0, 30, 60, 90, and 120 minutes of ischemia, respectively (Fig. 2).
3) ZNF curves for [Na+] and [K+] in Hartmann's solution
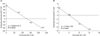
Fig. 3 shows the ZNF curves for Na+ and K+ in Hartmann's solution. After perfusing the 4 different perfusates, 4 dialysates were collected and analyzed, and then depending upon the ion concentration gradients 4 points were plotted to construct ZNF curve. The linear equation of the Na+ curve was y=-0.6693x+87.8 R2=0.9849 and that of the K+ curve was y=-0.748x+3.86 R2=0.9905. The concentrations of Na+ and K+ in Hartmann's solution calculated using the ZNF curve were 131.18 mM and 5.16 mM, respectively. These values were close to real concentrations in Hartmann's solution (Table 1). The recoveries of Na+ and K+ were 66.93% and 74.8% as calculated using the slope of the line in the ZNF curves.
4) ZNF curves for [Na+] and [K+] in liver tissue ECF in vivo prior to ischemia
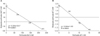
Fig. 4 shows of ZNF curves for Na+ and K+ in liver tissue ECF in vivo prior to ischemia. According to the method described above, 4 points were plotted to construct ZNF curve. For Na+, the linear equation was y=-0.224x+33.7 R2=0.9931, and or K+ the linear equation was y=-0.244x+1.83 R2=0.9818. Hepatic extracellular [Na+] and [K+] values calculated from the ZNF curve were 150.4 mM and 7.5 mM. Recoveries of Na+ and K+ were 22.4% and 24.4% as calculated from the slope of the line in the ZNF curve. Recoveries of Na+ and K+ in liver tissue ECF in vivo were significantly less than those in Hartmann's solution.
5) Concentrations of Na+ and K+ in liver tissue ECF in vivo
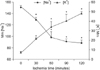
Concentrations of Na+ and K+ in ECF in liver tissue in vivo were calculated using the ZNF curves made at each time point during ischemia (Fig. 5). [Na+] (mM) were 150.4±3.8, 128.9±5.1, 97.8±10.6, 90.7±4.9, and 88.7±5.0, and [K+] (mM) were 7.5±0.3, 22.1±0.7, 34.3±5.5, 40.4±7.0, and 48.3±1.7, at 0, 0~30, 30~60, 60~90, and 90~120 minutes of ischemia, respectively (Fig. 5).
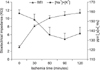
6) Changes of BEI and summed [Na+] and [K+] in liver tissue ECF in vivo
BEI (kΩ) at 0.12 KHz were 3.1±0.2, 8.1±0.3, 10.1±0.5, 10.8±0.8, and 11.3±0.9 at 0, 30, 60, 90, and 120 minutes of ischemia, respectively (Fig. 6). [Na+]+[K+] (mM) were 157.8±3.8, 151.4±5.9, 135.7±7.6, 131.0±6.2, and 137.0±6.3 at 0, 30, 60, 90, and 120 minutes of ischemia, respectively (Fig. 6). There was inverse symmetry between BEI changes and [Na+]+[K+].
7) Hepatocyte diameter and H&E and TUNEL staining
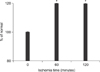
Hepatocyte diameter increased by about 20% of normal after 60 minutes of ischemia, but did not change significantly thereafter (Fig. 7). No significant differences histological differences were detected by H&E or TUNEL staining during the ischemic period (image data not shown). No apoptotic or necrotic changes were observed during 120 minutes of ischemia.
DISCUSSION
This study was undertaken to investigate the mechanism underlying BEI increases in hepatic tissues subject to ischemia. Our findings suggest that the mechanism responsible for BEI changes during ischemia involves, at least in part, cation concentration changes in the ECF, which are probably related to the ATP contents in hepatocytes.
Ischemia causes biochemical and physiological changes in tissue, which alter tissue impedance.(1) The possibility of estimating ischemia-related liver tissue changes using BEI has been previously suggested.(2) We have been studying BEI changes during hepatic ischemia and reperfusion (I/R) to investigate the correlation between BEI changes and liver cell viability.(3-5) Because I/R injury during liver surgery is an inevitable, unsolved problem sometimes leads to irreversible hepatic failure, but there is no practical method to monitor that in a real-time manner as an ECG during surgery. In addition, BEI changes per se are also worthy of study, and a number of studies have been conducted to investigate the causes of BEI changes during ischemia. It is evident that an increase in tissue BEI provides a reliable indication of anoxic cellular edema, because BEI detects extracellular space narrowing, the closures of gap junctions,(10) the closures of membrane ion channels caused by ATP depletion, and depolarization.(11) However, the mechanism responsible for BEI changes due to ischemia has not been elucidated.
Electrical currents in biological tissues are due to ionic conduction. We hypothesized that change in BEI during ischemia are due to a reduced extracellular volume, possibly due to Na+-K+pump failure, which influences tissue conductivity. Furthermore, decreases in ion concentration in the ECF reduce current flow and increase BEI. Because the disruption of ionic homeostasis during ischemia is a well-characterized event, cellular ATP losses cause Na+-K+ pump failure, which prevents the outflux of 3 Na+ and the influx of 2 K+ movements across the plasma membrane.
A search of the scientific literature revealed that this is the first study of cation concentrations and BEI changes in an in vivo warm hepatic ischemic model. The microdialysis technique has been used in both animal and human studies as a tool for sample analysis in ECF,(12) and it facilitates sampling of interstitial fluids without removing fluid.(13,14) We believe that cation concentration trends in ECF are probably more important than the actual cation concentrations, because of possible inaccuracies associated with cation recovery from living tissue. In the present study, recovery in Hartmann's solution was significantly greater than in vivo recovery, which indicates that large errors would have been encountered if we had used the recovery from Hartmann's solution to determine hepatic extracellular ion concentrations. The observed discrepancy is probably caused by viscosity differences.
Fig. 1 shows that hepatic tissue BEI increased gradually during 60 minutes of ischemia in this study. The mechanism behind this increase in BEI is thought to be a decrease in extracellular volume (Fig. 7). Haemmerich et al.(11) observed that an initial increase in resistivity persisted in liver tissue until 2 hours post-mortem, and suggested that this increase was due to a decline in ECF volume. Fleischhauer et al.(15) and Yan et al.(16) demonstrated that initial impedance increases during zero-flow ischemia and is sensitive to osmotically induced cell swelling. We consider that cell swelling implies a redistribution of intracellular and extracellular spaces, which causes tissue structural changes, and subsequent BEI changes. Furthermore, an increase in [K+] and a decrease in [Na+] in ECF may induce a decrease in extracellular volume (Fig. 7). These concentration changes can be explained by failure of the Na+-K+ pump due to ischemia-induced ATP depletion.
Fig. 1 shows that BEI showed a tendency to plateau after 60 minutes of ischemia, and no significant differences were observed between 60 and 120 minutes of ischemia with respect to ATP contents, cation changes, or extracellular volumes. Accordingly, we believe that 120 minutes of ischemia is insufficient to cause serious liver cell damage, the liver has relatively good tolerance to 120 minutes of 70% hepatic ischemia.(4,5) The mechanism of slower impedance progression to plateau after 60 minutes is suggestive of a slower change in extracellular volume due to slower cation concentration changes in the ECF (Fig. 5). Fig. 6 shows the correlation between BEI changes and summed [Na+] and [K+] in the ECF of liver tissue in vivo. More specifically, BEI changes showed an inverse correlation with [Na+]+[K+]. Furthermore, the [Na+]+[K+] decreased significantly during the first 60 minutes of ischemia, but did not decrease markedly during the following 60 minutes. Even though in different organ, del Rio et al.(17) also reported that a slower myocardial electrical impedance progression to plateau after coronary artery occlusion is related not only to the delayed breakdown in ionic homeostasis, but also to the slower ATP depletion rate.
In conclusion, this study suggests that BEI changes during hepatic ischemia are probably caused by sodium and potassium concentration changes in the ECF due to reduced intracellular ATP contents.
 XML Download