

 PDF
PDF ePub
ePub Citation
 Print
Print


Abstract
Purpose
We used optical coherence tomography (OCT) for longitudinal evaluation of structural changes in the peripapillary retinal nerve fiber layer (RNFL), the macular ganglion cell-inner plexiform layer (GC-IPL), and the macula in patients with traumatic optic neuropathy.
Methods
From May 2012 to April 2015, the medical records of 20 patients with monocular traumatic optic neuropathy who were followed up for over 6 months were retrospectively analyzed. Best-corrected visual acuity was checked and Cirrus high-definition optical coherence tomography (HD-OCT) was used to measure the thicknesses of the peripapillary RNFL, macular GC-IPL, and macula of both eyes at the first visit (within 4 weeks after trauma), at 10 and 24 weeks after trauma, and at the final visits. The differences over time in the parameters of the traumatic and fellow eyes were analyzed.
Results
The final best-corrected visual acuities of the traumatic and fellow eyes differed significantly from those at the first visit (p = 0.007). The average thicknesses of the peripapillary RNFL, the macular GC-IPL, and the macula differed significantly between the traumatic and fellow eyes commencing 10 weeks after trauma (p < 0.001, p = 0.002, p = 0.003, respectively).
Figures and Tables
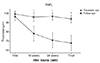 | Figure 1Linear progression of mean retinal nerve fiber layer (RNFL) thickness (µm) of traumatic eye and the fellow eye. Mean RNFL thickness showed significant difference at 10 weeks, 24 weeks after trauma and final follow-up. *Wilcoxon signed rank test (p < 0.05).
|
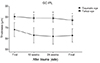 | Figure 2Linear progression of mean Ganglion Cell and Internal plexiform layer (GC-IPL) thickness (µm) of traumatic eye and the fellow eye. Mean GC-IPL thickness showed significant difference at 10 weeks, 24 weeks after trauma and final follow-up. *Wilcoxon signed rank test (p < 0.05).
|
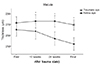 | Figure 3Linear progression of mean macular thickness (µm) of traumatic eye and the fellow eye. Mean macular thickness showed significant difference at 10 weeks, 24 weeks after trauma and final follow-up. *Wilcoxon signed rank test (p < 0.05).
|
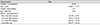
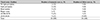

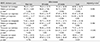
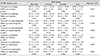
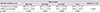
Table 7
Comparison of thickness of each layer of traumatic eye according to the visual acuity (good/poor) on the first visit
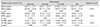
Values are presented as mean ± SD unless otherwise indicated. ‘good’ means ‘visual acuity with 0.1 or higher’ and ‘poor’ means ‘visual acuity with finger count (FC) or lower’.
RNFL = retinal nerve fiber layer; GC-IPL = ganglion cell and internal plexiform layer.
*p-value was calculated by Wilcoxon signed rank test, significant p-value level is <0.05; †Adjusted p-value by linear mixed model, significant p-value level is <0.05.
![]()
References
1. Chaon BC, Lee MS. Is there treatment for traumatic optic neuropathy? Curr Opin Ophthalmol. 2015; 26:445–449.

2. Alford MA, Nerad JA, Carter KD. Predictive value of the initial quantified relative afferent pupillary defect in 19 consecutive patients with traumatic optic neuropathy. Ophthal Plast Reconstr Surg. 2001; 17:323–327.
3. Han J, Byun MK, Lee J, et al. Longitudinal analysis of retinal nerve fiber layer and ganglion cell-inner plexiform layer thickness in ethambutol-induced optic neuropathy. Graefes Arch Clin Exp Ophthalmol. 2015; 253:2293–2299.
4. Park SY, Park SH, Ha SJ, Park SH. Correlation of OCT and hemifield pattern VEP in hemianopia. J Korean Ophthalmol Soc. 2008; 49:1819–1828.
5. Cennamo G, Forte R, Reibaldi M, et al. Evaluation of retinal nerve fiber layer and ganglion cell complex thickness after ocular blunt trauma. Eye (Lond). 2013; 27:1382–1387.
6. Medeiros FA, Moura FC, Vessani RM, Susanna R Jr. Axonal loss after traumatic optic neuropathy documented by optical coherence tomography. Am J Ophthalmol. 2003; 135:406–408.
7. Lee JW, Lai JS, Yick DW, Tse RK. Retrospective case series on the long-term visual and intraocular pressure outcomes of phacomorphic glaucoma. Eye (Lond). 2010; 24:1675–1680.
8. Shin GR, Kim DH. Clinical manifestations and prognosis of patient with traumatic optic neuropathy. J Korean Ophthalmol Soc. 2016; 57:1770–1776.
9. Miki A, Endo T, Morimoto T, et al. Retinal nerve fiber layer and ganglion cell complex thicknesses measured with spectral-domain optical coherence tomography in eyes with no light perception due to nonglaucomatous optic neuropathy. Jpn J Ophthalmol. 2015; 59:230–235.
10. Park JW, Kyung SE. Correlation between visual acuity and retinal nerve fiber layer thickness in optic neuropathies. J Korean Ophthalmol Soc. 2016; 57:628–633.
11. Cunha LP, Costa-Cunha LV, Malta RF, Monteiro ML. Comparison between retinal nerve fiber layer and macular thickness measured with OCT detecting progressive axonal loss following traumatic optic neuropathy. Arq Bras Oftalmol. 2009; 72:622–625.
12. Kanamori A, Nakamura M, Yamada Y, Negi A. Longitudinal study of retinal nerve fiber layer thickness and ganglion cell complex in traumatic optic neuropathy. Arch Ophthalmol. 2012; 130:1067–1069.
13. Steinsapir KD, Goldberg RA. Traumatic optic neuropathy. Surv Ophthalmol. 1994; 38:487–518.
14. Lessell S. Indirect optic nerve trauma. Arch Ophthalmol. 1989; 107:382–386.
15. Quigley HA, Addicks EM. Regional differences in the structure of the lamina cribrosa and their relation to glaucomatous optic nerve damage. Arch Ophthalmol. 1981; 99:137–143.
 XML Download