Abstract
Purpose
To investigate the correlation between en face optical coherence tomography and improvements in the postoperative prognoses of idiopathic epiretinal membranes.
Methods
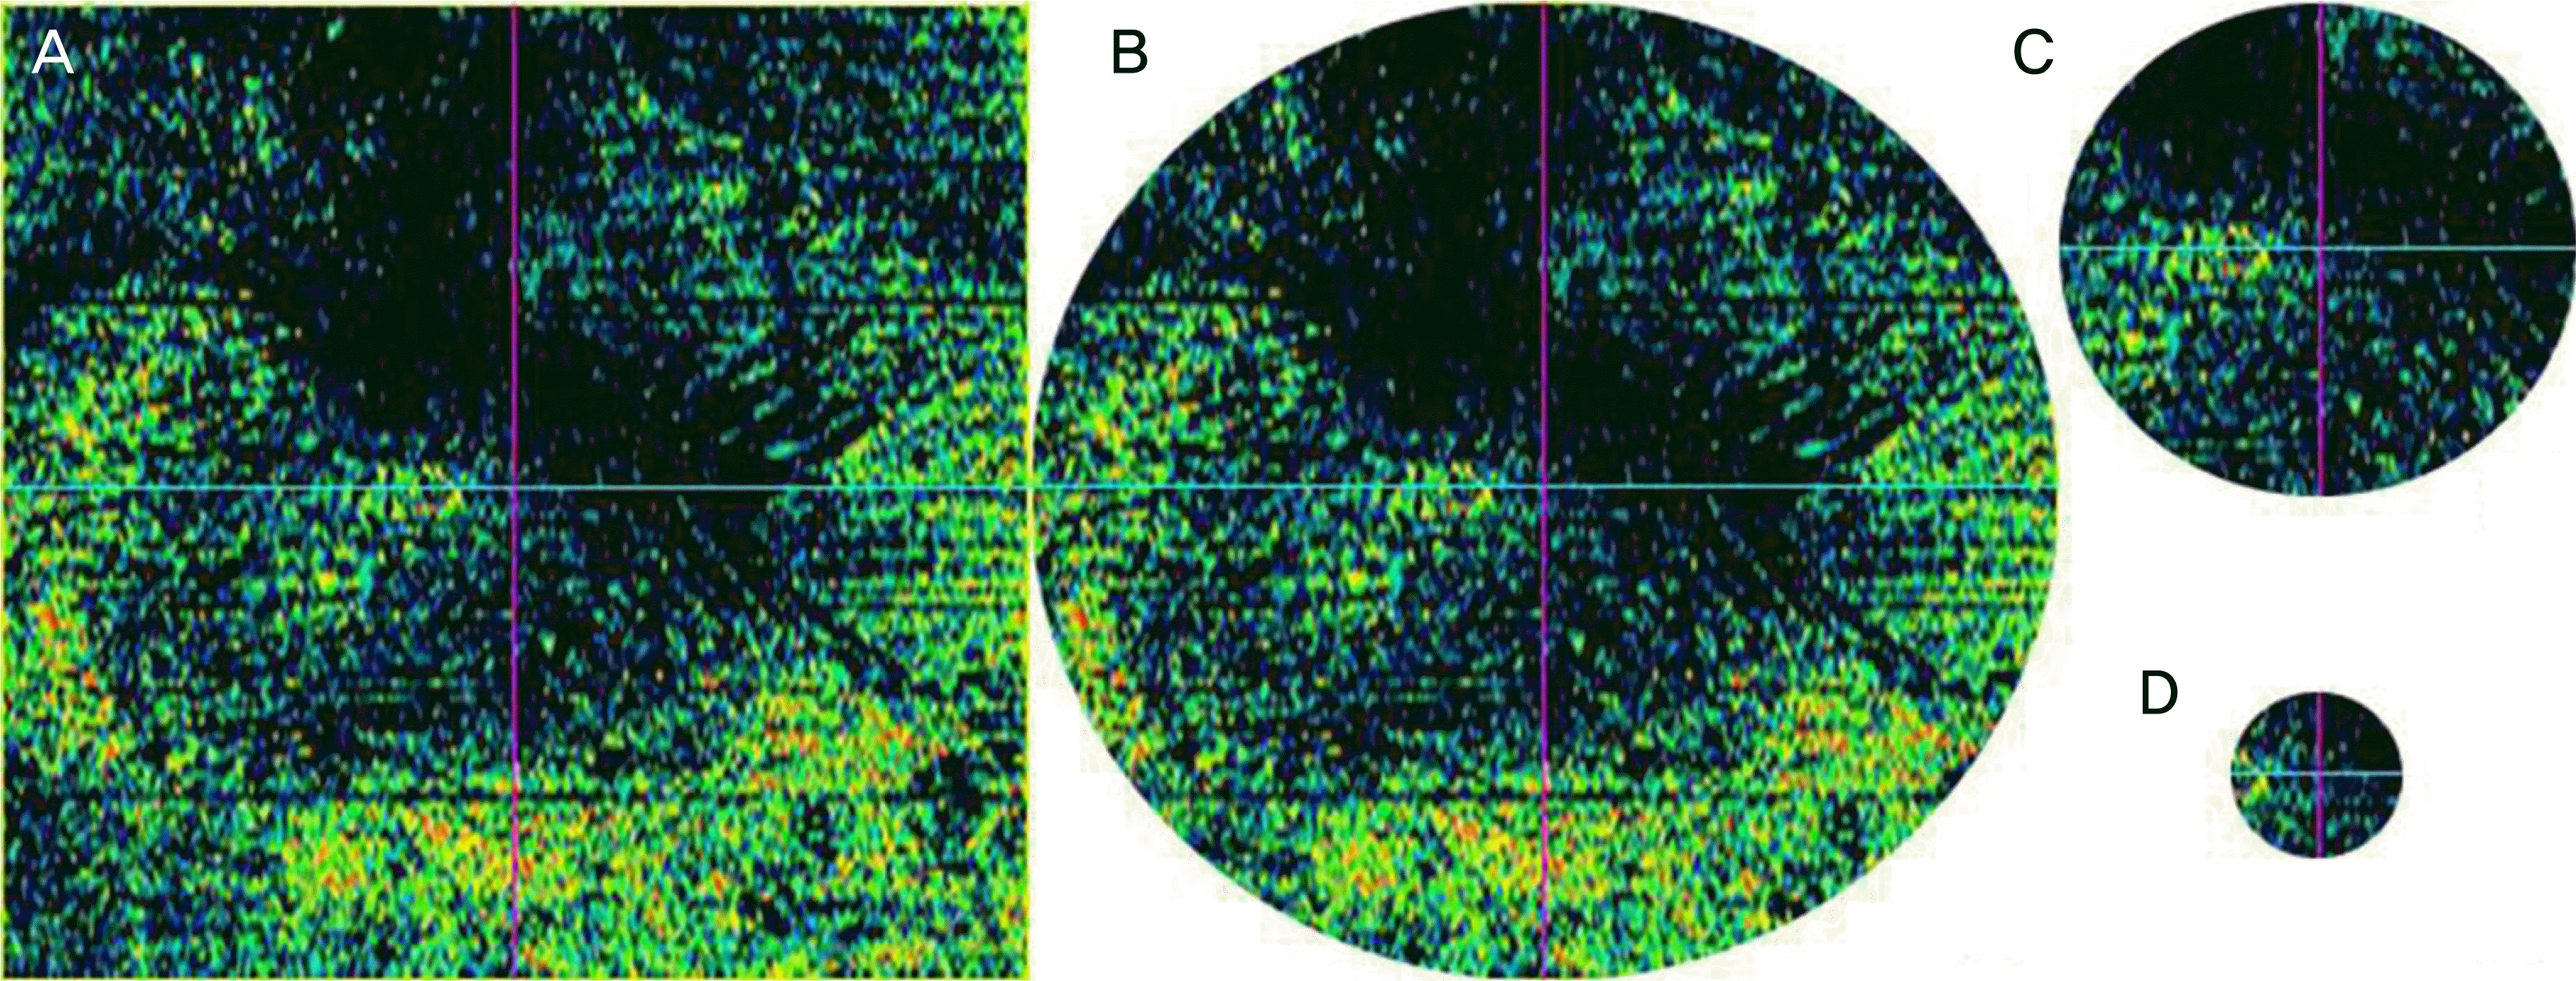
The medical records of 59 epiretinal membrane patients who had epiretinal membrane peeling between January 2005 and January 2016, and were followed up for > 12 months, were retrospectively reviewed. The preoperative en face images were divided into four sections involving three circular areas (6,000 μm diameter circle, 3,000 μm diameter circle, and 1,000 μm diameter circle) and one square (6,000 × 6,000 μm). The surface area where no epiretinal adhesion was present was quantified by measuring the number of black pixels using image-editing software (Adobe Photoshop CS6, Adobe Systems, San Jose, CA, USA). Then the correlations among the value of black pixels, preoperative and postoperative visual acuities, and central retinal thickness were analyzed.
Results
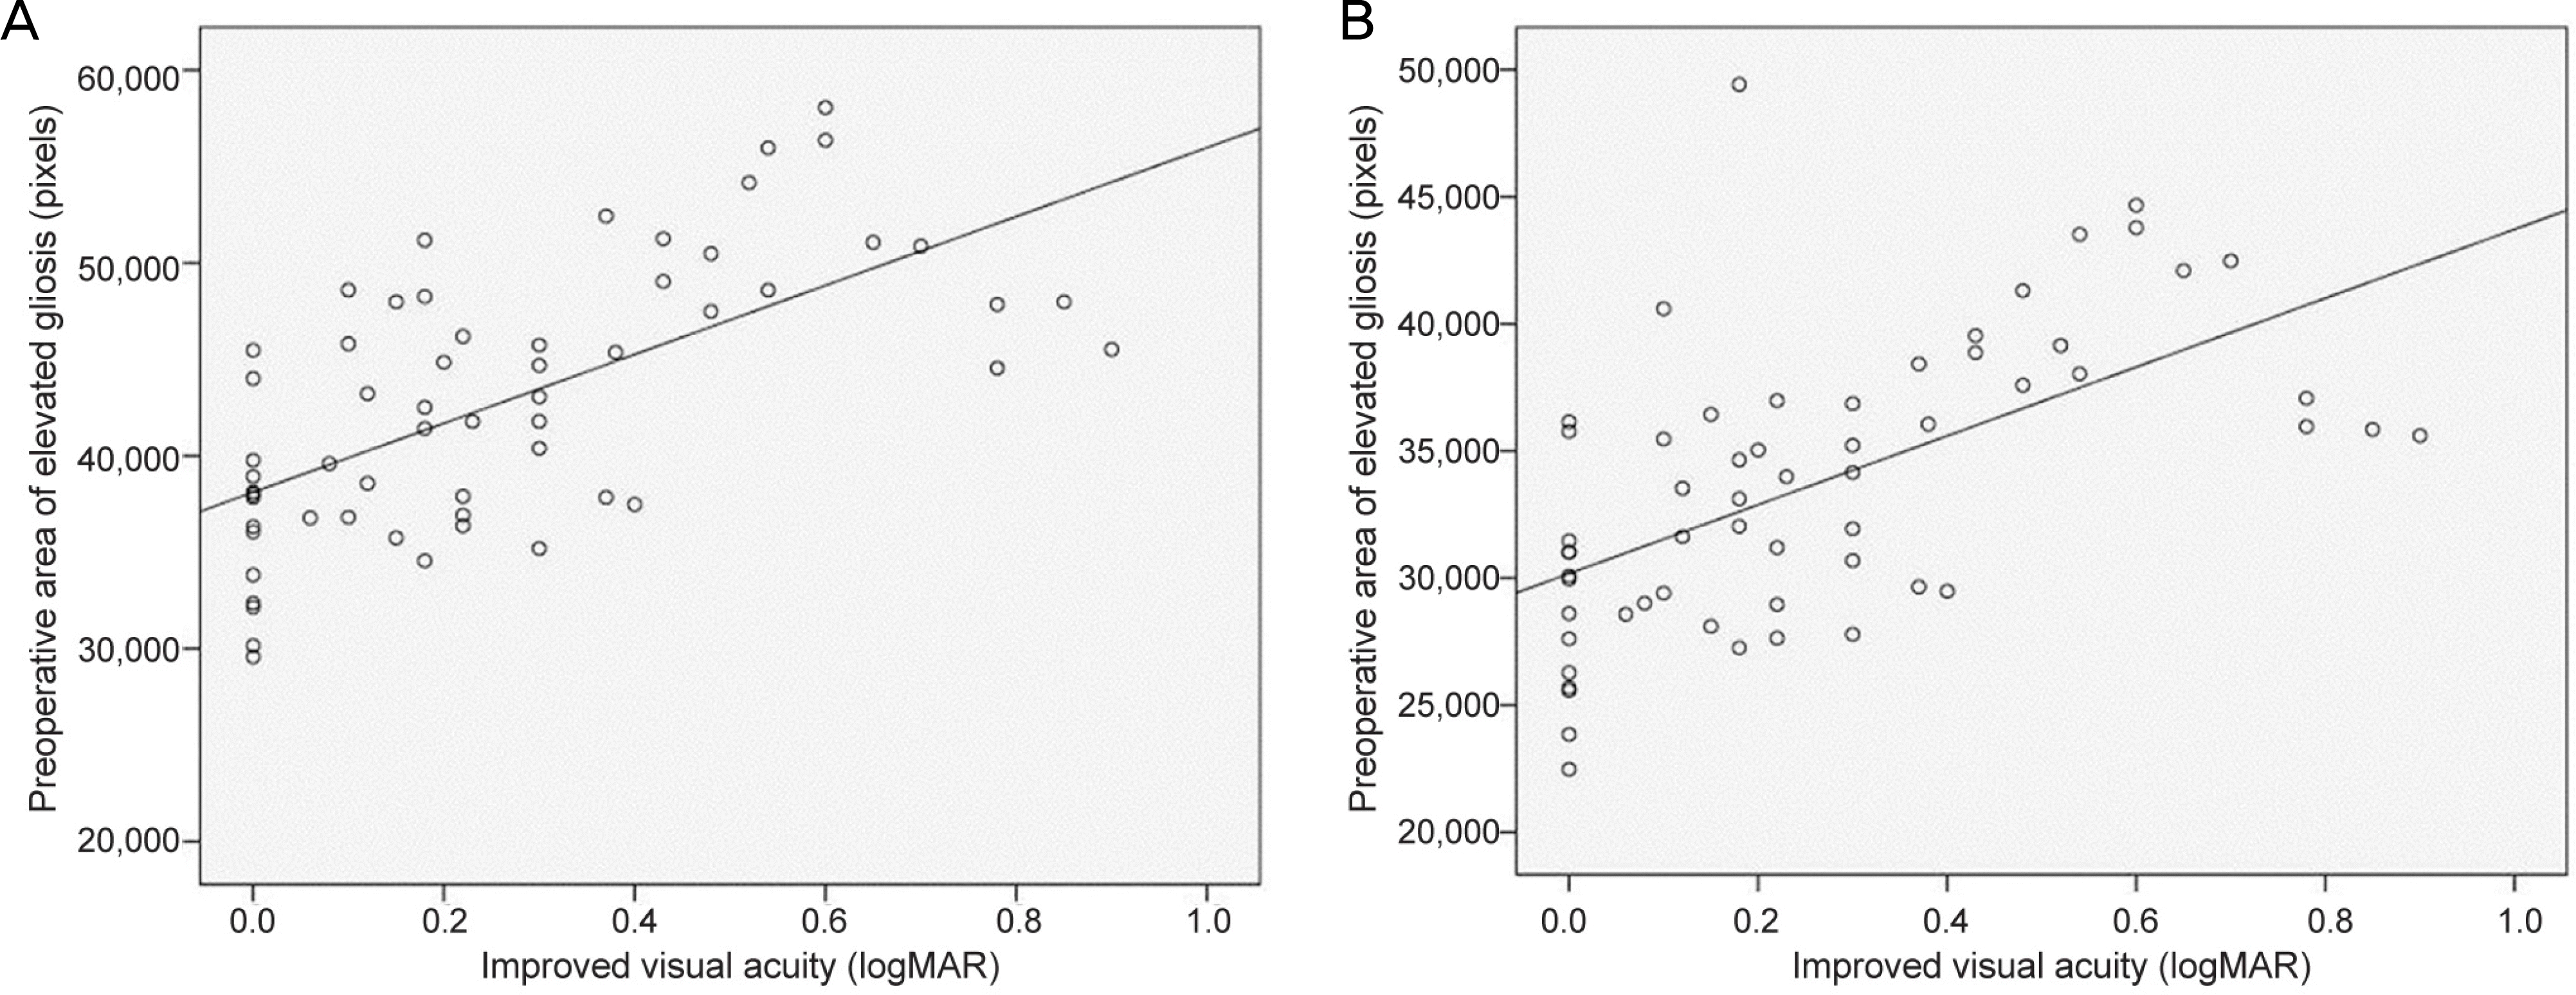
The best-corrected visual acuity (BCVA) was significantly increased after epiretinal membrane peeling (p < 0.001), and the central retinal thickness was significantly decreased (p < 0.001). As the number of black pixels in the circles and the square in the en-face images increased, the postoperative BCVA significantly increased (r = 0.645, p < 0.001; r = 0.590, p < 0.001, respectively).
REFERENCES
1). Koutsandrea CN, Apostolopoulos MN, Alonistiotis DA, et al. Indocyanine green-assisted epiretinal membrane peeling evaluated by optical coherence tomography and multifocal electroretinography. Clin Ophthalmol. 2007; 1:535–44.
2). Smiddy WE, Maguire AM, Green WR, et al. Idiopathic epiretinal membranes. Ultrastructural characteristics and clinicopathologic correlation. Ophthalmology. 1989; 96:811–20.
4). de Bustros S, Rice TA, Michels RG, et al. Vitrectomy for macular pucker: use after treatment of retinal tears or retinal detachment. Arch Ophthalmol. 1988; 106:758–60.
5). Ando F, Ohba N, Touura K, Hirose H. Anatomical and visual outcomes after episcleral macular buckling compared with those after pars plana vitrectomy for retinal detachment caused by macular hole in highly myopic eyes. Retina. 2007; 27:37–44.

6). McDonald HR, Verre WP, Aaberg TM. Surgical management of idiopathic epiretinal membranes. Ophthalmology. 1986; 93:978–83.

7). de Bustros S, Thompson JT, Michels RG, et al. Nuclear sclerosis after vitrectomy for idiopathic epiretinal membranes. Am J Ophthalmol. 1988; 105:160–4.

8). Margherio RR, Cox MS Jr, Trese MT, et al. Removal of epimacular membranes. Ophthalmology. 1985; 92:1075–83.

9). van Velthoven ME, Faber DJ, Verbraak FD, et al. Recent develoμments in optical coherence tomography for imaging the retina. Prog Retin Eye Res. 2007; 26:57–77.
10). Ko TH, Fujimoto JG, Schuman JS, et al. Comparison of ultrahigh- and standard-resolution optical coherence tomography for imaging macular pathology. Ophthalmology. 2005; 112:1922.e1-15.

11). Schmidt-Erfurth U, Leitgeb RA, Michels S, et al. Three-dimensional ultrahigh-resolution optical coherence tomography of macular diseases. Invest Ophthalmol Vis Sci. 2005; 46:3393–402.

12). Odrobina D, Michalewska Z, Michalewski J, et al. Long-term evaluation of vitreomacular traction disorder in spectral-domain optical coherence tomography. Retina. 2011; 31:324–31.

13). Kinoshita T, Kovacs KD, Wagley S, Arroyo JG. Morphologic differences in epiretinal membranes on ocular coherence tomography as a predictive factor for surgical outcome. Retina. 2011; 31:1692–8.

14). Falkner-Radler CI, Glittenberg C, Hagen S, et al. Spectral-domain optical coherence tomography for monitoring epiretinal membrane surgery. Ophthalmology. 2010; 117:798–805.

15). Kim J, Rhee KM, Woo SJ, et al. Long-term temporal changes of macular thickness and visual outcome after vitrectomy for idiopathic epiretinal membrane. Am J Ophthalmol. 2010; 150:701–9.e1.

16). Shiono A, Kogo J, Klose G, et al. Photoreceptor outer segment length: a prognostic factor for idiopathic epiretinal membrane surgery. Ophthalmology. 2013; 120:788–94.

17). Theodossiadis PG, Theodossiadis GP, Charonis A, et al. The photoreceptor layer as a prognostic factor for visual acuity in the secondary epiretinal membrane after retinal detachment surgery: imaging analysis by spectral-domain optical coherence tomography. Am J Ophthalmol. 2011; 151:973–80.

18). Seidel G, Weger M, Stadlmüller LG, et al. Association of preoperative optical coherence tomography markers with residual inner limiting membrane in epiretinal membrane peeling. PLoS One. 2013; 8:e66217.

19). Kim JS, Chhablani J, Chan CK, et al. Retinal adherence and fibrillary surface changes correlate with surgical difficulty of epiretinal membrane removal. Am J Ophthalmol. 2012; 153:692–7. 697.e1-2

20). Wilkins JR, Puliafito CA, Hee MR, et al. Characterization of epiretinal membrane using optical coherence tomography. Ophthalmology. 1996; 103:2142–51.
21). Pavlidis M, Georgalas I, Körber N. Determination of a new parameter, elevated epiretinal membrane, by En Face OCT as a prognostic factor for pars plana vitrectomy and safer epiretinal membrane peeling. J Ophthalmol. 2015; 2015:838646.

22). Kwon SI, Ko SJ, Park IW. The clinical course of the idiopathic epiretinal membrane after surgery. Korean J Ophthalmol. 2009; 23:249–52.

23). Suh MH, Seo JM, Park KH, Yu HG. Associations between macular findings by optical coherence tomography and visual outcomes after epiretinal membrane removal. Am J Ophthalmol. 2009; 147:473–80.e3.

24). Rice TA, de Bustros S, Michels RG, et al. Prognostic factors in vitrectomy for epiretinal membranes fo the macula. Ophthalmology. 1986; 93:602–10.
25). Pournaras CJ, Donati G, Brazitikos PD, et al. Macular epiretinal membranes. Semin Ophthalmol. 2000; 15:100–7.

26). Donati G, Kapetanios AD, Pournaras CJ. Complications of surgery for epiretinal membranes. Graefes Arch Clin Exp Ophthalmol. 1998; 236:739–46.

27). Ando A, Nishimura T, Uyama M. Surgical outome on combined procedures of lens extraction, intraocular lens implantation, and vitrectomy during removal of the epiretinal membrane. Ophthalmic Surg Lasers. 1998; 29:974–9.
Figure 1.
Four types of En Face optical coherence tomography (OCT) images. 6,000 × 6,000 qm square (A), 6,000 qm diameter circle (B), 3,000 qm diameter circle (C), and 1,000 qm diameter circle (D). The original En Face OCT image (A) was edited in three circles according to the early treatment diabetic retinopathy study subfields. Then we obtained the black pixel values of each of the images.

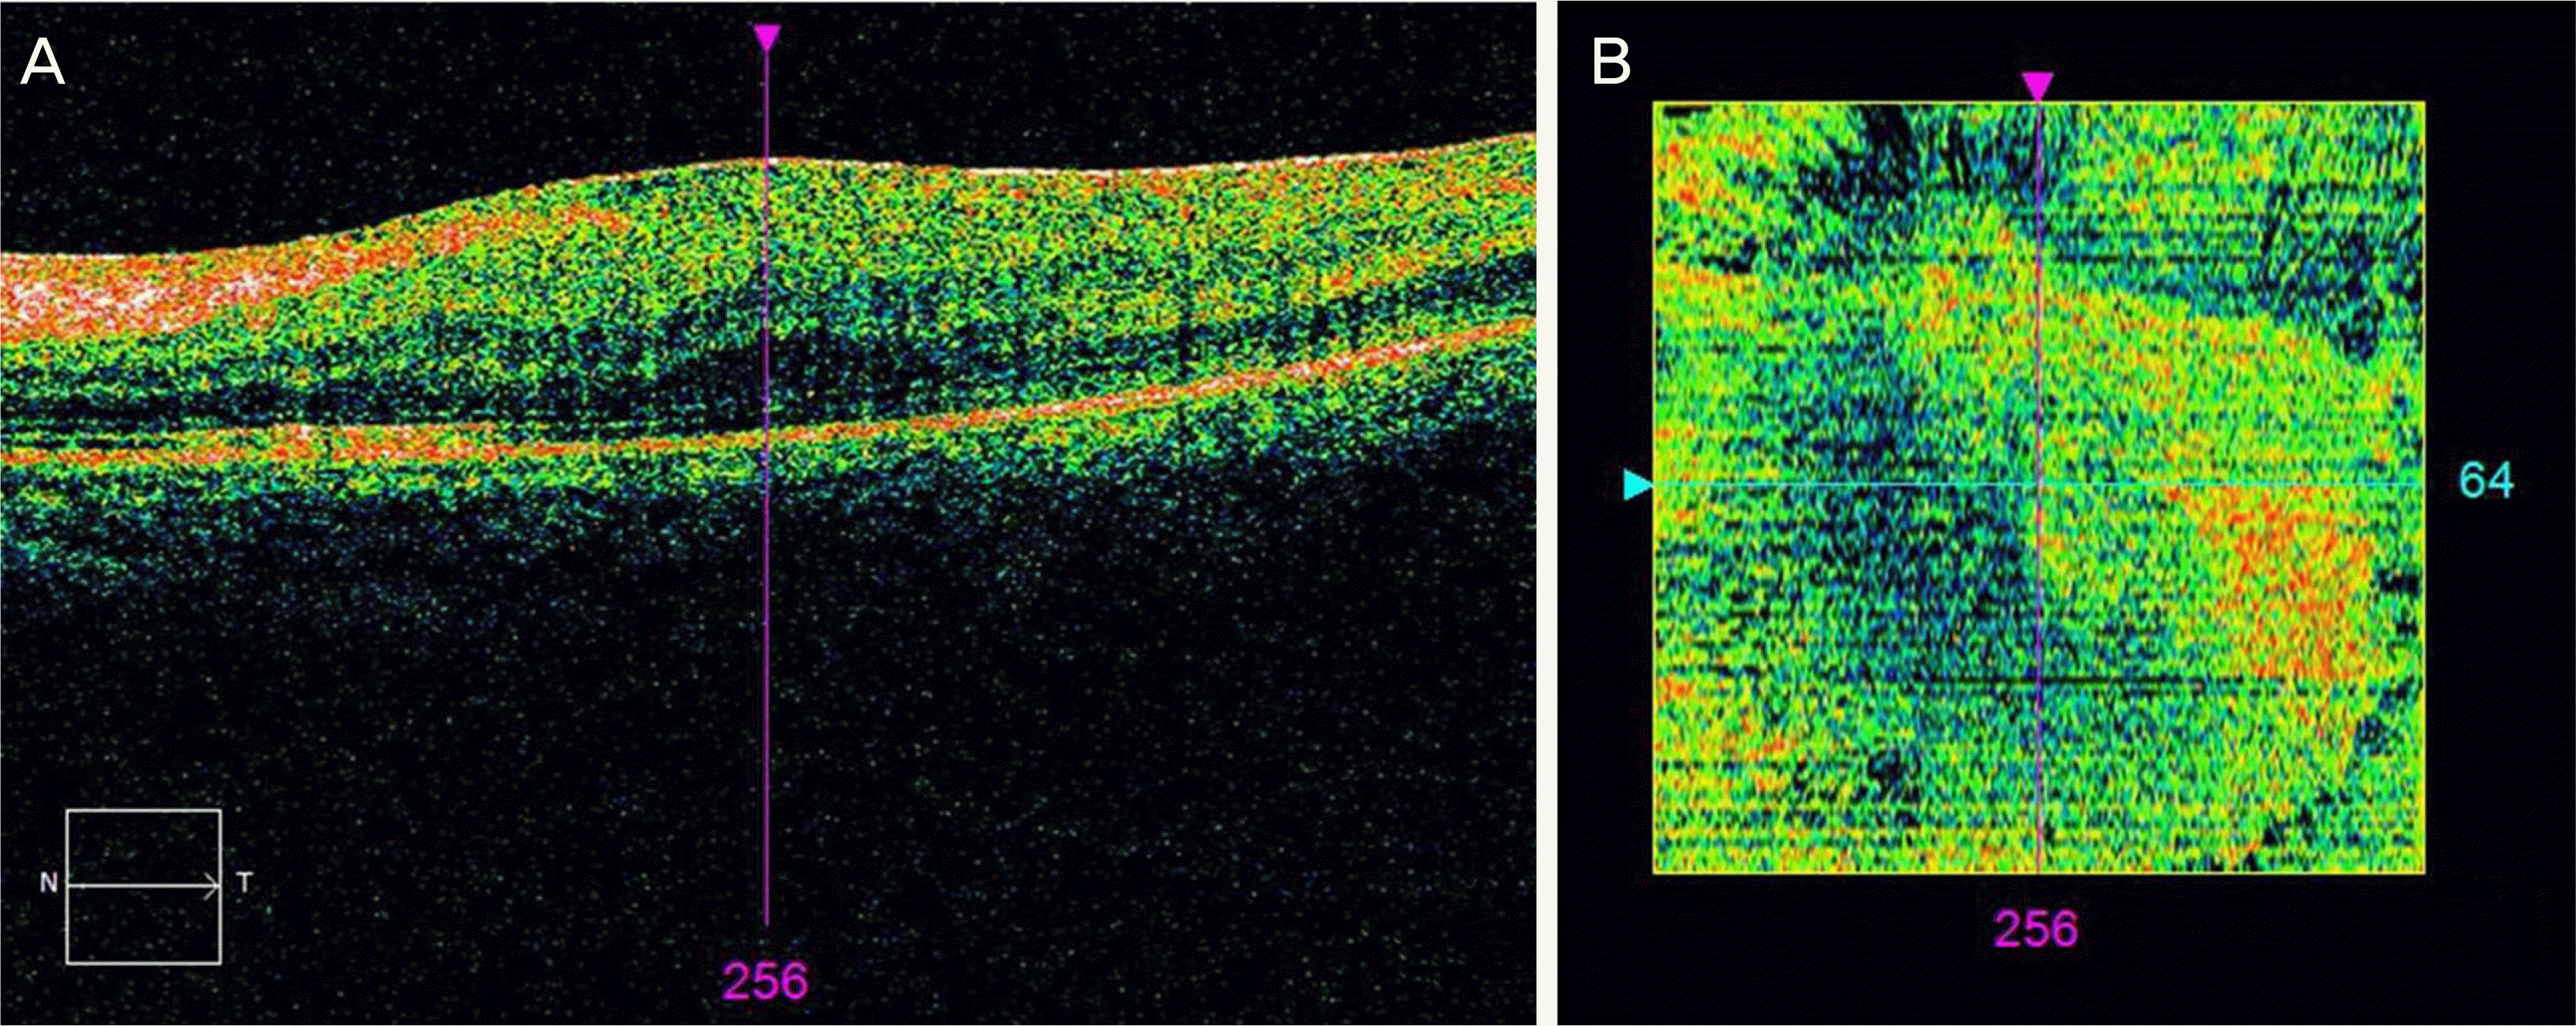
Figure 2.
Large area of elevated epiretinal membrane (ERM) peeling. Line scanning ophthalmoscope image (A) and En Face image (B). Black pixelated areas calculated automatically reveal elevated ERM in (B). It shows that the retina and the ERM have a wide area of contact in (A). And the larger the area of contact, the lower the black pixel value may be considered as shown as the narrow area of black color in (B).

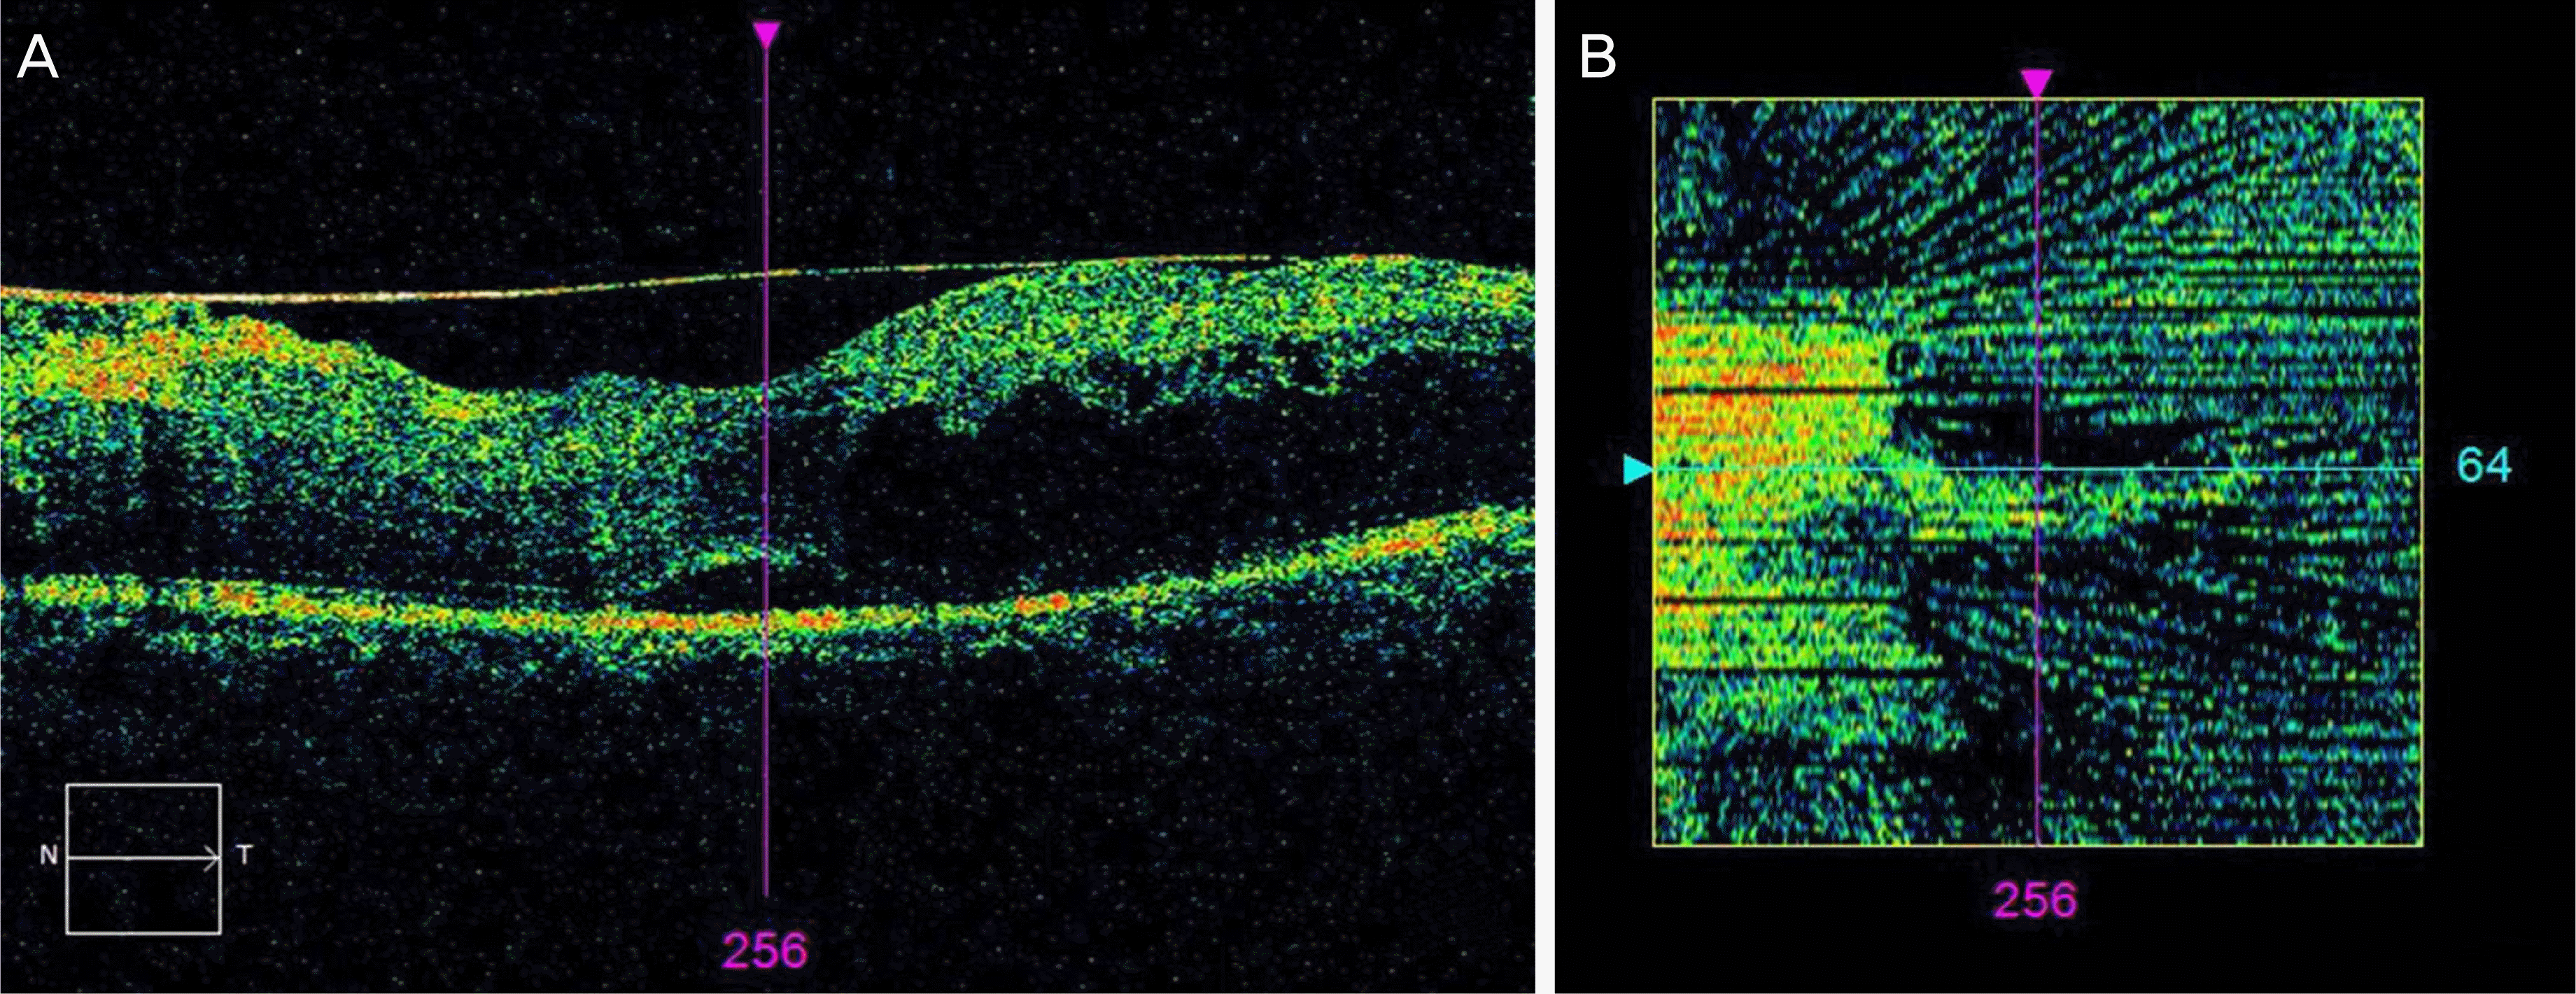
Figure 3.
Small area of elevated epiretinal membrane (ERM) peeling. Line scanning ophthalmoscope image (A), and En Face image (B). It shows that the retina and the ERM have a narrow are of contact in (A). And the narrower the area of contact, the greater the black pixel value may be considered as shown as the greater area of black color in (B).

Figure 4.
Scattergram showing the significant positive correlation between the change in best corrected visual acuity (BCVA) and preoperative epiretinal membrane area (pixels) with no retinal contact. (A) BCVA and 6,000 × 6,000 μm square (r = 0.645,p < 0.001), and (B) BCVA and 6,000 μm diameter circle (r = 0.590, p < 0.001).

Table 1.
Demographic characteristics and clinical features of the patients
| Characteristics | Value |
|---|---|
| Number of patients | 59 |
| Sex (male:female) | 27:32 |
| Age at surgery (years) | 64.8 ± 8.9 |
| Preoperative lens state (phakic:pseudophakic) | 36:23 |
| Types of operation (phacovitrectomy:vitrectomy) | 15:44 |
| BCVA (logMAR) (preoperative:postoperative) | 0.51 ± 0.29:0.24 ± 0.23* |
| BCVA change (logMAR) | 0.27 ± 0.24 |
Table 2.
Central retinal thickness after and before epiretinal membrane peeling (ERMP), and values of the black pixelated area on En Face images
| Variables | Value |
|---|---|
| CRT (μm) (preoperative:postoperative) | 468.97 ± 101.44:354.75 ± 63.20* |
| CRT chage (μm) | 113.53 ± 86.11 |
| 6,000 × 6,000 μm square (pixels) | 42,893.92 ± 6,826.66 |
| 6,000 μm diameter circle (pixles) | 33,799.24 ± 5,652.37 |
| 3,000 μm diameter circle (pixles) | 8,094.85 ± 1,958.61 |
| 1,000 μm diameter circle (pixles) | 861.90 ± 391.41 |
Table 3.
Correlation between the visual prognosis and values of the black pixelated area on En Face images
| Variables |
Preoperative BCVA |
Postoperative BCVA (12 months) |
BCVA change (12 months) |
|||
|---|---|---|---|---|---|---|
| r* | p-value | r* | p-value | r* | p-value | |
| 6,000 × 6,000 μm square pixels | 0.300 | 0.021† | −0.312 | 0.016† | 0.645 | <0.001† |
| 6,000 μm diameter circle pixels | 0.247 | 0.059 | −0.321 | 0.013† | 0.590 | <0.001† |
| 3,000 μm diameter circle pixels | 0.199 | 0.131 | −0.125 | 0.344 | 0.352 | 0.006† |
| 1,000 μm diameter circle pixels | 0.162 | 0.220 | 0.035 | 0.792 | 0.163 | 0.218 |
Table 4.
Correlation between the values of the black pixelated area on En Face images and the values of central retinal thickness (CRT) change
| Variables |
CRT change (12 months) |
|
|---|---|---|
| r* | p-value | |
| 6,000 × 6,000 μm square pixels | 0.055 | 0.680 |
| 6,000 μm diameter circle pixels | 0.042 | 0.758 |
| 3,000 μm diameter circle pixels | 0.081 | 0.540 |
| 1,000 μm diameter circle pixels | 0.040 | 0.764 |
Table 5.
Correlation between the visual prognosis and the values of the central retinal thickness (CRT)
| Variables |
Postoperative BCVA (12 months) |
BCVA change (12 months) |
||
|---|---|---|---|---|
| r* | p-value | r* | p-value | |
| Preoperative CRT | 0.360 | 0.005† | −0.026 | 0.843 |
| CRT change (12 months) | 0.286 | 0.028† | 0.179 | 0.174 |
| Preoperative BCVA | 0.580 | <0.001† | 0.663 | <0.001† |


 PDF
PDF ePub
ePub Citation
 Print
Print


 XML Download