

 PDF
PDF ePub
ePub Citation
 Print
Print


Abstract
Purpose
Methods
Results
Figures and Tables
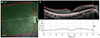 | Figure 1Measurement of posterior pole retinal volume. (A) 31 sections of macular transverse volume scan and 8 × 7.2 mm of calculated area (red box). (B) The area to be measured was set by correcting the borderline error of the cross - sectional area from the basement membrane to the internal limiting memebrane in the cross section of the retina. (C) The width of the retina set (B) is shown in a schematic diagram and the width of the set area was measured using the Image j program (displayed as a red line).
|
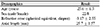
Table 2
Comparison of posterior pole retinal volume, central foveal thickness and retinal thickness measured by ETDRS circle with −6D of contact lens and +6D of contact lens to without any lens
Values are presented as mean ± SD unless otherwise indicated.
ETDRS = Early Treatment Diabetic Retinopathy Study; TMV = total macular volume measured by ETDRS circle; CSMT = central subfield macular thickness (1 mm).
*Repeated-measure and one way analysis of variance; †Statistically significant difference between +6D group and plano group with Bonferroni post hoc test (p < 0.05); ‡Statistically significant difference between plano group and −6D group with Bonferroni post hoc test (p < 0.05).
![]()
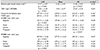
Table 3
Adjusted posterior pole retinal volume, central foveal thickness and retinal thickness measured by ETDRS circle with −6D of contact lens and +6D of contact lens to without any lens

Values are presented as mean ± SD unless otherwise indicated.
ETDRS = Early Treatment Diabetic Retinopathy Study; TMV = total macular volume measured by ETDRS circle.
*Multivariate analysis (repeated-measure design) with test-retest variability as the within subject variance component; †Statistically significant difference between +6D group and plano group with Bonferroni post hoc test (p < 0.05); ‡Statistically significant difference between plano group and −6D group with Bonferroni post hoc test (p < 0.05).
![]()
Notes
This paper is the result of research carried out with the funding of the 2017 Government (Future Creation Science Department) funded by the National Research Foundation of Korea (2017R1A2B4004664) and the research fund of the Kosin University College of Medicine Future Leading Research Project of 2016.
 XML Download