

 PDF
PDF ePub
ePub Citation
 Print
Print


Abstract
Purpose
Methods
Results
Conclusions
Figures and Tables
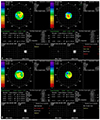 | Figure 1Images from topography. Change of high-order aberration, high-order aberrations were increased after three months from phacotrabeculectomy surgery (A, from 0.423 µm to 0.991 µm), and decreased after three months from phacoemulsification surgery (B, from 1.059 µm to 0.233 µm).
|
Table 1
Demographic and baseline characterics of subjects
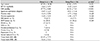
Values are presented as mean ± SD or n (%) unless otherwise indicated. ‘Group A’ means ‘phacotrabeuculectomy’, and ‘Group B’ means ‘phacoemulsification’.
BCVA = best corrected visual acuity; IOP = intraocular pressure; DM = diabetes mellitus; HTN = hypertension; POAG = primary open angle glaucoma; NTG = normal tension glaucoma; G = glaucoma; MD = mean deviation; PSD = pattern standard deviation; N/A = not applicable.
*p-value by independent T test between group A and group B for variables, in case of numeric, Chi-square applied.
![]()
Table 2
Changes of best corrected visual acuity (BCVA), spherical equivalents (SE) and intraocular pressure (IOP) between Group A and Group B
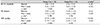
Values are presented as mean ± SD unless otherwise indicated. ‘Group A’ means ‘phacotrabeculectomy’, and ‘Group B’ means ‘phacoemulsification’.
*p-value by paired T test between baseline value and postoperative 2 weeks for each groups; †p-value by independent T test between group A and group B for variables.
![]()
Table 3
Calculation of postoperative corneal astigmatic changes (D) and postoperative corneal astigmatic changes (D) among each groups a long vertical meridian using the Cravy Method1112
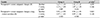
Values are presented as mean ± SD unless otherwise indicated. ‘Group A’ means ‘phacotrabeculectomy’, and ‘Group B’ means ‘phacoemulsification’.
D = diopters.
*p-value by paired T test between baseline value and postoperative 2 weeks for each groups; †p-value by independent T test between group A and group B for variables.
![]()
Table 4
Comparison of higher order aberrations depends on surgery and group
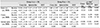
Values are presented as mean ± SD unless otherwise indicated. ‘Group A’ means ‘phacotrabeculectomy’, and ‘Group B’ means ‘phacoemulsification’.
Coma-like = the third-order Zernike coefficients (C3-3, C3-1, C31, C33); Spherical-like = the fourth-order Zernike coefficients (C4-4, C4-2, C40, C42, C44); HOT = higher order total: magnitude of the third to sixth-orders; RMS =root mean square.
*p-value by independent T test of HOAs between Group A and Group B (Coma-like, Spherical-like, Higher order total); †p-value by paired T test between baseline value and postoperative 2 weeks for each groups (Coma-like, Spherical-like, Higher order total).
![]()
Table 5
Comparison of higher order aberrations between preoperative and postoperative in phacotrabeculectomy
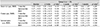
Values are presented as mean ± SD unless otherwise indicated. ‘Group A’ means ‘phacotrabeculectomy’.
Coma-like = the third-order Zernike coefficients (C3-3, C3-1, C31, C33); Spherical-like = the fourth-order Zernike coefficients (C4-4, C4-2, C40,C42, C44); HOT = higher order total: magnitude of the third to sixth-orders; RMS = root mean square.
*p-value by paired T test between baseline value and postoperative: 2 weeks; †p-value by paired T test between baseline value and postoperative: 1 month; ‡p-value by paired T test between baseline value and postoperative: 3 months.
![]()
 XML Download