

 PDF
PDF ePub
ePub Citation
 Print
Print


Abstract
Purpose
Methods
Results
Conclusions
Figures and Tables
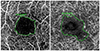 | Figure 1Manual drawing of the foveal avascular zone boundary using intrinsic measure area software. (A) Example of manual drawing of 3 × 3 mm optical coherence tomography angiogram in superficial capillary plexuses in a non-proliferative diabetic retinopathy (NPDR) patient. (B) Example of manual drawing of 3 × 3 mm optical coherence tomography angiogram in deep capillary plexuses in a NPDR patient.
|
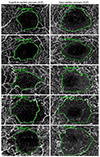 | Figure 2Manual drawing of the foveal avascular zone (FAZ) boundary. (A, B) FAZ of the SCP and DCP in no diabetic retinopathy patients. (C, D) FAZ of the SCP and DCP in mild non-proliferative diabetic retinopathy (NPDR) patients. (E, F) FAZ of the SCP and DCP in moderate NPDR patients. (G, H) FAZ of the SCP and DCP in severe NPDR patients. (I, J) FAZ of the SCP and DCP in proliferative diabetic retinopathy patients.
|
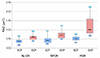 | Figure 3Comparison of fovea avascular zone (FAZ) area between non-proliferative diabetic retinopathy (NPDR) group and proliferative diabetic retinopathy (PDR) group. Boxplot showing the fovea avascular zone area in the superficial capillary plexuses (SCPs) and deep capillary plexuses (DCPs) in patients with no diabetic retinopathy (DR), NPDR and PDR.
|
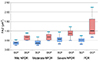 | Figure 4Comparison of fovea avascular zone (FAZ) area according to the severity of diabetic retinopathy (DR). Boxplot showing the fovea avascular zone area in the superficial capillary plexuses (SCPs) and deep capillary plexuses (DCPs) in patients with mild, moderate, severe non-proliferative diabetic retinopathy (NPDR) and proliferative diabetic retinopathy (PDR).
|
Table 1
Baseline characteristics of all patients
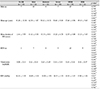
Values are presented as mean ± SD or n (%) unless otherwise indicated.
DR = diabetic retinopathy; NPDR = non-proliferative diabetic retinopathy; PDR = proliferative diabetic retinopathy; DM = diabetes mellitus; HTN = hypertension; IOP = intraocular pressure.
*Mann-Whitney U-test: Mean age, Mean duration of DM, Chi-square test: Male, HTN; †Comparison between No DR and NPDR group; ‡Comparison between No DR and PDR group; §Comparison between NPDR and PDR group; ΠComparison between mild NPDR and moderate NPDR group; #Comparison between mild NPDR and severe NPDR group; **Comparison between moderate NPDR and severe NPDR group.
![]()
Table 2
Comparison of FAZ area by severity of DR
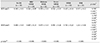
Values are presented as mean ± SD or n (%) unless otherwise indicated.
FAZ = fovea avascular zone; DR = diabetic retinopathy; NPDR = non-proliferative diabetic retinopathy; PDR = proliferative diabetic retinopathy; SCP = superficial capillary plexus; DCP = deep capillary plexus.
*Mann-Whitney U-test; †Comparison between No DR and NPDR group; ‡Comparison between No DR and PDR group; §Comparison between NPDR and PDR group; ΠComparison between mild NPDR and moderate NPDR group; #Comparison between mild NPDR and severe NPDR group; **Comparison between moderate NPDR and severe NPDR group; ††Comparison between severe NPDR group and PDR group; ‡‡Wilcoxon signed rank test.
![]()
 XML Download