Abstract
Purpose
To compare the measurement results and the accuracy of the predicted refractive error after cataract surgery among 3 ocular biometry devices; OA-2000®, IOL Master® and A-scan ultrasound in posterior subscapular cataracts.
Methods
Biometry measurements including axial length, anterior chamber depth and the keratometry of 80 cataractous eyes were measured using ultrasonography, OA-2000® and IOL Master®. To calculate the intraocular lens (IOL) power, the SRK/T for-mula was used and 3 months after cataract surgery, the refractive outcome was compared to the preoperatively predicted re-fractive error.
Results
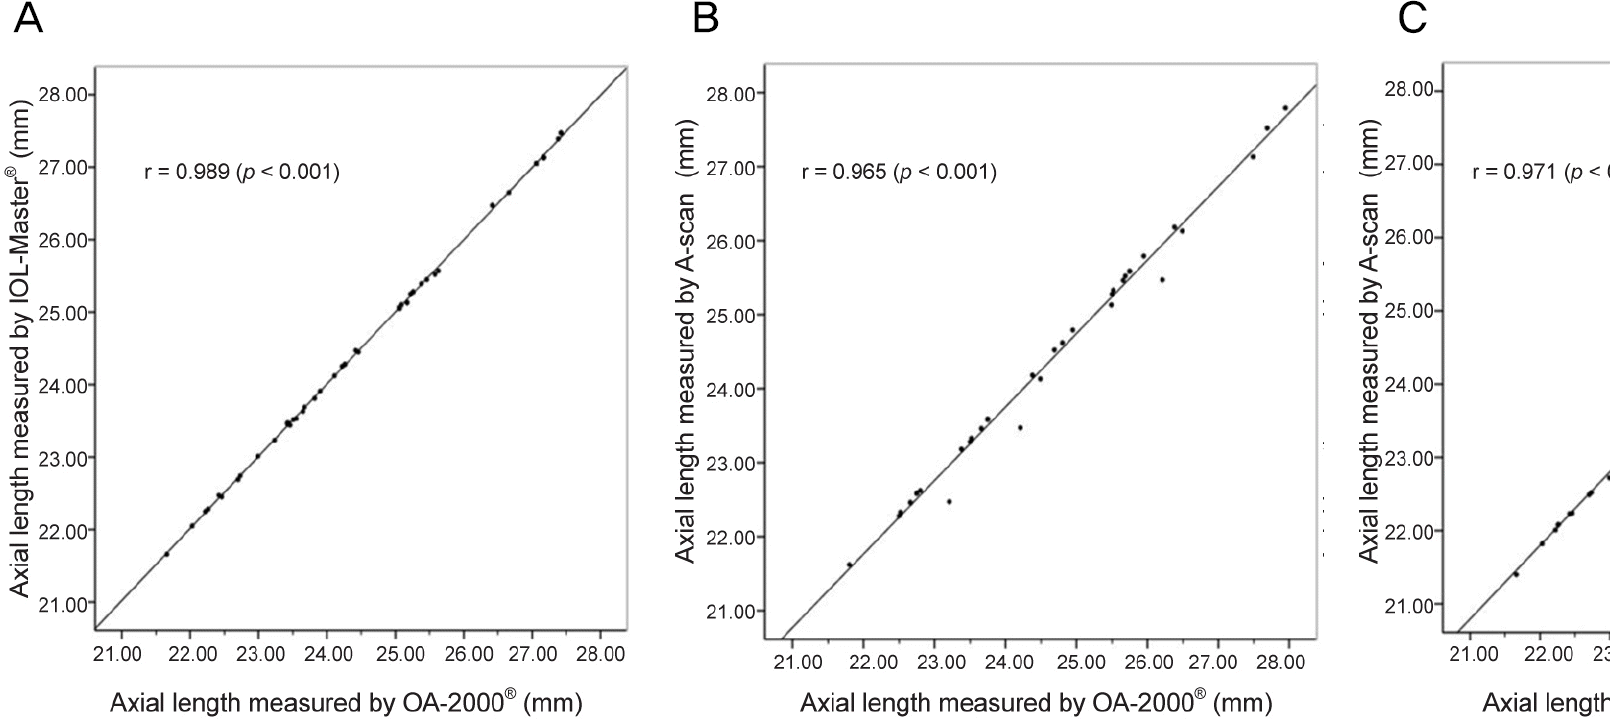
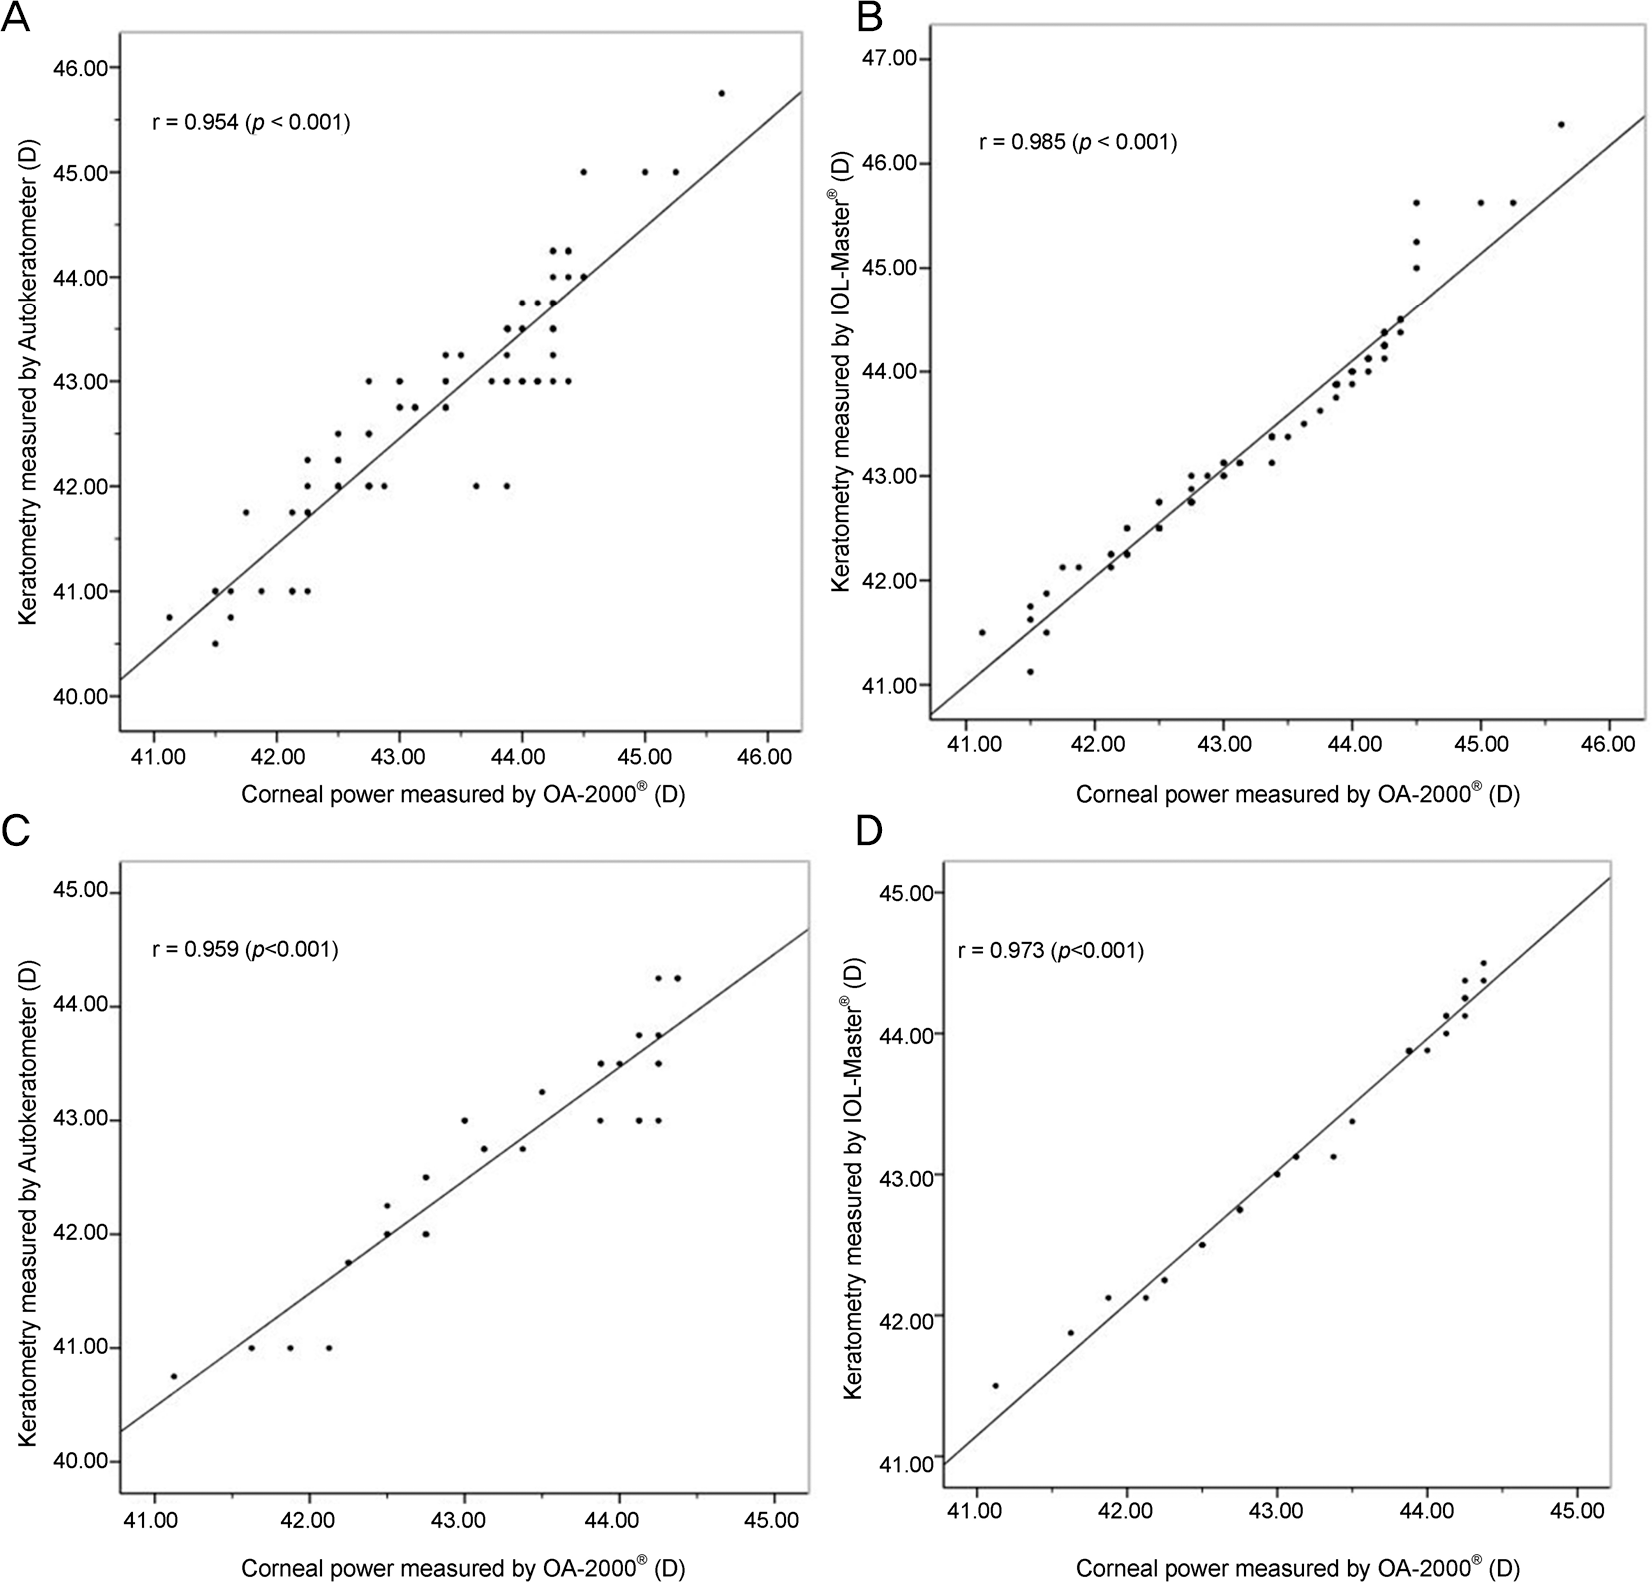
The number of eyes measured by the 3 devices (A-scan, IOL Master® and OA-2000®) was 57 (group A) and the number of eyes measured by 2 devices (A-scan and OA-2000®) was 22 (group B). When cataract grading was performed based on the Lens Opacity Classification system Ⅲ, the severity of posterior subscapular opacity was significantly different between the 2 groups ( p = 0.001). Although no difference was observed in the measured biometry values including axial length, anterior cham-ber depth and keratometry in groups A and B, the predicted refractive error was significantly different in group B; OA-2000® showed a significantly higher accuracy in predicting IOL power than A-scan.
Conclusions
In cataract patients whose posterior subscapular opacity is not severe, the accuracy for predicting refractive error after cataract surgery was not significantly different among the 3 devices included in our study (A-scan, IOL Master® and OA-2000®). However, in patients with severe posterior subscapular opacity, OA-2000®, that provides a Fourier domain light source-calculated predicted refractive error of IOL may be more accurate.
References
1. Drexler W, Findl O, Menapace R, et al. Partial coherence inter-ferometry: a novel approach to biometry in cataract surgery. Am J Ophthalmol. 1961; 66:111–24.

2. Haigis W, Lege B, Miller N, Schneider B. Comparison of im-mersion ultrasound biometry and partial coherence interferometry for intraocular lens calculation according to Haigis. Graefes Arch Clin Exp Ophthalmol. 1961; 66:111–24.

3. Lam AK, Chan R, Pang PC. The repeatability and accuracy of axial length and anterior chamber depth measurements from the IOLMaster. Ophthalmic Physiol Opt. 1961; 66:111–24.
4. Wylę gał a E, Teper S, Nowiń ska AK, et al. Anterior segment imag-ing: Fourier-domain optical coherence tomography versus time-domain optical coherence tomography. J Cataract Refract Surg. 1961; 66:111–24.
5. Tang M, Wang L, Koch DD, et al. Intraocular lens power calcu-lation after previous myopic laser vision correction based on cor-neal power measured by Fourier-domain optical coherence tomography. J Cataract Refract Surg. 1961; 66:111–24.

6. Moon JS, Shin JA, Bae GH, Chung SK. Comparison of biometric measurements and refractive results between applanation ultra-sonography and three different interferometries. J Korean Ophthalmol Soc. 1961; 66:111–24.

7. Chylack LT, Wolfe JK, Singer DM, et al. The lens opacities classi-fication system III. The Longitudinal Study of Cataract Study Group. Arch Ophthalmol. 1961; 66:111–24.
8. Retzlaff JA, Sanders DR, Kraff MC. Development of the SRK/T intraocular lens implant power calculation formula. J Cataract Refract Surg. 1961; 66:111–24.

9. Srivannaboon S, Chirapapaisan C, Chonpimai P, Loket S. Clinical comparison of a new swept-source optical coherence tomog-raphy-based optical biometer and a time-domain optical coherence tomography-based optical biometer. J Cataract Refract Surg. 1961; 66:111–24.

10. Telenkov SA, Mandelis A. Fourier-domain biophotoacoustic sub-surface depth selective amplitude and phase imaging of turbid phantoms and biological tissue. J Biomed Opt. 2006; 11:044006.

11. Povazay B, Hermann B, Unterhuber A, et al. Three-dimensional optical coherence tomography at 1050 nm versus 800 nm in retinal pathologies: enhanced performance and choroidal penetration in cataract patients. J Biomed Opt. 2007; 12:041211.
12. Grulkowski I, Liu JJ, Zhang JY, et al. Reproducibility of a long-range swept-source optical coherence tomography ocular biometry system and comparison with clinical biometers. Ophthalmology. 1961; 66:111–24.

13. Grajciar B, Pircher M, Hitzenberger CK, et al. High sensitive measurement of the human axial eye length in vivo with Fourier domain low coherence interferometry. Opt Express. 2008; 16:2405–14.

14. McAlinden C, Wang Q, Pesudovs K, et al. Axial length measure-ment failure rates with the IOLMaster and Lenstar LS 900 in eyes with cataract. PLoS One. 2015; 10:e0128929.

15. Kim SI, Kang SJ, Oh TH, et al. Accuracy of ocular biometry and postoperative refraction in cataract patients with AL-Scan(R). J Korean Ophthalmol Soc. 1961; 66:111–24.
16. Shin JW, Seong M, Kang MH, et al. Comparison of ocular bio-metry and postoperative refraction in cataract patients between Lenstar(R) and IOL Master(R). J Korean Ophthalmol Soc. 1961; 66:111–24.
17. Hoffer KJ, Shammas HJ, Savini G. Comparison of 2 laser instru-ments for measuring axial length. J Cataract Refract Surg. 1961; 66:111–24.

18. Stattin M, Zehetner C, Bechrakis NE, Speicher L. Comparison of IOL-Master 500 vs. Lenstar LS900 concerning the calculation of target refraction: A retrospective analysis. Ophthalmologe. 2015; 112:444–50.
Table 1.
Comparison of lens opacity between group A and B
| A group (n = 57) | B group (n = 23) | p-value* | |
|---|---|---|---|
| Cataract grade of LOCS Ⅲ | |||
| Cortical | 3.4 ± 1.8 | 2.0 ± 1.7 | 0.150 |
| Nuclear | 3.1 ± 0.9 | 2.8 ± 0.8 | 0.546 |
| Posterior subcapsular | 1.1 ± 1.6 | 4.3 ± 1.0 | 0.001 |
Table 2.
Comparison of axial length, anterior chamber depth and keratometry data measured by OA-2000®, IOL Master®, A-scan and automated keratometry
| OA-2000® | IOL Master® | A-scan | Automated keratometry | p-value | |
|---|---|---|---|---|---|
| Group A (n = 57) | |||||
| Axial length (mm) | 24.05 ± 0.61 | 24.01 ± 0.64 | 23.99 ± 0.62 | - | 0.823* |
| Keratometry (D) | |||||
| K1 | 44.0 ± 0.6 | 43.9 ± 0.8 | - | 44.0 ± 0.7 | 0.995* |
| K2 | 44.3 ± 0.6 | 44.6 ± 0.6 | - | 44.4 ± 0.8 | 0.842* |
| ACD | 3.6 ± 0.4 | 3.9 ± 0.7 | 3.6 ± 0.6 | - | 0.522* |
| Group B (n = 23) | |||||
| Axial length (mm) | 24.28 ± 1.34 | - | 24.19 ± 1.01 | 0.838† | |
| Keratometry (D) | |||||
| K1 | 43.2 ± 0.8 | - | - | 43.1 ± 0.9 | 0.874† |
| K2 | 44.5 ± 0.7 | - | - | 44.2 ± 0.8 | 0.677† |
| ACD | 3.4 ± 0.3 | - | 3.5 ± 0.3 | - | 0.326† |
Table 3.
Comparison of PE at 3 month post-operation among OA-2000®, IOL Master® and A-scan
| OA-2000® | IOL Master® | A-scan | p-value | |
|---|---|---|---|---|
| Group A (n = 57) | ||||
| PE (D) | 0.19 ± 0.30 | -0.20 ± 0.53 | 0.25 ± 0.76 | 0.541* |
| Range (D) | -0.60~0.72 | -0.80~0.75 | -1.25~1.00 | |
| Eyes within (%) | ||||
| ±0.25 D | 46 | 48 | 40 | |
| ±0.5 D | 81 | 76 | 78 | |
| ±1.0 D | 96 | 95 | 95 | |
| ±1.5 D | 100 | 100 | 100 | |
| Group B (n = 23) | ||||
| PE (D) | 0.00 ± 0.26 | - | 0.50 ± 0.88 | 0.039† |
| Range (D) | -0.58~0.41 | - | -1.30~1.23 | |
| Eyes within (%) | ||||
| ±0.25 D | 43 | - | 35 | |
| ±0.5 D | 83 | - | 78 | |
| ±1.0 D | 96 | - | 96 | |
| ±1.5 D | 100 | - | 100 | |
Figure 1.
Correlation of measured axial length value between OA-2000® and other devices (Pearson correlation analysis). Axial length measured by OA-2000® and IOL-Master® in Group A (A) OA-2000® and A-scan in Group A (B) OA-2000® and A-scan in Group B (C).

Figure 2.
Correlation of measured keratometry power between OA-2000® and other devices (Pearson correlation analysis). Corneal power measured by OA-2000® and autokeratometer in Group A (A) OA-2000® and IOL-Master® in Group A (B) OA-2000® and au-tokeratometer in Group B (C) OA-2000® and IOL-Master® in Group B (D).


 PDF
PDF ePub
ePub Citation
 Print
Print


 XML Download