

 PDF
PDF ePub
ePub Citation
 Print
Print


Abstract
Purpose
Methods
Results
References
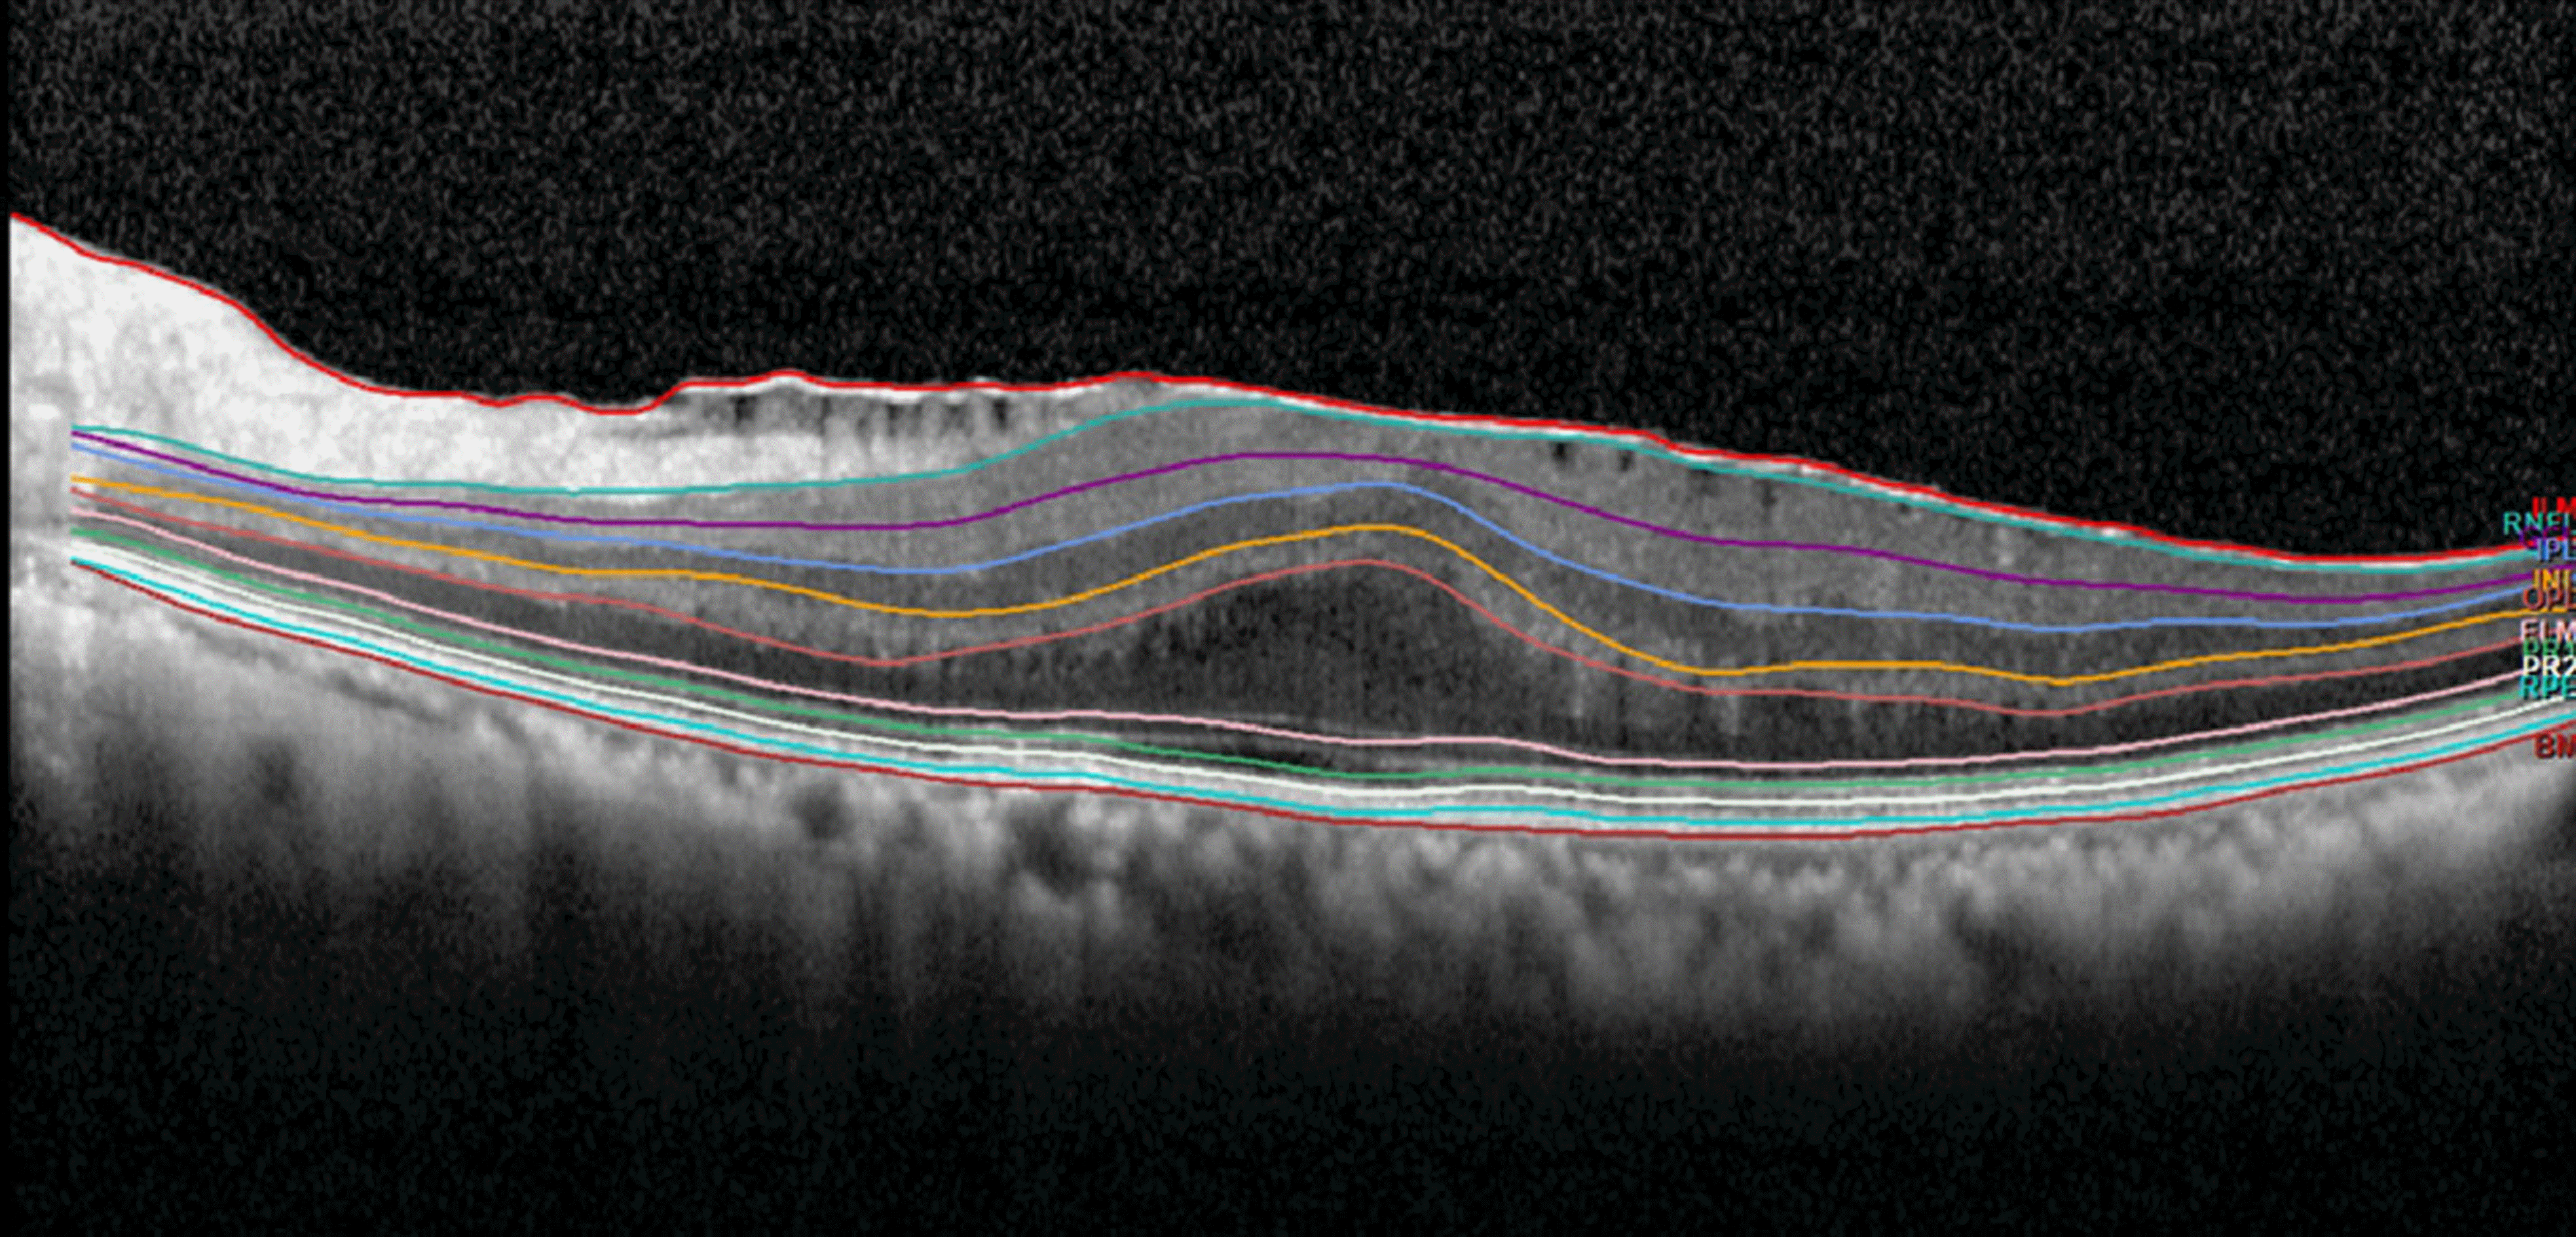 | Figure 1.Representative image of retinal layer division determined by the new segmentation application of the spectralis optical coherence tomography in epiretinal membrane (Segmentation Technology; Heidelberg Engineering, Inc., Heidelberg, Germany). 10 layers: 1 = inner limiting membrane, 2 = retinal nerve fiber layer, 3 = ganglion cell layer, 4 = inner plexiform layer, 5 = inner nuclear layer, 6 = outer plexiform layer, 7 = external limiting membrane, 8 = photoreceptor, 9 = retinal pigment epithelium, 10 = Bruch's membrane. |
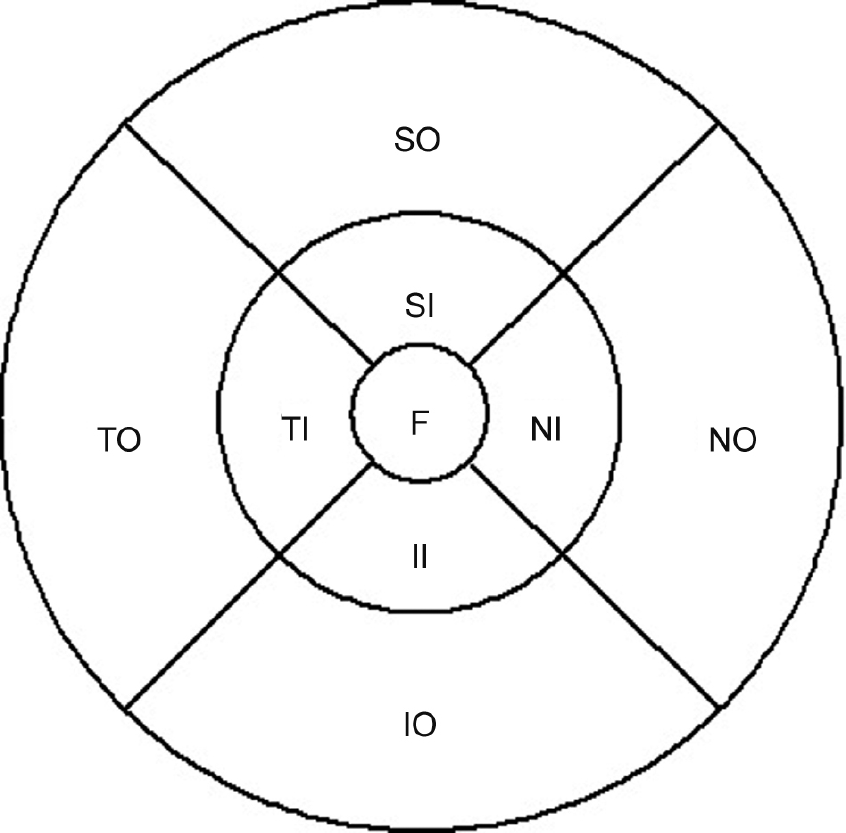 | Figure 2.Early Treatment of Diabetic Retinopathy Study (ETDRS) subfield. Central circle: fovea (F). Inner ring: superior inner (SI) + nasal inner (NI) + inferior inner (II) + temporal inner (TI). Outer ring: superior outer (SO) + nasal outer (NO) + inferior outer (IO) + temporal outer (TO). ETDRS subfields within standard 1-, 3-, and 6-mm-diameter concentric circles at the right used for reporting retinal thickness. |
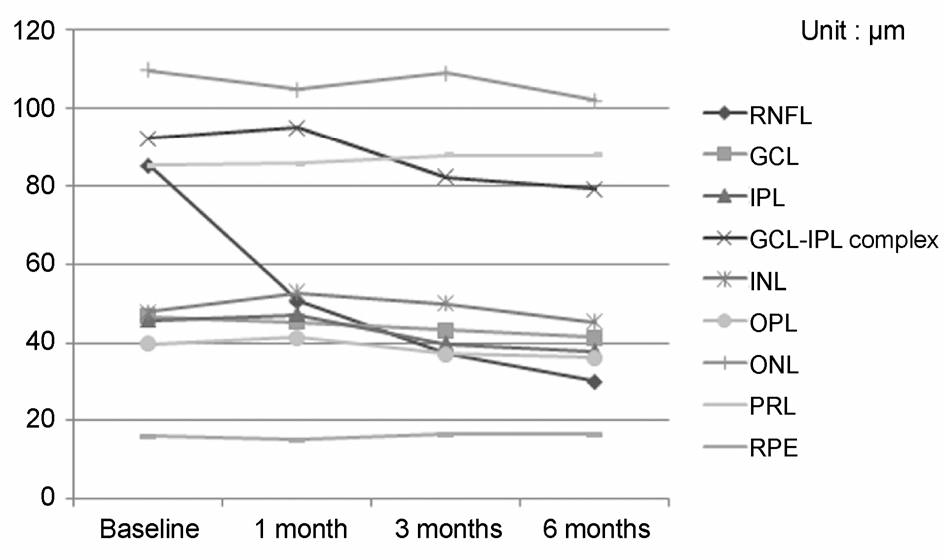 | Figure 3.Longitudinal changes of the average foveal thick-ness of each retinal layer before and after epiretinal membrane surgery. RNFL =retinal nerve fiber layer; GCL =ganglion cell layer; IPL =inner plexiform layer; INL =inner nuclear layer; OPL =outer plexiform layer; ONL =outer nuclear lay-er; PRL = photoreceptor; RPE = retinal pigment epithelium. |
Table 1.
| Characteristics | Value |
|---|---|
| Patients | 46 |
| Gender (male:female) | 24:22 |
| Age (years) | 68.30 ± 11.13 |
| Preoperative lens state (phakic:pseudophakic) | 16:30 |
| Phacovitrectomy: Vitrectomy | 16:30 |
| BCVA (logMAR) (preoperative:postoperative) | 0.49 ± 0.36:0.26 ± 0.22* |
| Complications and recurrence | 0 |
Table 2.
| Variables | Preop | CE | p-value* | Postop (6 months) | p-value* |
|---|---|---|---|---|---|
| Fovea (μ m) | 485.83 ± 86.30 | 274.03 ± 39.75 | <0.001 | 389.90 ± 54.15 | <0.001 |
| Inner ring (μ m) | 431.48 ± 59.72 | 330.44 ± 21.57 | <0.001 | 363.74 ± 33.07 | <0.001 |
| Outer ring (μ m) | 367.13 ± 42.45 | 307.27 ± 21.02 | <0.001 | 318.78 ± 24.62 | <0.001 |
Table 3.
| Variables | ERM (Preop) | CE | p-value* | Postop (6 months) | p-value* | |
|---|---|---|---|---|---|---|
| RNFL (μ m) | Fovea | 85.23 ± 61.84 | 12.13 ± 2.52 | <0.001 | 30.10 ± 30.17 | <0.001 |
| IR | 82.98 ± 43.84 | 27.00 ± 3.45 | <0.001 | 37.31 ± 21.91 | <0.001 | |
| OR | 67.94 ± 31.53 | 41.26 ± 2.52 | <0.001 | 42.63 ± 13.35 | <0.001 | |
| GCL (μ m) | Fovea | 46.60 ± 12.00 | 19.76 ± 14.39 | <0.001 | 41.43 ± 10.21 | 0.048 |
| IR | 55.96 ± 9.36 | 52.68 ± 8.64 | 0.044 | 50.74 ± 8.73 | 0.017 | |
| OR | 41.90 ± 5.18 | 37.55 ± 3.77 | 0.024 | 35.15 ± 6.66 | <0.001 | |
| IPL (μ m) | Fovea | 45.70 ± 10.75 | 25.23 ± 10.78 | <0.001 | 37.86 ± 9.60 | 0.009 |
| IR | 50.85 ± 4.97 | 42.55 ± 5.68 | 0.002 | 41.72 ± 4.79 | <0.001 | |
| OR | 38.49 ± 6.49 | 34.33 ± 4.30 | <0.001 | 29.96 ± 4.82 | <0.001 | |
| GCL-IPL complex | (μ m) Fovea | 92.30 ± 20.91 | 43.76 ± 21.50 | <0.001 | 79.30 ± 18.30 | 0.014 |
| IR | 106.72 ± 13.20 | 97.87 ± 11.38 | 0.009 | 92.43 ± 12.78 | <0.001 | |
| OR | 80.36 ± 10.19 | 74.65 ± 6.42 | 0.011 | 65.08 ± 11.21 | <0.001 | |
| INL (μ m) | Fovea | 47.93 ± 11.76 | 23.30 ± 9.61 | <0.001 | 45.23 ± 11.72 | 0.399 |
| IR | 48.62 ± 4.72 | 38.40 ± 3.51 | <0.001 | 47.46 ± 6.08 | 0.934 | |
| OR | 43.17 ± 4.66 | 34.89 ± 3.79 | <0.001 | 39.77 ± 5.15 | <0.001 | |
| OPL (μ m) | Fovea | 39.66 ± 8.58 | 26.36 ± 7.84 | <0.001 | 36.23 ± 8.29 | 0.041 |
| IR | 37.39 ± 4.35 | 34.44 ± 4.49 | 0.011 | 35.09 ± 3.90 | 0.045 | |
| OR | 32.94 ± 4.36 | 30.46 ± 5.80 | 0.013 | 29.49 ± 2.15 | <0.001 | |
| ONL (μ m) | Fovea | 109.73 ± 30.10 | 85.93 ± 15.45 | 0.001 | 102.10 ± 21.11 | 0.727 |
| IR | 73.50 ± 11.93 | 64.44 ± 8.70 | 0.001 | 70.77 ± 11.88 | 0.162 | |
| OR | 64.17 ± 11.10 | 55.40 ± 8.22 | 0.001 | 61.64 ± 9.54 | 0.614 | |
| PRL (μ m) | Fovea | 85.23 ± 5.15 | 89.10 ± 4.92 | 0.002 | 87.83 ± 5.57 | 0.019 |
| IR | 80.69 ± 2.87 | 80.90 ± 2.90 | 0.475 | 82.51 ± 3.90 | 0.007 | |
| OR | 79.73 ± 3.50 | 78.40 ± 2.24 | 0.105 | 79.96 ± 3.41 | 0.249 | |
| RPE (μ m) | Fovea | 16.00 ± 4.20 | 17.33 ± 3.15 | 0.017 | 16.50 ± 4.38 | 0.436 |
| IR | 14.37 ± 1.72 | 15.20 ± 2.58 | 0.127 | 14.96 ± 2.58 | 0.186 | |
| OR | 13.97 ± 1.72 | 14.09 ± 2.50 | 0.228 | 13.67 ± 1.53 | 0.343 |
Values are presented as mean ± SD unless otherwise indicated. SD = Standard deviation; Preop = preoperative; CE = contralateral eye; Postop = postoperative; RNFL =retinal nerve fiber layer; IR = in-ner ring; OR = outer ring; GCL = ganglion cell layer; IPL = inner plexiform layer; INL = inner nuclear layer; OPL =outer plexiform layer; ONL =outer nuclear layer; PRL =photoreceptor layer; RPE = retinal pigment epithelium.
Table 4.
| Variables | CE | ERM | p-value* |
|---|---|---|---|
| SI (μ m) | 343.76 ± 17.62 | 458.60 ± 67.29 | <0.001 |
| II (μ m) | 348.20 ± 36.96 | 446.43 ± 89.13 | <0.001 |
| NI (μ m) | 342.00 ± 16.61 | 456.86 ± 73.01 | <0.001 |
| TI (μ m) | 330.66 ± 22.98 | 458.53 ± 81.12 | <0.001 |
| SO (μ m) | 303.33 ± 17.03 | 379.10 ± 58.48 | <0.001 |
| IO (μ m) | 305.23 ± 51.51 | 351.83 ± 58.29 | 0.001 |
| NO (μ m) | 322.93 ± 19.45 | 375.60 ± 40.36 | <0.001 |
| TO (μ m) | 297.46 ± 17.81 | 361.90 ± 59.26 | <0.001 |
Table 5.
| Variables | Preop | 1 month | 3 months | 6 months | p-value* |
|---|---|---|---|---|---|
| CMT | 485.83 ± 86.30 | 435.83 ± 64.06 | 403.20 ± 47.76 | 389.90 ± 54.15 | <0.001 |
| RNFL | 85.23 ± 61.84 | 50.60 ± 48.84 | 37.60 ± 35.36 | 30.10 ± 30.17 | <0.001 |
| GCL | 46.60 ± 12.00 | 45.23 ± 14.87 | 43.30 ± 11.29 | 41.43 ± 10.21 | <0.001 |
| IPL | 45.70 ± 10.75 | 47.16 ± 13.01 | 39.73 ± 8.42 | 37.86 ± 9.60 | <0.001 |
| GCL-IPL complex | 92.30 ± 20.91 | 95.06 ± 25.94 | 82.13 ± 18.13 | 79.30 ± 18.30 | 0.002 |
| INL | 47.93 ± 11.76 | 52.73 ± 10.69 | 49.90 ± 9.74 | 45.23 ± 11.72 | 0.072 |
| OPL | 39.66 ± 8.58 | 41.36 ± 10.45 | 37.03 ± 8.92 | 36.23 ± 8.29 | 0.043 |
| ONL | 109.73 ± 30.10 | 104.83 ± 21.74 | 109.10 ± 23.59 | 102.10 ± 21.11 | 0.212 |
| PRL | 85.23 ± 5.15 | 85.73 ± 5.00 | 87.80 ± 6.76 | 87.83 ± 5.57 | 0.009 |
| RPE | 16.00 ± 4.20 | 15.06 ± 2.34 | 16.50 ± 4.27 | 16.50 ± 4.38 | 0.520 |
SD = standard deviation; Preop = preoperative; CMT = central macular thickness; RNFL = retinal nerve fiber layer; GCL = ganglion cell layer; IPL = inner plexiform layer; INL = inner nuclear layer; OPL = outer plexiform layer; ONL = outer nuclear layer; PRL = photo-receptor layer; RPE = retinal pigment epithelium.
Table 6.
| Variables | ERM (Preop) | CE | p-value* | Postop (6 months) | p-value* | |
|---|---|---|---|---|---|---|
| RNFL (μ m) | Fovea | 72.45 ± 15.77 | 13.94 ± 3.59 | <0.001 | 39.42 ± 22.45 | <0.001 |
| IR | 69.24 ± 5.94 | 26.68 ± 7.16 | <0.001 | 35.54 ± 16.87 | <0.001 | |
| OR | 54.16 ± 20.87 | 38.76 ± 8.74 | <0.001 | 46.64 ± 16.71 | <0.001 | |
| GCL (μ m) | Fovea | 46.27 ± 21.73 | 22.10 ± 17.73 | 0.002 | 42.22 ± 22.04 | 0.046 |
| IR | 52.36 ± 3.27 | 49.27 ± 7.02 | <0.001 | 46.73 ± 3.22 | 0.024 | |
| OR | 40.02 ± 6.37 | 34.61 ± 7.14 | 0.034 | 36.14 ± 7.46 | <0.001 | |
| IPL (μ m) | Fovea | 46.60 ± 22.22 | 23.11 ± 3.61 | 0.009 | 37.20 ± 17.22 | <0.001 |
| IR | 53.46 ± 6.23 | 40.77 ± 7.16 | <0.001 | 47.06 ± 13.27 | 0.019 | |
| OR | 46.30 ± 7.34 | 32.12 ± 6.64 | 0.017 | 33.22 ± 16.20 | <0.001 | |
| GCL-IPL complex (μ m) | Fovea | 92.24 ± 16.46 | 44.76 ± 16.34 | <0.001 | 72.36 ± 12.62 | <0.001 |
| IR | 110.32 ± 17.10 | 97.62 ± 6.74 | <0.001 | 76.72 ± 7.63 | <0.001 | |
| OR | 77.32 ± 20.66 | 69.72 ± 3.00 | <0.001 | 72.03 ± 2.27 | 0.054 | |
| INL (μ m) | Fovea | 43.62 ± 12.73 | 25.70 ± 6.46 | <0.001 | 41.22 ± 10.02 | 0.066 |
| IR | 46.72 ± 6.06 | 32.72 ± 1.27 | <0.001 | 40.27 ± 6.30 | 0.097 | |
| OR | 42.76 ± 6.21 | 36.73 ± 1.26 | <0.001 | 37.61 ± 6.07 | 0.146 | |
| OPL (μ m) | Fovea | 40.02 ± 2.46 | 27.76 ± 2.37 | <0.001 | 37.22 ± 7.36 | 0.009 |
| IR | 37.61 ± 4.27 | 36.73 ± 6.67 | 0.075 | 36.62 ± 1.73 | 0.223 | |
| OR | 32.07 ± 1.34 | 27.72 ± 2.37 | 0.013 | 27.27 ± 2.11 | <0.001 | |
| ONL (μ m) | Fovea | 102.00 ± 14.21 | 79.01 ± 14.73 | <0.001 | 106.11 ± 13.46 | 0.106 |
| IR | 77.22 ± 16.72 | 66.71 ± 6.02 | <0.001 | 80.27 ± 10.21 | 0.146 | |
| OR | 67.67 ± 3.77 | 49.62 ± 7.07 | <0.001 | 69.23 ± 3.76 | 0.227 | |
| PRL (μ m) | Fovea | 86.21 ± 1.34 | 87.46 ± 6.72 | 0.541 | 89.02 ± 6.74 | 0.028 |
| IR | 80.72 ± 7.71 | 79.62 ± 7.72 | 0.475 | 82.26 ± 7.72 | 0.030 | |
| OR | 77.62 ± 2.37 | 77.01 ± 2.77 | 0.105 | 77.27 ± 2.46 | 0.523 | |
| RPE (μ m) | Fovea | 16.46 ± 2.20 | 16.91 ± 2.46 | 0.817 | 16.92 ± 1.17 | 0.327 |
| IR | 14.20 ± 2.27 | 16.27 ± 2.72 | 0.127 | 14.51 ± 2.72 | 0.263 | |
| OR | 13.02 ± 2.14 | 14.27 ± 2.70 | 0.228 | 13.21 ± 1.32 | 0.463 |
SD = Standard deviation; Preop = preoperative; CE = contralateral eye; Postop = postoperative; RNFL = retinal nerve fiber layer; IR = inner ring; OR = outer ring; GCL = ganglion cell layer; IPL = inner plexiform layer; INL = inner nuclear layer; OPL = outer plexiform layer; ONL = outer nuclear layer; PRL = photoreceptor layer; RPE = retinal pigment epithelium.
Table 7.
| Variables | Changes of retinal layer thickness | Interocular difference of retinal layer thickness | |||
|---|---|---|---|---|---|
| r | p-value* | r | p-value* | ||
| CMT | Fovea | 0.520 | 0.003 | 0.019 | 0.921 |
| IR | 0.344 | 0.063 | 0.028 | 0.882 | |
| OR | 0.321 | 0.084 | 0.088 | 0.644 | |
| RNFL | Fovea | 0.019 | 0.922 | 0.022 | 0.907 |
| IR | 0.116 | 0.543 | 0.026 | 0.891 | |
| OR | 0.001 | 0.996 | 0.086 | 0.652 | |
| GCL | Fovea | 0.157 | 0.408 | 0.477 | 0.008 |
| IR | 0.120 | 0.528 | 0.014 | 0.940 | |
| OR | 0.095 | 0.619 | 0.341 | 0.065 | |
| IPL | Fovea | 0.067 | 0.726 | 0.050 | 0.794 |
| IR | 0.162 | 0.393 | 0.024 | 0.898 | |
| OR | 0.052 | 0.785 | 0.101 | 0.594 | |
| GCL-IPL complex | Fovea | 0.102 | 0.592 | 0.132 | 0.487 |
| IR | 0.054 | 0.779 | 0.083 | 0.662 | |
| OR | 0.084 | 0.660 | 0.021 | 0.910 | |
| INL | Fovea | 0.026 | 0.892 | 0.087 | 0.649 |
| IR | 0.026 | 0.891 | 0.260 | 0.116 | |
| OR | 0.018 | 0.926 | 0.247 | 0.188 | |
| OPL | Fovea | 0.104 | 0.584 | 0.001 | 0.997 |
| IR | 0.240 | 0.202 | 0.040 | 0.833 | |
| OR | 0.290 | 0.120 | 0.189 | 0.317 | |
| ONL | Fovea | 0.005 | 0.980 | 0.030 | 0.874 |
| IR | 0.311 | 0.094 | 0.034 | 0.859 | |
| OR | 0.347 | 0.060 | 0.168 | 0.374 | |
| PRL | Fovea | -0.054 | 0.776 | -0.178 | 0.347 |
| IR | -0.221 | 0.240 | -0.184 | 0.330 | |
| OR | -0.185 | 0.327 | 0.161 | 0.394 | |
| RPE | Fovea | -0.005 | 0.971 | -0.265 | 0.157 |
| IR | -0.265 | 0.157 | -0.057 | 0.766 | |
| OR | 0.075 | 0.585 | -0.166 | 0.381 | |
CMT = central macular thickness; IR = inner ring; OR = outer ring; RNFL = retinal nerve fiber layer; GCL = ganglion cell layer; IPL = inner plexiform layer; INL = inner nuclear layer; OPL = outer plexiform layer; ONL = outer nuclear layer; PRL = photoreceptor layer; RPE = retinal pigment epithelium.
Table 8.
Table 9.
| Variables | Changes of retinal layer thickness | Interocular difference of retinal layer thickness | |||
|---|---|---|---|---|---|
| r | p-value* | r | p-value* | ||
| CMT | Fovea | 0.413 | 0.002 | 0.015 | 0.733 |
| IR | 0.273 | 0.058 | 0.022 | 0.702 | |
| OR | 0.255 | 0.066 | 0.070 | 0.512 | |
| RNFL | Fovea | 0.016 | 0.822 | 0.019 | 0.809 |
| IR | 0.103 | 0.484 | 0.023 | 0.794 | |
| OR | 0.001 | 0.888 | 0.076 | 0.581 | |
| GCL | Fovea | 0.175 | 0.455 | 0.532 | 0.009 |
| IR | 0.134 | 0.589 | 0.015 | 0.989 | |
| OR | 0.106 | 0.691 | 0.380 | 0.072 | |
| IPL | Fovea | 0.059 | 0.647 | 0.044 | 0.708 |
| IR | 0.144 | 0.350 | 0.026 | 0.993 | |
| OR | 0.046 | 0.700 | 0.112 | 0.663 | |
| GCL-IPL complex | Fovea | 0.090 | 0.528 | 0.117 | 0.543 |
| IR | 0.048 | 0.870 | 0.074 | 0.739 | |
| OR | 0.093 | 0.588 | 0.274 | 0.855 | |
| INL | Fovea | 0.032 | 0.709 | 0.008 | 0.067 |
| IR | 0.028 | 0.886 | 0.323 | 0.114 | |
| OR | 0.001 | 0.921 | 0.220 | 0.209 | |
| OPL | Fovea | 0.092 | 0.652 | 0.002 | 0.889 |
| IR | 0.214 | 0.225 | 0.044 | 0.743 | |
| OR | 0.258 | 0.134 | 0.168 | 0.354 | |
| ONL | Fovea | 0.006 | 0.875 | 0.026 | 0.976 |
| IR | 0.347 | 0.083 | 0.030 | 0.959 | |
| OR | 0.309 | 0.067 | 0.187 | 0.333 | |
| PRL | Fovea | -0.048 | 0.866 | -0.158 | 0.387 |
| IR | -0.197 | 0.268 | -0.201 | 0.368 | |
| OR | -0.206 | 0.365 | 0.143 | 0.391 | |
| RPE | Fovea | -0.006 | 0.866 | -0.236 | 0.175 |
| IR | -0.236 | 0.175 | -0.063 | 0.683 | |
| OR | 0.066 | 0.653 | -0.148 | 0.425 | |
CMT = central macular thickness; IR = inner ring; OR = outer ring; RNFL = retinal nerve fiber layer; GCL = ganglion cell layer; IPL = inner plexiform layer; INL = inner nuclear layer; OPL = outer plexiform layer; ONL = outer nuclear layer; PRL = photoreceptor layer; RPE = retinal pigment epithelium.
 XML Download