

 PDF
PDF ePub
ePub Citation
 Print
Print


Abstract
Purpose
Methods
Results
Figures and Tables
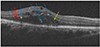 | Figure 1Horizontal sectional image of optical coherence tomography (OCT) in macular edema secodary to branch retinal vein occlusion. The OCT shows sparse exudates. Yellow arrow shows exudate smaller than 20 µm, blue arrows show exudates bigger than 40 µm and red arrows show exudates 20 µm to 40 µm, hyperreflective foci.
|
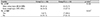
Table 1
Baseline characteristics of patients
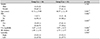
Values are presented as mean ± SD or n (%) unless otherwise indicated. The patients were classified as refractory if there was an increase in the mean retinal thickness >150 µm when measured 1 month after the three injections. Baseline: At first visit. Group I: Responsive group, Group II: Refractory group.
DM = diabetes mellitus; HTN = hypertension; VA = visual acuity; SE = spherical equivalents.
*p < 0.05; †Mean ± standard deviation, Independent sample t-test p-value; ‡Chi-square test p-value.
![]()
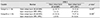
Table 2
Comparison of baseline parameters of standard ERG and mean retinal thickness
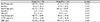
Values are presented as mean ± SD unless otherwise indicated. The patients were classified as refractory if there was an increase in the mean retinal thickness >150 µm when measured 1 month after the three injections. Baseline: At first visit. Group I: Responsive group, Group II: Refractory group.
ERG = electroretinogram; Rod B amp = rod response b wave amplitude; Rod B/A = rod response B/A ratio; Max B amp = maximal combined response b wave amplitude; Max B/A = maximal combined response B/A ratio; OPs = average of oscillatory potentials; Cone B amp = cone response b wave amplitude; 30 HZ amp = 30 HZ flicker response amplitude; MRT = mean retinal thickness.
*p < 0.05; †Mean ± standard deviation, Independent sample t-test p-value.
![]()
Table 3
Comparison of subfoveal choroidal thickness, hyperreflective foci
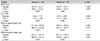
Values are presented as mean ± SD unless otherwise indicated. The patients were classified as refractory if there was an increase in the mean retinal thickness >150 µm when measured 1 month after the three injections. Baseline: At first visit. IVB 3: When 1 month after 3 times of intravitreal bevacizumab injections. Group I: Responsive group, Group II: Refractory group.
SFCT = subfoveal choroidal thickness; No. of HF = number of hyperreflective foci; ELM = external limiting membrane; IS/OS = junction of inner and outer photoreceptor segments.
*p < 0.05; †Mean ± standard deviation, Independent sample t-test p-value; ‡Paired t-test p-value.
![]()
Table 4
Comparison of baseline hyperreflective foci, subretinal fluid
Values are presented as n (%) unless otherwise indicated. The patients were classified as refractory if there was an increase in the mean retinal thickness >150 µm when measured 1 month after the three injections. Baseline: At first visit. Group I: Responsive group, Group II: Refractory group.
No. of HF = number of hyperreflective foci; ELM = external limiting membrane; RPE = retinal pigment epithelium; NFL = nerve fiber layer; ONL = outer nuclear layer; No. of SRF = number of patients who have subretinal fluid; Yes = patients who have subretinal fluid; No = patients who don't have subretinal fluid.
*p < 0.05; †Chi-square test p-value.
![]()
Table 5
Comparison of position of hyperreflective foci in group I, II
Values are presented as n (%) unless otherwise indicated. The patients were classified as refractory if there was an increase in the mean retinal thickness >150 µm when measured 1 month after the three injections. Baseline: At first visit. IVB 3: When 1 month after 3 times of intravitreal bevacizumab injections. Group I: Responsive group, Group II: Refractory group.
ELM = external limiting membrane; RPE = retinal pigment epithelium; NFL = nerve fiber layer; ONL = outer nuclear layer.
*p < 0.05; †McNemar test p-value.
![]()
Table 6
Regression analyses of baseline characteristics for refractory macular edema secondary to branch retinal vein occlusion after 3 times of intravitreal bevacizumab injections
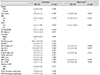
Baseline: At first visit.
OR = odds ratio; CI = confidence interval; DM = diabetes mellitus; HTN = hypertension; VA = visual acuity; SE = spherical equivalents; Rod B amp = rod response b wave amplitude; Rod B/A = rod response B/A ratio; Max B amp = maximal combined response b wave amplitude; Max B/A = maximal combined response B/A ratio; OPs = average of oscillatory potentials; Cone B amp = cone response b wave amplitude; 30 HZ amp = 30 HZ flicker response amplitude; MRT = mean retinal thickness; SFCT = subfoveal choroidal thickness; HF = hyperreflective foci; ORL = outer retinal layer (ELM-retinal pigment epithelium [RPE]); IRL = inner retinal layer (nerve fiber layer [NFL]-outer nuclear layer [ONL]); ELM = external limiting membrane; IS/OS = junction of inner and outer photoreceptor segments.
*p < 0.05; †Multivariate logistic regression analysis with backward method.
![]()
 XML Download