

 PDF
PDF ePub
ePub Citation
 Print
Print


Abstract
Purpose
Methods
Results
Conclusions
Figures and Tables
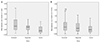 | Figure 1Distribution of mean absolute error. (A) Box plots showing the distribution of mean absolute error at 1 week (y-axis) in patients in the combined group, the sequential group, and in the control group (x-axis). The box plots show the median, interquartile range, 95 percentile, outliers, and extreme values. (B) Box plots showing the distribution of mean absolute error at 2 months (y-axis) in patients in the combined group, the sequential group, and in the control group (x-axis). The box plots show the median, interquartile range, 95 percentile, outliers, and extreme values.
|
Table 1
Patient clinical characteristics
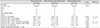
Values are presented as mean ± SD or n (%) unless otherwise indicated.
(a) = Combined group; (b) = Sequential group; (c) = Control group; POAG = primary open angle glaucoma; PACG = primary angle closure glaucoma; NVG = neovascular glaucoma; IOP = intraocular pressure.
*By analysis of variance (ANOVA) test; †By χ2 test; ‡The mean preoperative intraocular pressure of the combined group was significantly higher than that of the control group and the sequential group; §The mean intraocular pressure of the combined group at 1 week after surgery was significantly higher than that of the control group; ΠThe mean difference of intraocular pressure between postoperative 1 week and pre-operation of control group and the sequential group was significantly higher than that of the combined group; #The mean difference of intraocular pressure between postoperative 2 months and pre-operation of control group and the sequential group was significantly higher than that of the combined group.
![]()
Table 2
Refractive outcomes of patients
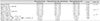
Values are presented as mean ± SD or n (%) unless otherwise indicated.
(a) = Combined group; (b) = Sequential group; (c) = Control group; SE = spherical equivalent; RPE = refractive prediction error; MAE = mean absolute error; D = diopter.
*By analysis of variance (ANOVA) test; †By χ2 test; ‡The predicted spherical equivalent of the combined group was significantly higher than that of the control group; §The mean absolute error of the combined group and sequential group at 1 week after surgery was significantly higher than that of the control group; ΠThe mean absolute error of the combined group at 2 months after surgery was significantly higher than that of the control group; #A χ2 test was not performed for statistical reason, because the column with an expected frequency of less than 5 was greater than 20% of the total column.
![]()
Notes
This study was presented as a poster at the 116th Annual Meeting of the Korean Ophthalmological Society 2016.
 XML Download