

 PDF
PDF ePub
ePub Citation
 Print
Print


Abstract
Purpose
To analyze the influence of preoperative corneal endothelial status on postoperative corneal endothelium density after cataract surgery.
Methods
We evaluated 228 eyes of 158 patients who underwent cataract surgery. Corneal endothelial status and central cor-neal thickness were measured before surgery and 1 day, 1 month, 3 months and 6 months after surgery. Patients were classified by preoperative endothelial cell density (three groups) and their coefficients of variation and hexagonality (two groups). Clinical parameters, including corneal endothelial cell losses, visual acuity, intraocular pressure, spherical equivalent refraction and cen-tral corneal thickness were measured to compare the intergroup indices.
Results
There were no significant differences in corneal endothelial cell losses at 1 day, 1 month, 3 months and 6 months after surgery in any of the groups based on corneal endothelial cell density. There were increases in corneal thickness at 1 day and 1 month after surgery that were significantly higher in the low-endothelial cell density group than the 2,000−2,500 cells/mm2 cell density group ( p < 0.05), but there were no differences after the 3-month time point. There were no significant differences in clin-ical parameters for the coefficient of variation and hexagonality groups until 6 months after surgery.
Conclusions
We observed reversible corneal edema in the low endothelial group; however, there were no significant intergroup differences in corneal endothelial cell loss due to preoperative corneal endothelial status. Our results suggest that cataract sur-gery is relatively safe for patients with morphologically abnormal corneal endothelium and/or low endothelial density; the safety is primarily due to improved equipment and surgery techniques.
Go to : 
References
1. Hodson S. Evidence for a bicarbonate-dependent sodium pump in corneal endothelium. Exp Eye Res. 1971; 11:20–9.

1. Maurice DM. The location of the fluid pump in the cornea. J Physiol. 1972; 221:43–54.
1. Dikstein S, Maurice DM. The metabolic basis to the fluid pump in the cornea. J Physiol. 1972; 221:29–41.
1. Fischbarg J, Lim JJ. Role of cations, anions and carbonic anhy-drase in fluid transport across rabbit corneal endothelium. J Physiol. 1974; 241:647–75.
1. Geroski DH, Matsuda M, Yee RW, Edelhauser HF. Pump function of the human corneal endothelium Effects of age and cornea guttata. Ophthalmology. 1985; 92:759–63.
1. Waring GO 3rd, Bourne WM, Edelhauser HF, Kenyon KR. The corneal endothelium. Normal and pathologic structure and function. Ophthalmology. 1982; 89:531–90.
1. Bourne WM, Kaufman HE. Specular microscopy of human cor-neal endothelium in vivo. Am J Ophthalmol. 1976; 81:319–23.
1. Bourne WM, O'Fallon WM. Endothelial cell loss during penetrat-ing keratoplasty. Am J Ophthalmol. 1978; 85:760–6.
1. Bourne RR, Minassian DC, Dart JK. . Effect of cataract sur-gery on the corneal endothelium: modern phacoemulsification compared with extracapsular cataract surgery. Ophthalmology. 2004; 111:679–85.
1. Hayashi K, Hayashi H, Nakao F, Hayashi F. Risk factors for cor-neal endothelial injury during phacoemulsification. J Cataract Refract Surg. 1996; 22:1079–84.
1. Cameron MD, Poyer JF, Aust SD. Identification of free radicals produced during phacoemulsification. J Cataract Refract Surg. 2001; 27:463–70.
1. McCarey BE, Edelhauser HF, Lynn MJ. Review of corneal endo-thelial specular microscopy for FDA clinical trials of refractive procedures, surgical devices, and new intraocular drugs and solutions. Cornea. 2008; 27:1–16.
1. Bourne WM, McLaren JW. Clinical responses of the corneal endothelium. Exp Eye Res. 2004; 78:561–72.
1. Schultz RO, Matsuda M, Yee RW. . Corneal endothelial changes in type I and type II diabetes mellitus. Am J Ophthalmol. 1984; 98:401–10.
1. Benetz BA, Lass JH, Gal RL. . Endothelial morphometric pa-rameters to predict endothelial graft failure after penetrating keratoplasty. JAMA Ophthalmol. 2013; 131:601–8.
1. Yang J, Lee JK. Long-term endothelial cell changes after an-gle-supported anterior chamber lens implantation in phakic eyes. J Korean Ophthalmol Soc. 2012; 53:208–14.
1. Krachmer JH, Mannis MJ, Holland EJ. Cornea. 3rd ed. Vol. 1. St. Louis: MOSBY;2010; 188.
1. Choi JH, Oh HJ, Yoon KC. Long-term results after cataract surgery in patients with low corneal endothelial cell density. J Korean Ophthalmol Soc. 2013; 54:602–9.
1. Yamazoe K, Yamaguchi T, Hotta K. . Outcomes of cataract sur-gery in eyes with a low corneal endothelial cell density. J Cataract Refract Surg. 2011; 37:2130–6.
1. Hayashi K, Yoshida M, Manabe S, Hirata A. Cataract surgery in eyes with low corneal endothelial cell density. J Cataract Refract Surg. 2011; 37:1419–25.
1. Joyce NC. Cell cycle status in human corneal endothelium. Exp Eye Res. 2005; 81:629–38.
1. Liang H, Zuo HY, Chen JM. . Corneal endothelial cell density and morphology and central corneal thickness in Guangxi Maonan and Han adolescent students of China. Int J Ophthalmol. 2015; 8:608–11.
1. Sopapornamorn N, Lekskul M, Panichkul S. Corneal endothelial cell density and morphology in Phramongkutklao Hospital. Clin Ophthalmol. 2008; 2:147–51.
1. Lee EK, Kim MK, Wee WR, Lee JH. Short-term outcome of cata-ract surgery using torsional-mode phacoemulsification for patients with low endothelial cell counts. J Korean Ophthalmol Soc. 2011; 52:434–41.
1. Benedetti S, Casamenti V, Benedetti M. Long-term endothelial changes in phakic eyes after Artisan intraocular lens implantation to correct myopia: five-year study. J Cataract Refract Surg. 2007; 33:784–90.
1. Edelhauser HF, Sanders DR, Azar R. . Corneal endothelial as-sessment after ICL implantation. J Cataract Refract Surg. 2004; 30:576–83.
1. Minassian DC, Rosen P, Dart JK. . Extracapsular cataract ex-traction compared with small incision surgery by phacoemulsifica-tion: a randomised trial. Br J Ophthalmol. 2001; 85:822–9.
Go to :
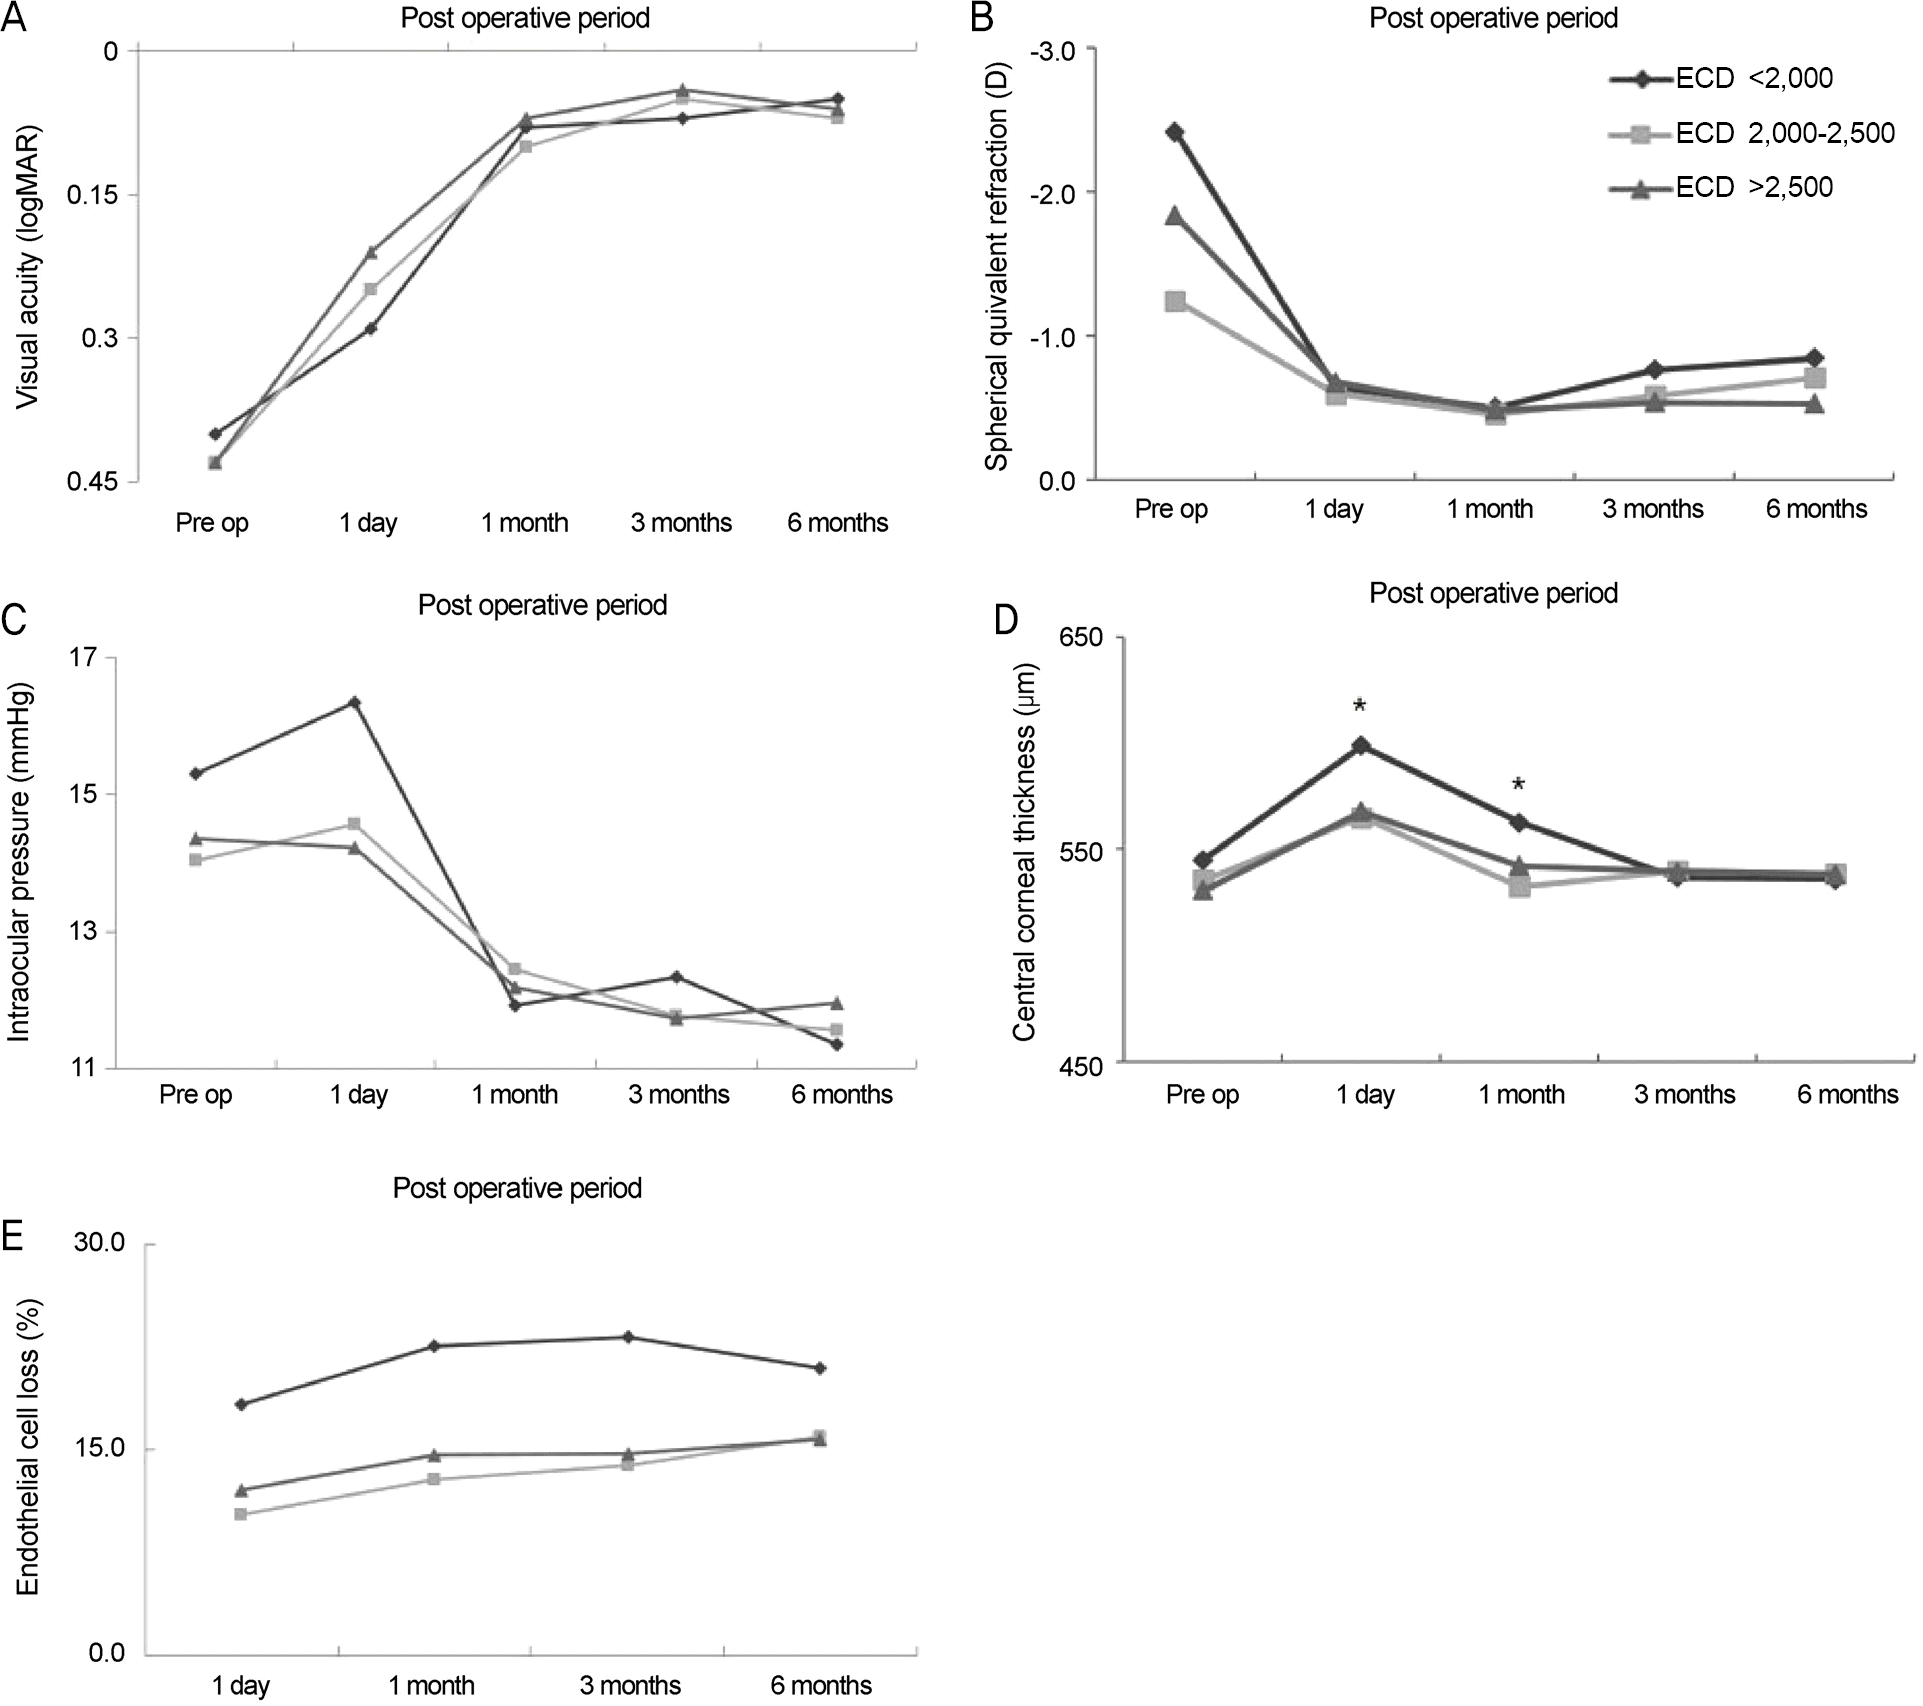 | Figure 1.Comparison of different clinical parameters within subject groups with different cell density. Comparison of best corrected visual acuity (A), spherical equivalent refraction (B), intraocular pressure (C), central corneal thickness (D) and en-dothelial cell loss (E) in subject groups with different cell density. There were no statistically significant differences among the three groups, except in central corneal thickness of 1 day and 1 month after surgery. ECD = endothelial cell den-sity; Pre op = preoperation. * Statistically difference between the ECD < 2,000 cells/mm2 and 2,000-2,500 cells/mm2. |
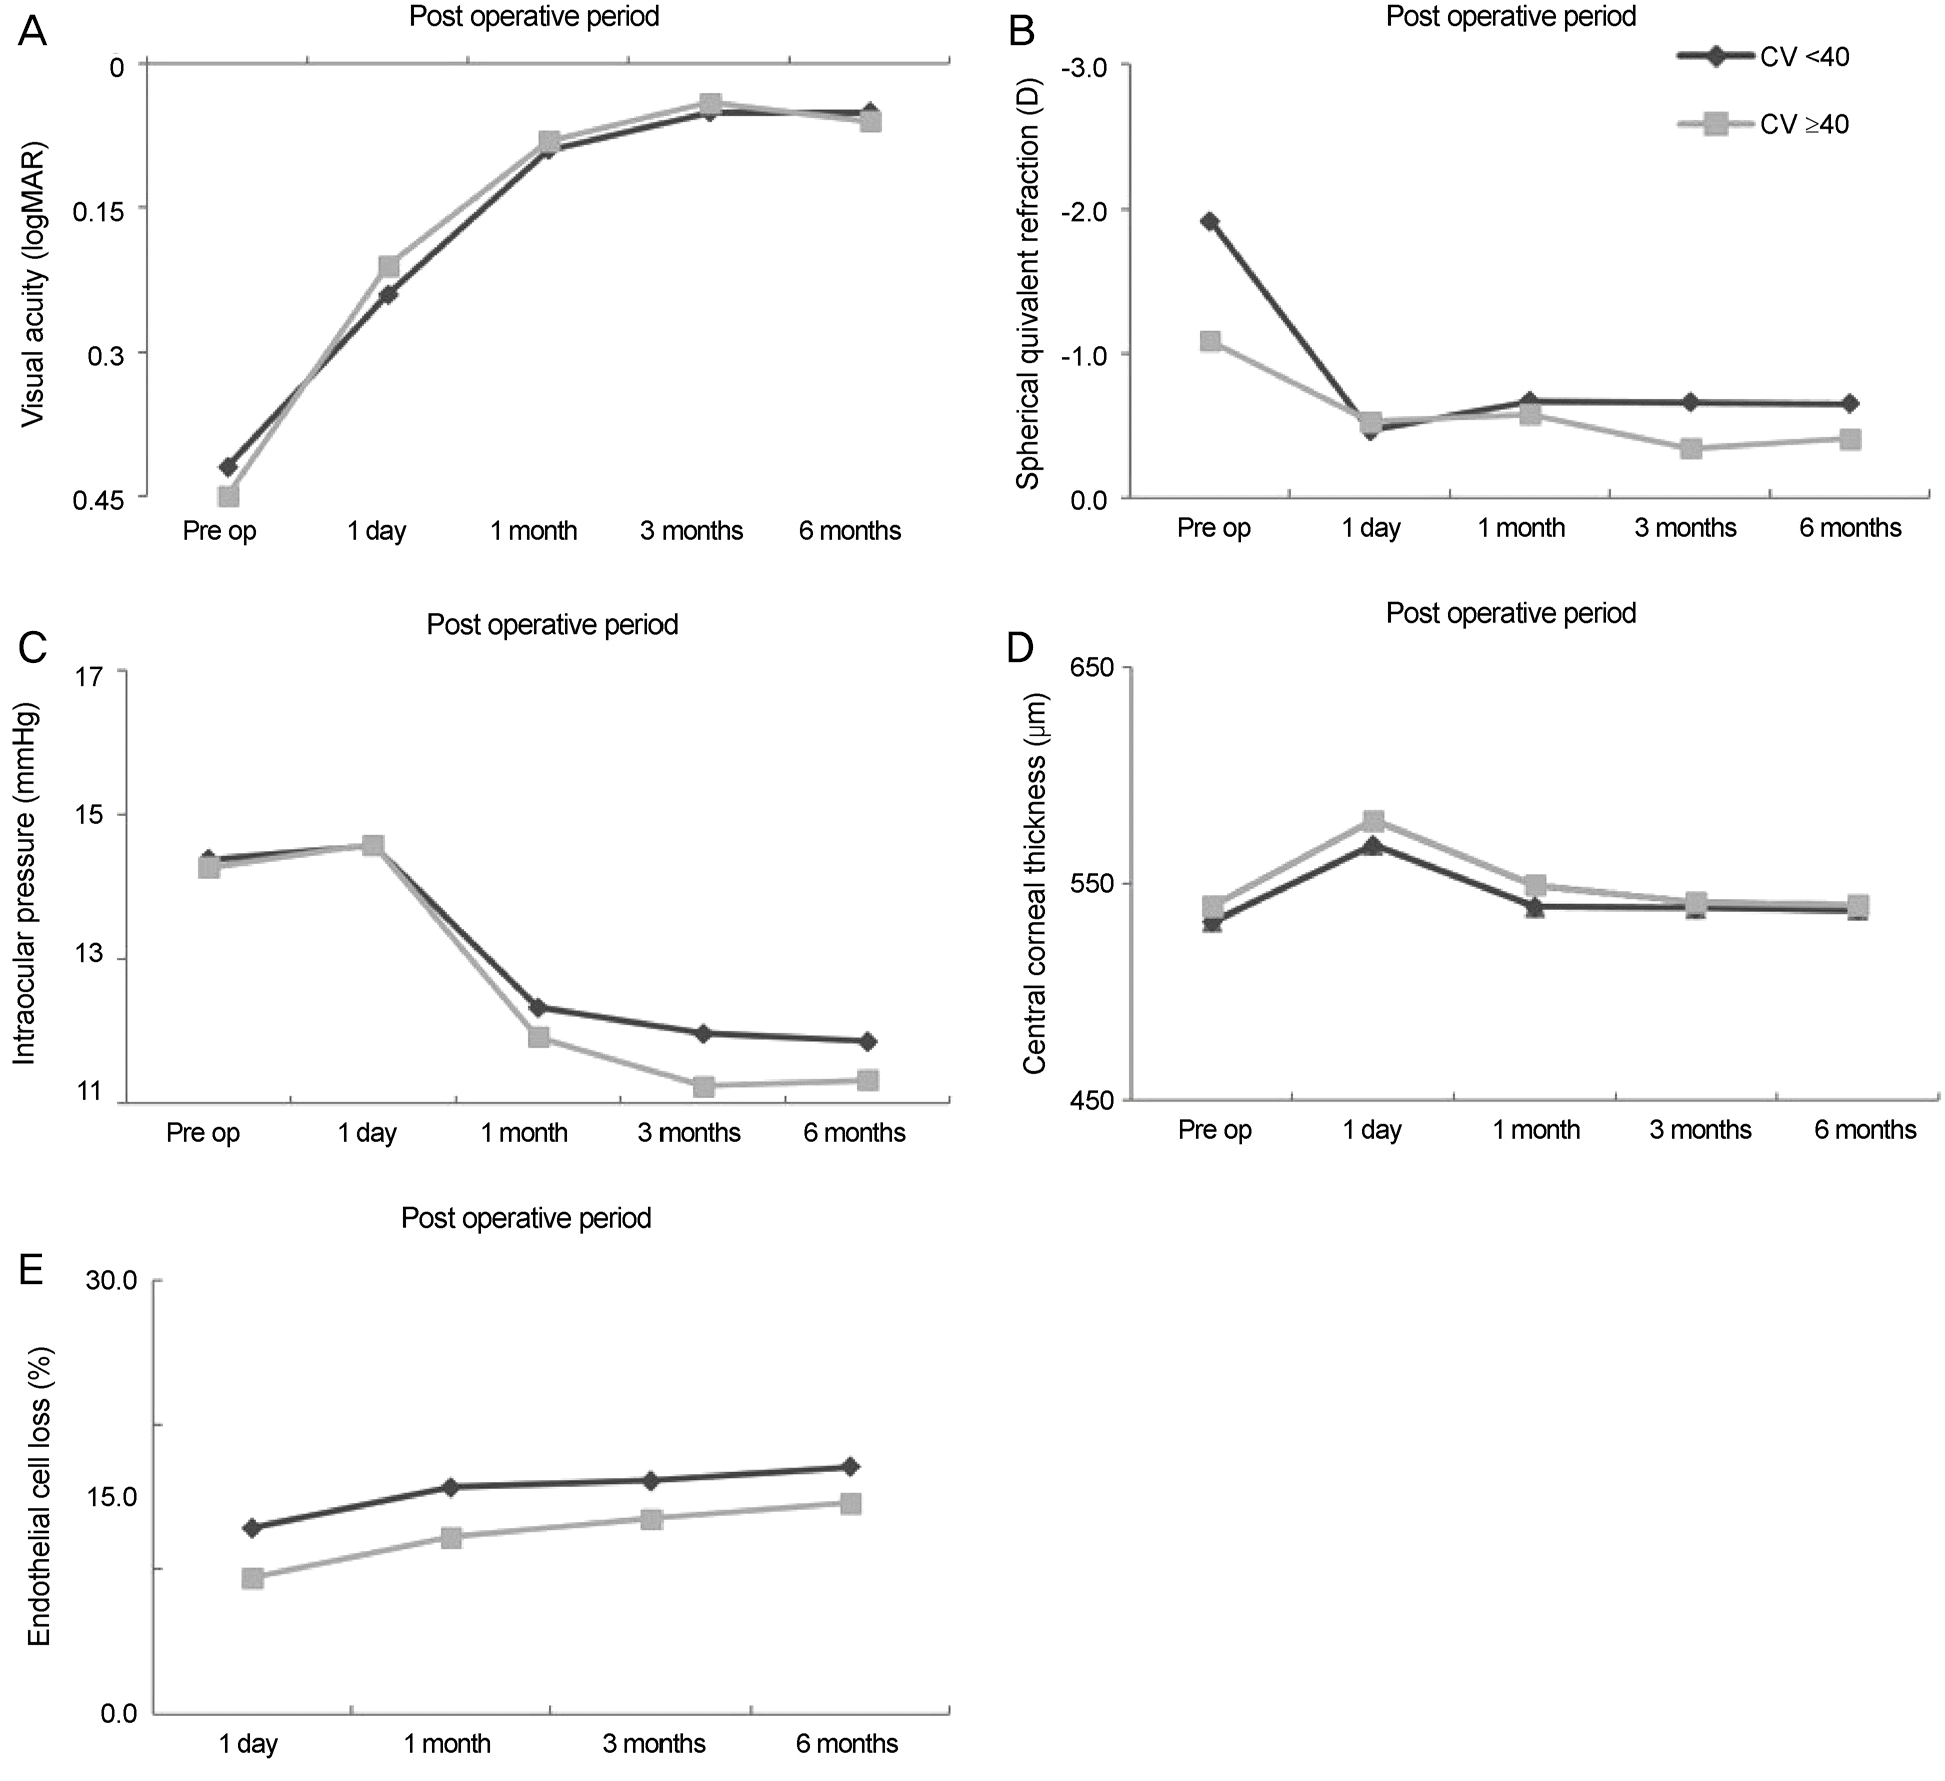 | Figure 2.Comparison of different clinical parameters within subject groups with different coefficient of variation. Comparison of best corrected visual acuity (A), spherical equivalent re-fraction (B), intraocular pressure (C), central corneal thickness (D) and endothelial cell loss (E) in subject groups with different coefficient of variation. There were no statistically significant differences between the two groups. Pre op = preoperation; CV = coefficient of variation. |
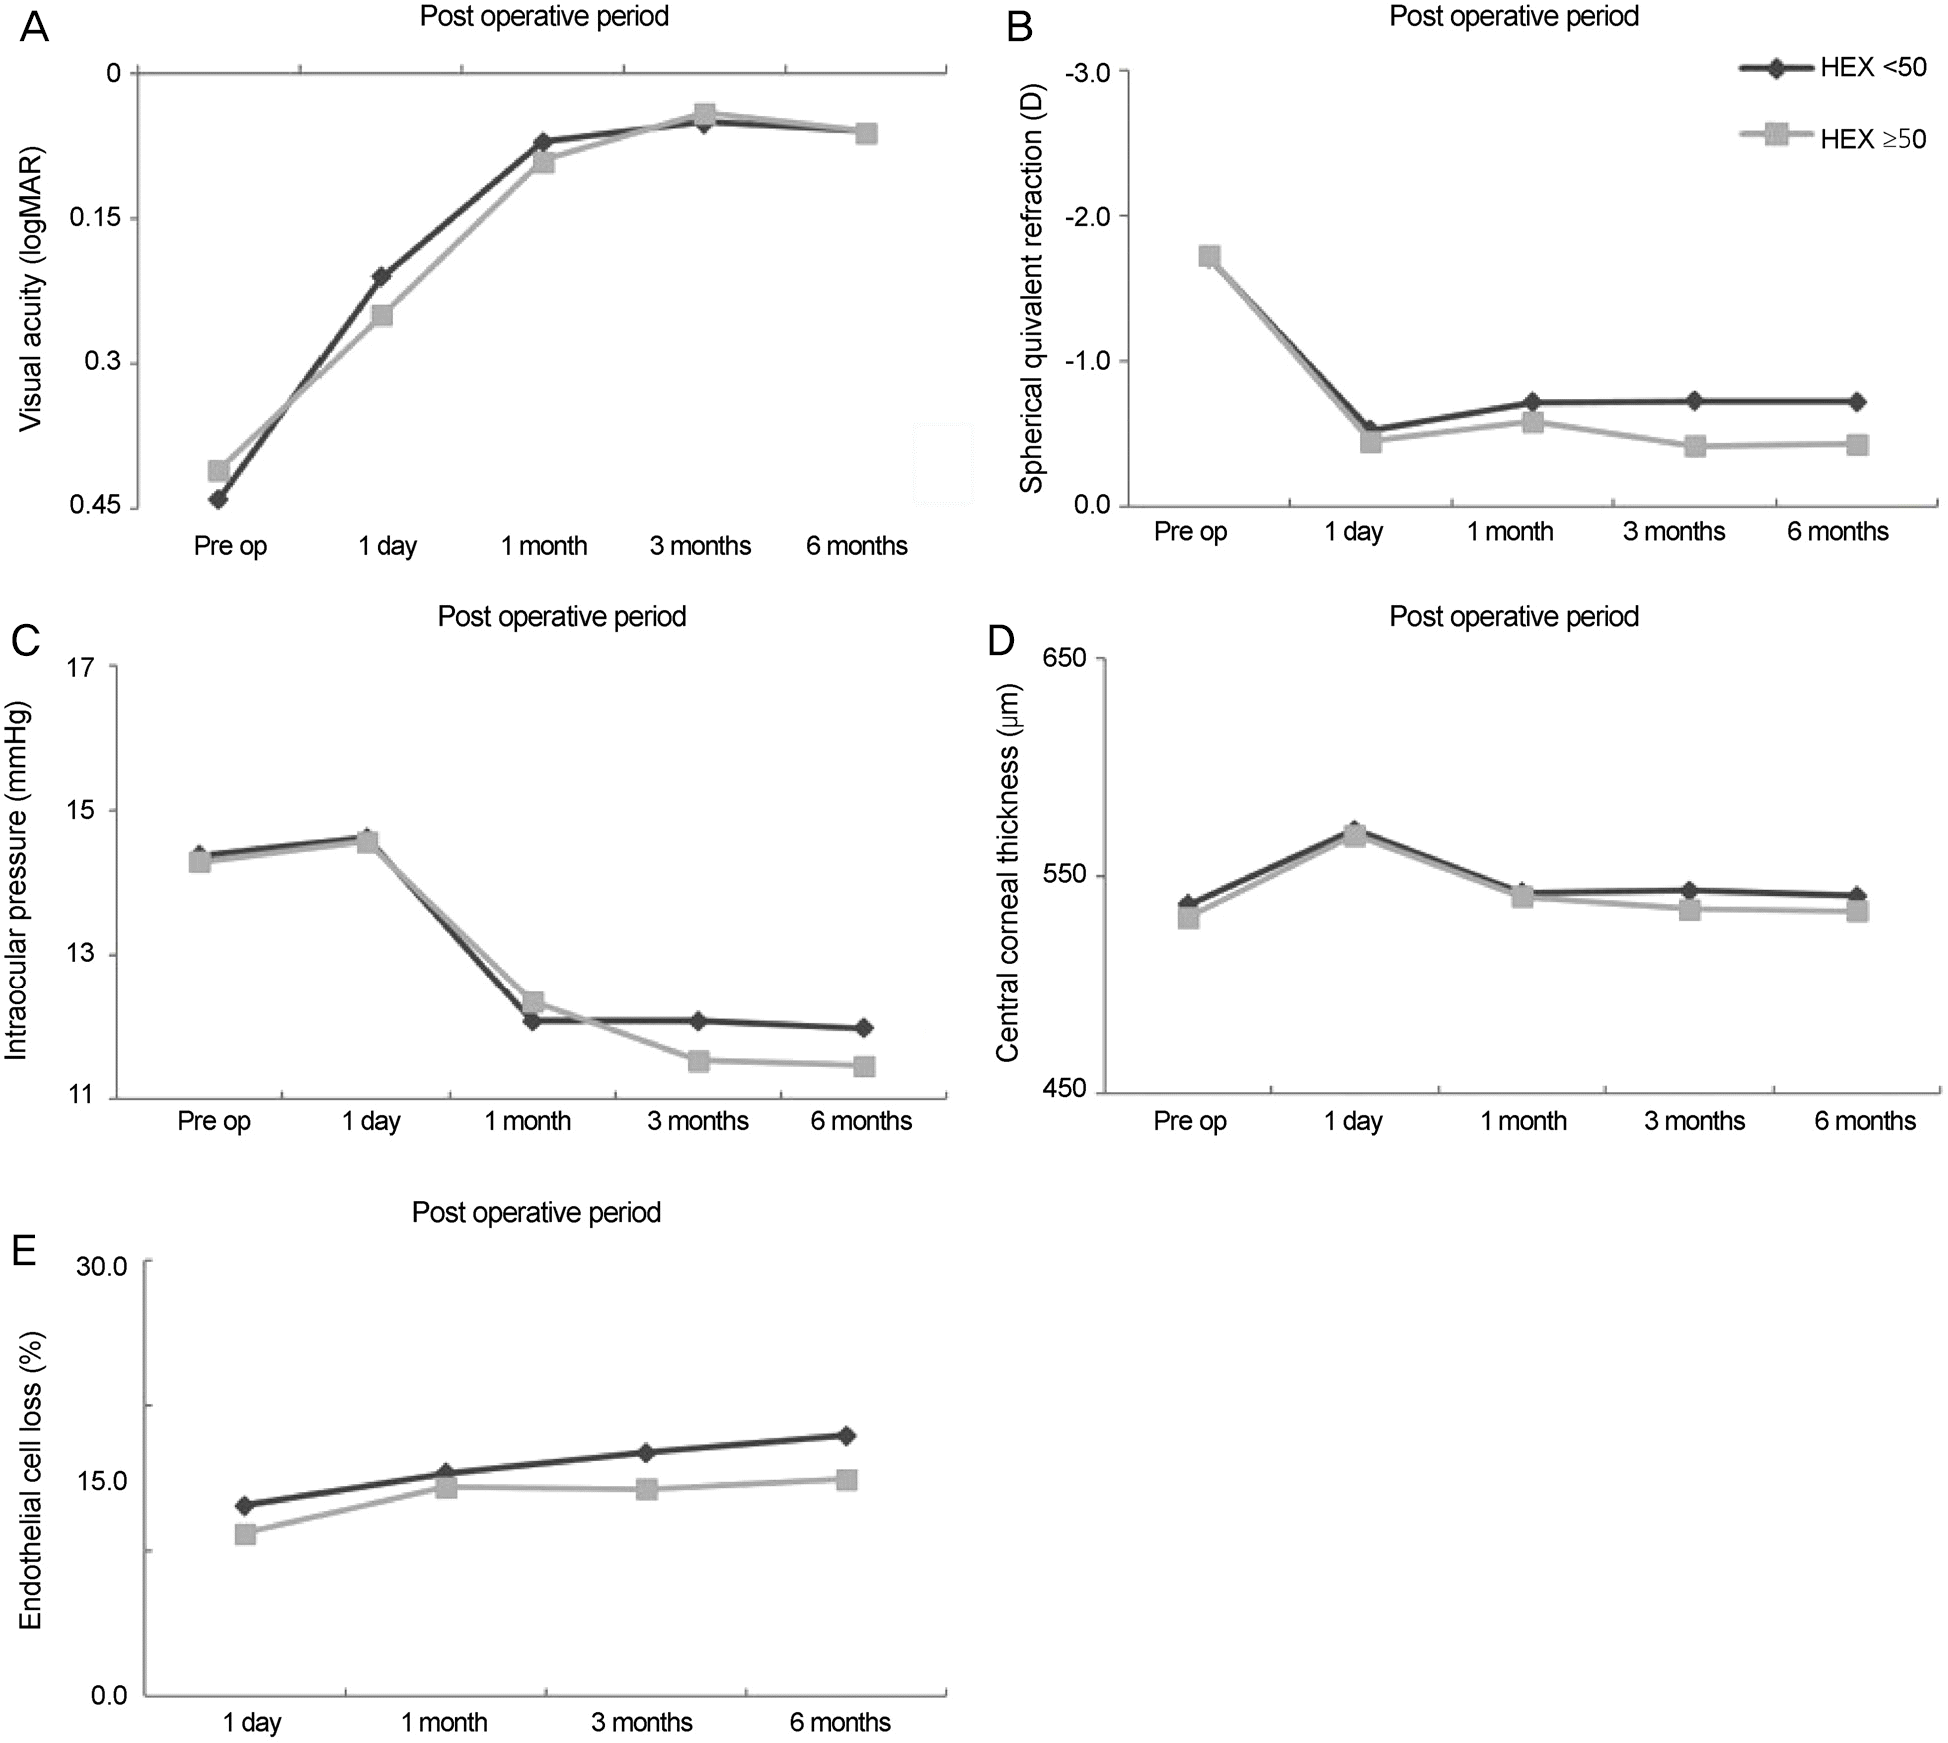 | Figure 3.Comparison of different clinical parameters within subject groups with different hexagonality. Comparison of best corrected visual acuity (A), spherical equivalent refraction (B), intraocular pressure (C), central corneal thickness (D) and endo-thelial cell loss (E) in subject groups with different hexagonality. There were no statistically significant differences between the two groups. Pre op = preoperation; HEX = hexagonality. |
Table 1.
Demographics of the subject groups with different cell density
| Group 1 | Group 2 | Group 3 | ||
|---|---|---|---|---|
| ECD < 2,000 cells/mm2 | ECD 2,000-2,500 cells/mm2 | ECD > 2,500 cells/mm2 | p-value* | |
| (n = 26) | (n = 76) | (n = 126) | ||
| Age (years) | 72.50 ± 9.42 | 71.67 ± 9.66 | 63.48 ± 14.92 | <0.001 |
| Sex (M:F) | 11:15 | 22:54 | 42:84 | 0.451 |
| Best corrected visual acuity (logMAR) | 0.40 ± 0.22 | 0.43 ± 0.26 | 0.43 ± 0.25 | 0.923 |
| Spherical equivalent refraction (D) | -2.41 ± 4.73 | -1.25 ± 3.53 | -1.84 ± 5.32 | 0.570 |
| IOP (mmHg) | 15.31 ± 2.53 | 14.03 ± 3.03 | 14.36 ± 2.48 | 0.112 |
| CCT (μ m) | 544.89 ± 37.80 | 535.65 ± 33.34 | 530.75 ± 29.94 | 0.108 |
| ECD (cells/mm2) | 1,600.58 ± 424.58 | 2,271.82 ± 132.32 | 2,789.84 ± 211.13 | <0.001 |
| CV | 37.38 ± 15.25 | 35.74 ± 9.51 | 34.13 ± 10.01 | 0.063 |
| HEX (%) | 45.15 ± 22.39 | 55.78 ± 29.35 | 54.00 ± 22.97 | 0.175 |
| Nucleus sclerosis (LOCS III grade) | 2.88 ± 0.59 | 2.96 ± 0.77 | 2.73 ± 0.75 | 0.096 |
| Average phaco power (%) | 24.99 ± 3.35 | 22.54 ± 4.29 | 23.49 ± 4.25 | 0.092 |
| Total phaco energy | 12.21 ± 7.06 | 11.16 ± 9.57 | 9.83 ± 12.22 | 0.514 |
Table 2.
Demographics of the subject groups with different coefficient of variation
| Groups | p-value* | ||
|---|---|---|---|
| CV < 40 (n = 166) | CV ≥ 40 (n = 62) | ||
| Age (years) | 66.51 ± 13.90 | 69.50 ± 11.75 | 0.148 |
| Sex (M:F) | 48:118 | 25:37 | 0.134 |
| Best corrected visual acuity (logMAR) | 0.42 ± 0.24 | 0.43 ± 0.27 | 0.899 |
| Spherical equivalent refraction (D) | -1.92 ± 4.61 | -1.09 ± 5.00 | 0.326 |
| IOP (mmHg) | 14.38 ± 2.75 | 14.27 ± 2.56 | 0.781 |
| CCT (μ m) | 532.81 ± 32.65 | 537.54 ± 30.88 | 0.342 |
| ECD (cells/mm2) | 2,510.54 ± 448.90 | 2,392.50 ± 464.02 | 0.091 |
| CV | 29.90 ± 5.80 | 47.77 ± 9.04 | <0.001 |
| HEX (%) | 54.02 ± 25.93 | 51.98 ± 23.04 | 0.618 |
| Nucleus sclerosis (LOCS III grade) | 2.79 ± 0.74 | 2.93 ± 0.76 | 0.232 |
| Average phaco power (%) | 23.36 ± 4.44 | 23.30 ± 3.50 | 0.936 |
| Total phaco energy | 10.71 ± 11.02 | 10.08 ± 10.47 | 0.712 |
Table 3.
Demographics of the subject groups with different hexagonality
|
Groups |
p-value* | ||
|---|---|---|---|
| HEX < 50 (n = 109) | HEX ≥ 50 (n = 119) | ||
| Age (years) | 67.36 ± 11.88 | 66.96 ± 14.71 | 0.823 |
| Sex (M:F) | 38:71 | 37:82 | 0.575 |
| Best corrected visual acuity (logMAR) | 0.44 ± 0.25 | 0.41 ± 0.24 | 0.379 |
| Spherical equivalent refraction (D) | -1.70 ± 3.98 | -1.73 ± 5.27 | 0.982 |
| IOP (mmHg) | 14.38 ± 2.71 | 14.29 ± 2.65 | 0.805 |
| CCT (μ m) | 537.01 ± 31.89 | 531.32 ± 32.53 | 0.188 |
| ECD (cells/mm2) | 2,424.87 ± 513.98 | 2,536.79 ± 387.11 | 0.067 |
| CV | 35.27 ± 10.89 | 33.13 ± 9.09 | 0.109 |
| HEX (%) | 31.38 ± 14.50 | 67.33 ± 14.91 | <0.001 |
| Nucleus sclerosis (LOCS III grade) | 2.91 ± 0.76 | 2.74 ± 0.72 | 0.084 |
| Average phaco power (%) | 22.96 ± 4.34 | 23.71 ± 4.08 | 0.274 |
| Total phaco energy | 10.07 ± 9.92 | 10.79 ± 11.52 | 0.624 |
 XML Download