

 PDF
PDF ePub
ePub Citation
 Print
Print


Abstract
Purpose
To investigate retinal nerve fiber layer (RNFL) thickness using swept source (SS)-optical coherence tomography (OCT) in healthy Koreans and to evaluate the effects of age on the distributional variability of thickness.
Methods
We performed a retrospective review of 309 normal eyes presenting for examination of peripapillary nerve fiber layer thickness measured by SS-OCT (DRI OCT-1, Atlantis SS-OCT, Topcon, Tokyo, Japan) from July 2014 to February 2016. The patients were between the ages of 20 and 79 without systemic or ocular disease. The patients were divided into 3 age groups of 20 to 39 years (85 eyes), 40 to 59 years (140 eyes), and 60 to 79 years (84 eyes). The groups were matched based on average RNFL thickness and quadrant and 12 o'clock position RNFL thickness.
Results
The average RNFL thickness of the inferior quadrant was the thickest of the layers and revealed a bimodal distribution. In the three groups, the thicknesses of the average RNFL, quadrant, and 12 o'clock RNFL decreased with age. There was significant difference in the measurements (p < 0.05) of quadrant RNFL thickness except that in the nasal quadrant (p = 0.068).
Figures and Tables
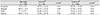
Figure 1
Scatterplot of mean and 4 quadrant retinal nerve fiver layer (RNFL) thickness according to age. (A-E) All graphs represent a decreasing tendency of thickness by aging. CI = confidence interval.
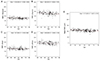
Figure 2
Distribution of Retinal nerve fiber layer (RNFL) thickness according to group. This schimatized graph represent the it is thinner in the older age group.
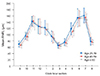
Figure 3
Scatterplot of 12 clock-hour sectors of retinal nerve fiber layer thickness (RNFL) according to age. (A-L) All graphs represent a decreasing tendency of thickness by aging. CI = confidence interval.
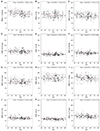
Figure 4
Distribution of retinal nerve fiber layer thickness (RNFL) thickness according to age (group by 10's). This schimatized graph represent the it is thinner in the older age group.
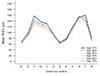
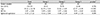
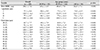
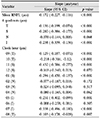
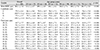
Table 3
Slopes and annual rates of decrease for mean, 4 quadrants, and 12 clock-hour sectors RNFL thickness
References
1. Banister K, Boachie C, Bourne R, et al. Can automated imaging for optic disc and retinal nerve fiber layer analysis aid glaucoma detection? Ophthalmology. 2016; 123:930–938.
2. Reus NJ, Lemij HG, Garway-Heath DF, et al. Clinical assessment of stereoscopic optic disc photographs for glaucoma: the European Optic Disc Assessment Trial. Ophthalmology. 2010; 117:717–723.
3. Quigley HA, Dunkelberger GR, Green WR. Retinal ganglion cell atrophy correlated with automated perimetry in human eyes with glaucoma. Am J Ophthalmol. 1989; 107:453–464.
4. Sihota R, Sony P, Gupta V, et al. Diagnostic capability of optical coherence tomography in evaluating the degree of glaucomatous retinal nerve fiber damage. Invest Ophthalmol Vis Sci. 2006; 47:2006–2010.
5. Kampougeris G, Spyropoulos D, Mitropoulou A, et al. Peripapillary retinal nerve fibre layer thickness measurement with SD-OCT in normal and glaucomatous eyes: distribution and correlation with age. Int J Ophthalmol. 2013; 6:662–665.
6. Hong S, Seong GJ, Kim SS, et al. Comparison of peripapillary retinal nerve fiber layer thickness measured by spectral vs. time domain optical coherence tomography. Curr Eye Res. 2011; 36:125–134.
7. Yang Z, Tatham AJ, Zangwill LM, et al. Diagnostic ability of retinal nerve fiber layer imaging by swept-source optical coherence tomography in glaucoma. Am J Ophthalmol. 2015; 159:193–201.
8. Ha A, Lee SH, Lee EJ, Kim TW. Retinal nerve fiber layer thickness measurement comparison using spectral domain and swept source optical coherence tomography. Korean J Ophthalmol. 2016; 30:140–147.
9. Leem HS, Paik DJ, Kim HC. Morphological analysis of papillary retinal vessels and retinal nerve fiber layer in Koreans. J Korean Ophthalmol Soc. 2007; 48:1369–1378.
10. Lee JH, Ahn CS, Lee DY. Quantification of retinal nerve fiber layer thickness in the normal subjects using optical coherence tomography. J Korean Ophthalmol Soc. 1999; 40:2804–2815.
11. Savini G, Carbonelli M, Barboni P. Retinal nerve fiber layer thickness measurement by Fourier-domain optical coherence tomography: a comparison between cirrus-HD OCT and RTVue in healthy eyes. J Glaucoma. 2010; 19:369–372.
12. Chang RT, Knight OJ, Feuer WJ, Budenz DL. Sensitivity and specificity of time-domain versus spectral-domain optical coherence tomography in diagnosing early to moderate glaucoma. Ophthalmology. 2009; 116:2294–2299.
13. Patel NB, Wheat JL, Rodriguez A, et al. Agreement between retinal nerve fiber layer measures from Spectralis and Cirrus spectral domain OCT. Optom Vis Sci. 2012; 89:E652–E666.
14. Knight OJ, Chang RT, Feuer WJ, Budenz DL. Comparison of retinal nerve fiber layer measurements using time domain and spectral domain optical coherent tomography. Ophthalmology. 2009; 116:1271–1277.
15. Bayraktar S, Bayraktar Z, Yilmaz OF. Influence of scan radius correction for ocular magnification and relationship between scan radius with retinal nerve fiber layer thickness measured by optical coherence tomography. J Glaucoma. 2001; 10:163–169.
16. Song TG, Yoo YC, Lee HB. Quantitative analysis of retinal nerve fiber layer thickness profile in myopic eyes. J Korean Ophthalmol Soc. 2009; 50:1840–1846.
17. Leung CK, Mohamed S, Leung KS, et al. Retinal nerve fiber layer measurements in myopia: An optical coherence tomography study. Invest Ophthalmol Vis Sci. 2006; 47:5171–5176.
 XML Download