Abstract
Purpose
To compare therapeutic outcome of intravitreal bevacizumab in treating macular edema between major and macular branch retinal vein occlusion (BRVO).
Methods
This retrospective, observational study included 58 eyes from 58 patients with macular edema secondary to BRVO. All patients were treated with intravitreal bevacizumab injection at baseline, followed by further injections as required with monthly follow-up. Central foveal thickness and best-corrected visual acuity (BCVA) were evaluated after treatment between major and macular BRVO during 12 months of follow-up.
Results
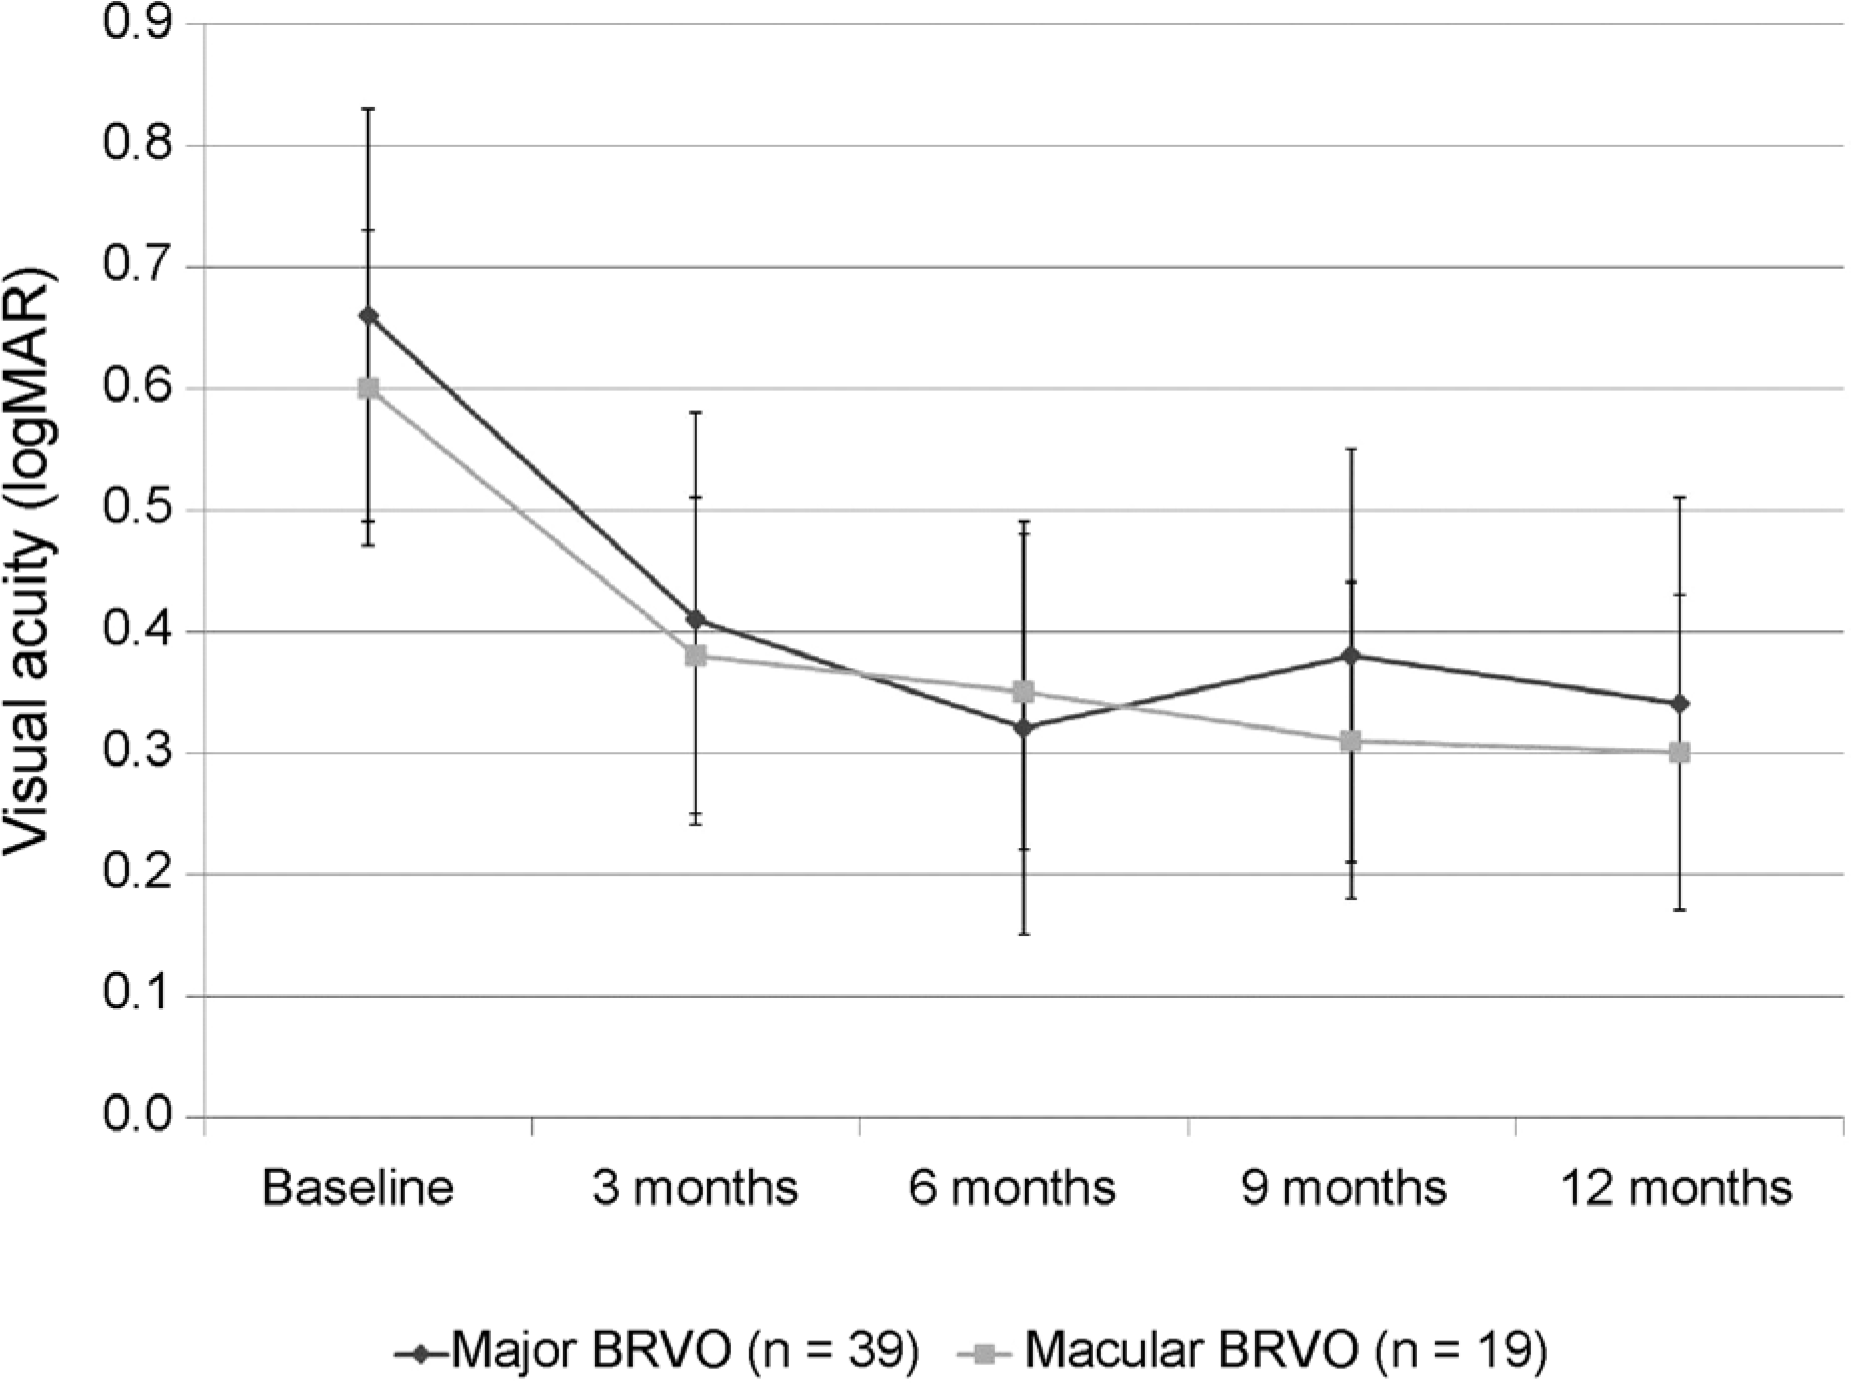
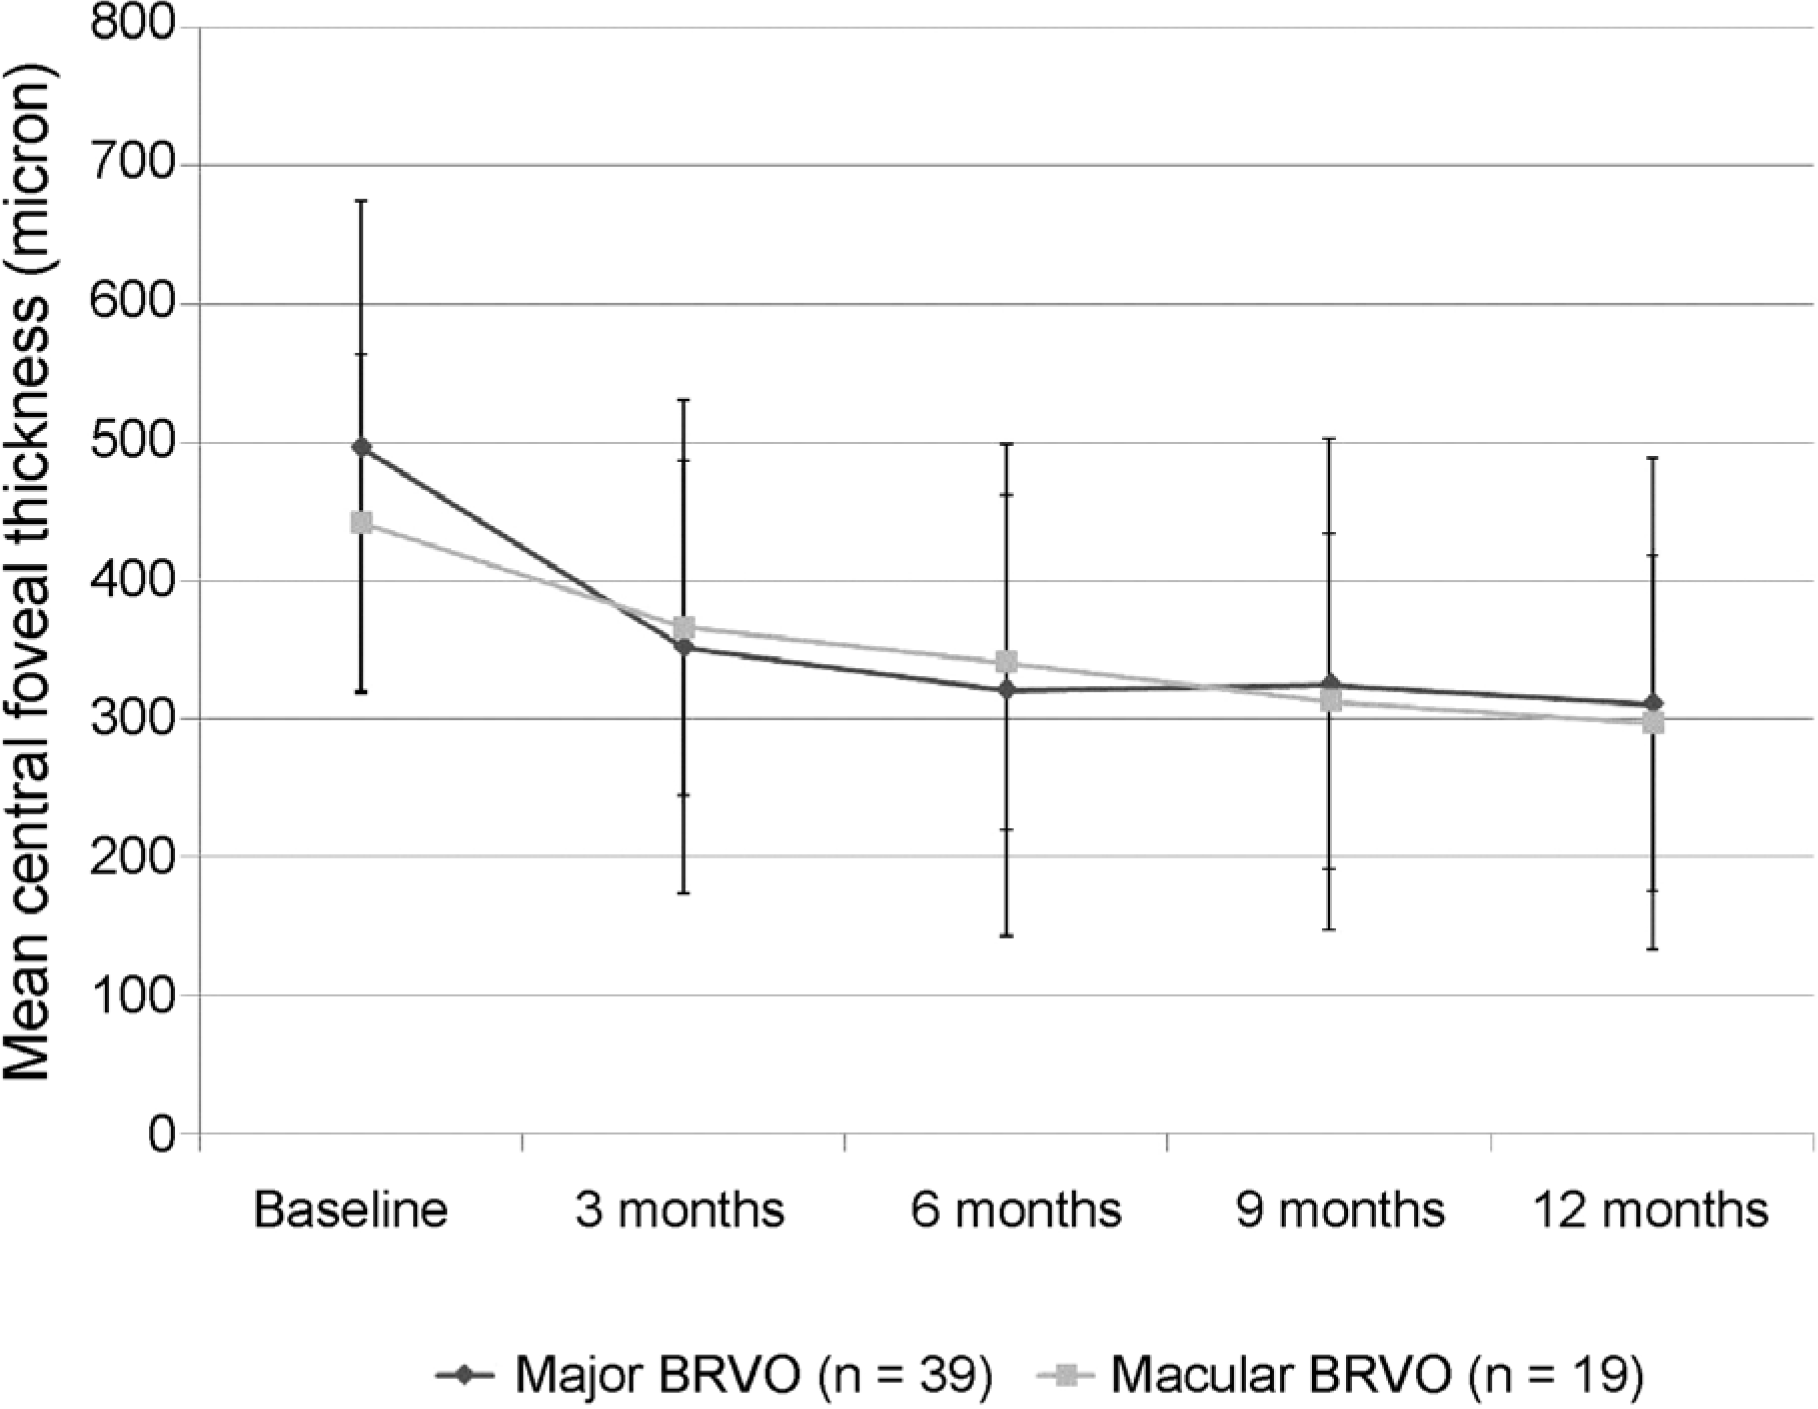
The mean best-corrected visual acuity (BCVA) in the major BRVO group (39 eyes), expressed as the logarithm of the minimum angle of resolution (logMAR), decreased from 0.66 ± 0.47 to 0.34 ± 0.28 after 12 months of treatment (p = 0.011). Similarly, in the macular BRVO group (19 eyes), the BCVA decreased from 0.60 ± 0.41 to 0.30 ± 0.22 (p = 0.014). The central foveal thickness decreased in the major BRVO group from 498.5 ± 194.3 µm to 311.3 ± 178.5 µm and in the macular BRVO group from 442.4 ± 155.8 µm to 297.2 ± 145.7 µm (p = 0.004 and 0.002, respectively). However, there was no significant difference between the groups with regard to either BCVA improvement or decrease in central foveal thickness. The mean injection number of macular BRVO (2.6 ± 1.6) was significantly lower than that of major BRVO (3.5 ± 1.4, p = 0.021).
Go to : 
References
1. Rogers SL, McIntosh RL, Lim L, et al. Natural history of branch retinal vein occlusion: an evidence-based systematic review. Ophthalmology. 2010; 117:1094–101.e5.

2. Argon laser photocoagulation for macular edema in branch vein occlusion. The Branch Vein Occlusion Study Group. Am J Ophthalmol. 1984; 98:271–82.
3. Cekiç O, Chang S, Tseng JJ, et al. Intravitreal triamcinolone abdominal for treatment of macular edema secondary to branch retinal vein occlusion. Retina. 2005; 25:851–5.
4. Arnarsson A, Stefánsson E. Laser treatment and the mechanism of edema reduction in branch retinal vein occlusion. Invest Ophthalmol Vis Sci. 2000; 41:877–9.
5. Rabena MD, Pieramici DJ, Castellarin AA, et al. Intravitreal abdominal (Avastin) in the treatment of macular edema secondary to branch retinal vein occlusion. Retina. 2007; 27:419–25.
6. Ho M, Liu DT, Lam DS, Jonas JB. Retinal vein occlusions, from basics to the latest treatment. Retina. 2016; 36:432–48.

7. Beaumont PE, Kang HK. Clinical characteristics of retinal venous occlusions occurring at different sites. Br J Ophthalmol. 2002; 86:572–80.

8. McIntosh RL, Rogers SL, Lim L, et al. Natural history of central retinal vein occlusion: an evidence-based systematic review. Ophthalmology. 2010; 117:1113–23.e15.

9. Hayreh SS, Zimmerman MB. Hemicentral retinal vein occlusion: natural history of visual outcome. Retina. 2012; 32:68–76.
10. Hayreh SS, Zimmerman MB. Branch retinal vein occlusion: abdominal history of visual outcome. JAMA Ophthalmol. 2014; 132:13–22.
11. Hayreh SS, Zimmerman MB. Fundus changes in branch retinal vein occlusion. Retina. 2015; 35:1016–27.

12. Campochiaro PA, Bhisitkul RB, Shapiro H, Rubio RG. Vascular endothelial growth factor promotes progressive retinal non-perfusion in patients with retinal vein occlusion. Ophthalmology. 2013; 120:795–802.

13. Park SP, Ahn JK, Mun GH. Aqueous vascular endothelial growth factor levels are associated with serous macular detachment abdominal to branch retinal vein occlusion. Retina. 2010; 30:281–6.
14. Hayreh SS, Zimmerman MB. Fundus changes in central retinal vein occlusion. Retina. 2015; 35:29–42.

15. Noma H, Mimura T, Yasuda K, et al. Intravitreal ranibizumab and aqueous humor factors/cytokines in major and macular branch abdominall vein occlusion. Ophthalmologica. 2016; 235:203–7.
16. Noma H, Funatsu H, Mimura T, et al. Inflammatory factors in abdominal and macular branch retinal vein occlusion. Ophthalmologica. 2012; 227:146–52.
17. Kim M, Kim Y, Lee SJ. Comparison of aqueous concentrations of angiogenic and in fl ammatory cytokines based on optical abdominal tomography patterns of diabetic macular edema. Indian J Ophthalmol. 2015; 63:312–7.
Go to : 
 | Figure 1.Patient's fundus photograph. (A) Fundus photograph of the right eye with superior temporal major branch retinal vein occlusion (BRVO). (B) Fundus photograph of the right eye with macular BRVO. |
 | Figure 2.Changes of best-corrected visual acuity in logarithm of the minimal angle of resolution in eyes with macular edema secondary to branch retinal vein occlusion (BRVO). Although there was a significant improvement during the follow-up period in both major and macular BRVO groups, there was no statistical difference between major and macular BRVO groups in regard to visual outcome. |
 | Figure 3.Changes in central foveal thickness in eyes with macular edema secondary to branch retinal vein occlusion (BRVO). The central foveal thickness was significantly improved after treatment in both groups. However, there was no difference at 12 months between major and macular BRVO groups. |
Table 1.
Baseline clinical characteristics of patients with retinal vein occlusion
| Total (n = 58) | Major BRVO (n = 39) | Macular BRVO (n = 19) | p-value | |
|---|---|---|---|---|
| Age (years ± SD) | 59.2 ± 6.4 | 59.6 ± 7.4 | 58.4 ± 8.6 | 0.651* |
| (range 40–81) | ||||
| Gender (n, %) | ||||
| Male | 25 (43.1) | 16 (41.0) | 9 (47.4) | 0.647† |
| Female | 33 (56.9) | 23 (59.0) | 10 (52.6) | |
| Duration from onset (days ± SD) | 27.5 ± 14.4 | 27.8 ± 18.8 | 26.8 ± 19.5 | 0.542* |
| (range 1–120) | ||||
| Systemic condition (n, %) | ||||
| Arterial hypertension | 42 (72.4) | 28 (71.7) | 14 (73.7) | 0.441† |
| DM | 7 (12.1) | 4 (10.3) | 3 (15.8) | 0.398§ |
| Mean of Baseline BCVA (logMAR) (Snellen equivalent) | 0.64 ± 0.39 | 0.66 ± 0.47 | 0.60 ± 0.41 | 0.269* |
| (range CF–20/25) (20/87) | (20/91) | (20/79) | ||
| Baseline BCVA (logMAR) (n, %) | 0.946§ | |||
| <0.40 (20/40) | 12 (20.7) | 8 (20.5) | 4 (21.1) | |
| 0.40 (20/40) to 1.0 (20/200) | 26 (44.8) | 17 (43.6) | 9 (47.4) | |
| >1.0 (20/200) | 20 (35.5) | 14 (35.9) | 6 (31.5) | |
| FAG finding‡ | 0.755† | |||
| Ischemic type | 24 (58.5%) | 16 (59.3%) | 8 (57.1%) | |
| Perfused type | 17 (41.5%) | 11 (40.7%) | 6 (42.9%) | |
| Mean baseline central macular thickness ± SD (μ m) | 479.6 ± 188.1 | 498.5 ± 194.3 | 442.4 ± 155.8 | 0.214* |
| Macular edema type (n, %) | 0.028§ | |||
| Combined with serous retinal detachment | 24 (41.4) | 20 (51.3) | 4 (21.1) | |
| Without serous retinal detachment | 34 (58.6) | 19 (48.7) | 15 (78.9) |
BRVO = branch retinal vein occlusion; SD = standard deviation; DM = diabetes mellitus; BCVA = best corrected visual acuity; logMAR = logarithm of the minimum angle of resolution; CF = counting finger; FAG = fluorescein angiography.
Table 2.
12 months results after anti-vascular endothelial growth factor treatment for branch retinal vein occlusion
| Major BRVO (n = 39) | Macular BRVO (n = 19) | p-value | |
|---|---|---|---|
| logMAR at 12 months (Snellen equivalent) | 0.34 ± 0.28 (20/43) | 0.30 ± 0.22 (20/39) | 0.672* |
| Mean logMAR change from baseline | –0.32 | –0.30 | 0.366* |
| BCVA changes (n, %) | |||
| Improved more than 3 lines (improved ≥ logMAR 0.3) | 17 (43.6) | 6 (31.5) | 0.624† |
| Mean central foveal thickness at 12 months (μ m) | 311.3 ± 178.5 | 297.2 ± 145.7 | 0.254* |
| Mean central foveal thickness changes from baseline (μ m) | –187.2 | –145.2 | 0.182* |
| Number of bevacizumab injections | 3.5 ± 1.4 | 2.6 ± 1.6 | 0.021* |
| Baseline BCVA ≤ 20/100 (n = 20) | 3.7 ± 1.5 | 2.8 ± 1.4 | 0.043* |
| Baseline BCVA > 20/100 (n = 38) | 3.4 ± 1.7 | 2.3 ± 1.5 | 0.017* |


 PDF
PDF ePub
ePub Citation
 Print
Print


 XML Download