Abstract
Purpose
To compare the differences of parameters of 9.3 mm and 8.8 mm rigid gas permeable lenses (RGP lenses) that were prescribed by trial lens fitting.
Methods
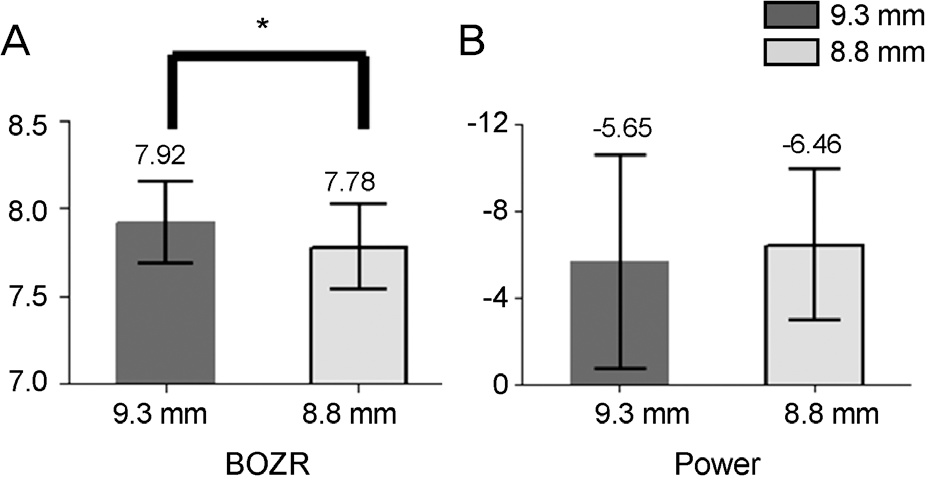
Ninety-three eyes of 49 patients were prescribed RGP contact lenses (YK spherical lens, Lucid Korea, Bonghwa, Korea) by a single ophthalmologist at the same hospital. We analyzed the differences of parameters of 9.3 mm and 8.8 mm rigid gas permeable lenses (RGP lenses) that were prescribed by trial lens fitting. Steep keratometric value (Ks), flat keratometric val-ue (Kf), and corneal astigmatism (Kast) were measured by keratometer. Simulated steep keratometric value (Sim Ks), simulated flat keratometric value (Sim Kf), simulated corneal astigmatism (Sim Kast), white to white corneal diameter (WTW), and eccen-tricity were measured by corneal topography. We also analyzed the differences of back optic zone radius (BOZR) and lens pow-er between the two groups.
Results
In this study, 40 eyes wearing 8.8 mm lenses and 53 eyes wearing 9.3 mm lenses were included. Keratometric value and eccentricity were significantly higher in the 8.8 mm lens group, while WTW and BOZR were significantly lower. Corneal as-tigmatism (Kast, Sim Kast) and lens power were not significantly different between the groups.
Go to : 
References
1. Filipecka K, Budaj M, Miskowiak B. . Comparison of occur-rence of free volumes for rigid gas permeable and soft contact lenses. Polim Med. 2015; 45:31–5.
2. Jones L, Woods CA, Efron N. Life expectancy of rigid gas per-meable and high water content contact lenses. CLAO J. 1996; 22:258–61.
3. Forister JF, Forister EF, Yeung KK. . Prevalence of contact lens-related complications: UCLA contact lens study. Eye Contact Lens. 2009; 35:176–80.

4. Efron N, Morgan PB, Woods CA. International Contact Lens Prescribing Survey Consortium. International survey of rigid con-tact lens fitting. Optom Vis Sci. 2013; 90:113–8.
5. Bennett ES, Henry VA. Clinical Manual of Contact Lenses. 4th ed. Philadelphia: Lippincott Williams & Wilkins;2014. p. 112–26.
6. Cardona G, Isern R. Topography-based RGP lens fitting in normal corneas: the relevance of eyelid and tear film attributes. Eye Contact Lens. 2011; 37:359–64.

7. Lee DH. Basic fitting of RGP contact lens. The Korean Contact Lens Study Society. ed. Lens: Principles and practice, 1st ed. Paju: Kunja;2015. v.1:p. chap. 7.
8. Jeong SK, Lemke BN, Dortzbach RK. . The Asian upper eye-lid: an anatomical study with comparison to the Caucasian eyelid. Arch Ophthalmol. 1999; 117:907–12.
Go to : 
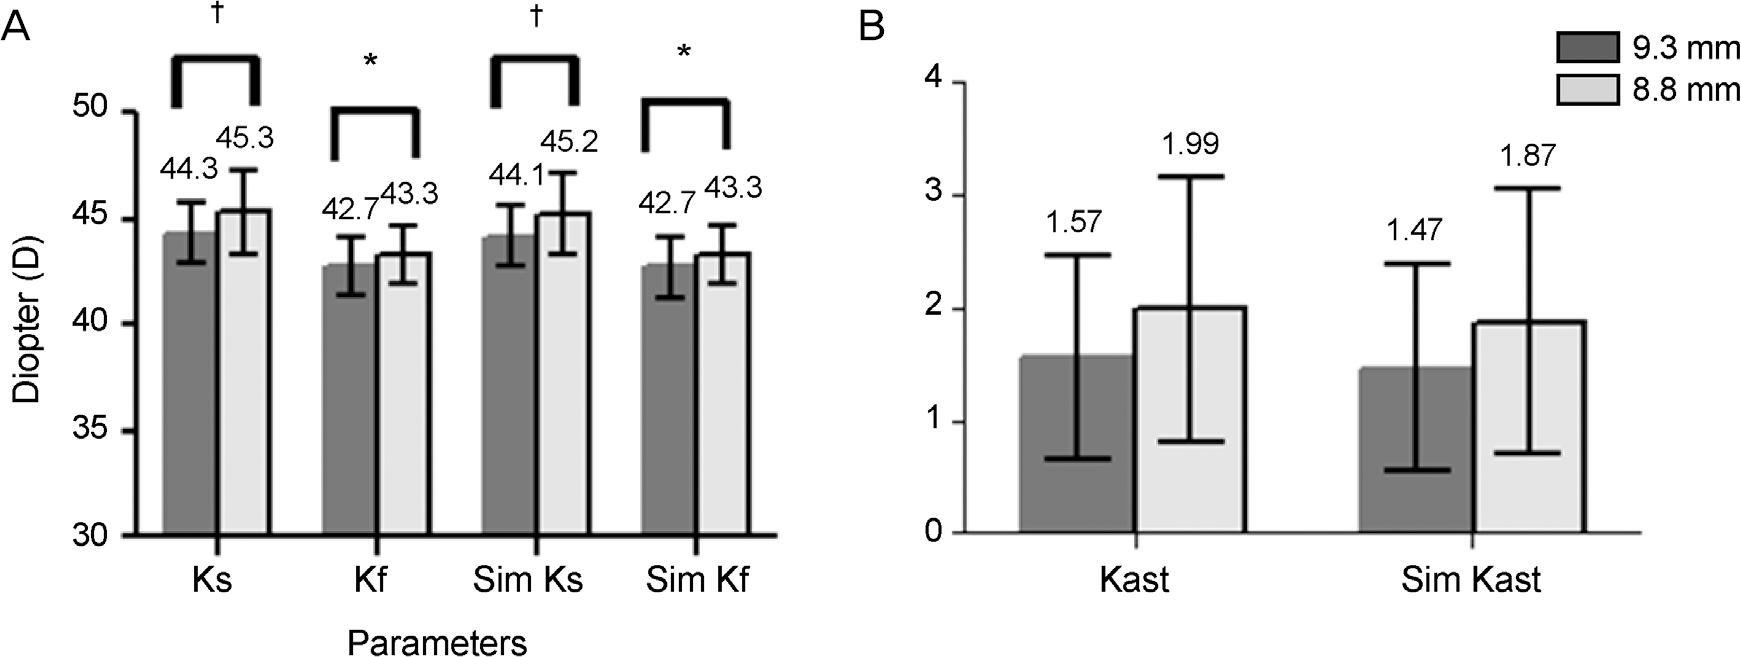
 | Figure 1.Corneal keratometric value (Ks, Kf, Sim Ks, Sim Kf, Kast, Sim Kast) in 8.8 mm and 9.3 mm lens groups. (A) Corneal kera-tometric value (Ks, Kf, Sim Ks, Sim Kf) is significantly higher in 8.8 mm lens group compared to 9.3 mm lens group (8.8 mm group vs 9.3 mm group; Ks: 45.32 ± 1.96 D vs. 44.34 ± 1.48 D, p = 0.007; Kf: 43.34 ± 1.35 D vs. 42.78 ± 1.34 D, p = 0.05; Sim Ks: 45.21 ± 1.93 D vs. 44.19 ± 1.47 D, p = 0.005; Sim Kf: 43.33 ± 1.36 D vs. 42.73 ± 1.40 D, p = 0.043). (B) Corneal astigma-tism (Kast, Sim Kast) is not significantly different in 2 groups. p-value by independent t-test. Ks, Kf, Kast = steep keratometric value, flat keratometric value, corneal astigmatism measured by keratometer, respectively; Sim Ks, Sim Kf, Sim Kast = simulated steep keratometric value, simulated flat keratometric value, simulated corneal astigmatism measured by corneal topographer, respectively. * p < 0.05, † p < 0.01. |
 | Figure 2.White to white corneal diameter (WTW) and Eccentricity in 8.8 mm and 9.3 mm lens groups. (A) WTW is significantly lower in 8.8 mm lens group (11.64 ± 0.42 mm vs. 12.11 ± 0.58 mm, p < 0.001). (B) Eccentricity is significantly higher in 8.8 mm lens group (0.54 ± 0.15 vs. 0.47 ± 0.13, p = 0.011). p-value by independent t-test. * p < 0.05; † p < 0.01. |


 PDF
PDF ePub
ePub Citation
 Print
Print


 XML Download