Abstract
Purpose
To investigate the influence of retinal nerve fiber layer (RNFL) thickness on visual acuity and visual field in patients with bilateral temporal optic atrophy.
Methods
Patients with characteristic features of gradual visual loss and temporal atrophy of both optic nerves were enrolled in this study. Among the patients, RNFL thickness of each area was measured with optical coherence tomography, and its influence on the best corrected visual acuity, mean deviation and pattern standard deviation calculated from the refractive test and Humphrey visual field test was analyzed.
Results
The present study included 13 patients with bilateral temporal optic atrophy (26 eyes) and 13 normal controls (26 eyes). Optical coherence tomography was performed to calculate RNFL thickness in the 52 eyes. Among 26 eyes of patients with bilateral temporal optic atrophy, the Humphrey visual field test was performed to calculate the mean deviation and pattern standard deviation. The mean age in the patient group was 66.0 ± 12.3 years (37‒80 years), and 8 (30.8%) patients were male and 18 (69.2%) female. The mean best corrected visual acuity was 30/50 (20/200‒20/20). Simple regression analysis showed that a thinner temporal RNFL thickness was correlated with a lower the best corrected visual acuity (p = 0.015). The mean deviation was low when inferotemporal RNFL was thin (p = 0.005). Pattern standard deviation was high when inferotemporal (p = 0.003), inferonasal (p = 0.04) and nasal (p = 0.008) RNFLs were thin.
Conclusions
Inferotemporal RNFL thickness was significantly correlated with best corrected visual acuity, mean deviation and pattern standard deviation of automated visual field test in patients with bilateral temporal optic neuropathy. Optical coherence tomography can be further used to estimate visual acuity and visual field defects in patients with optic atrophy.
Go to : 
References
1. Oluleye TS, Ajaiyeoba AI, Fafowora OF, Olusanya BA. The abdominal of optic atrophy in Nigerians-a general hospital clinic study. Int J Clin Pract. 2005; 59:950–2.
3. Quigley HA, Anderson DR. The histologic basis of optic disk pallor in experimental optic atrophy. Am J Ophthalmol. 1977; 83:709–17.

4. Soltan-Sanjari M, Parvaresh MM, Maleki A, et al. Correlation between retinal nerve fiber layer thickness by optical coherence abdominal and perimetric parameters in optic atrophy. J Ophthalmic Vis Res. 2008; 3:91–4.
5. Zhang Y, Huang H, Wei S, et al. Characterization of retinal nerve fiber layer thickness changes associated with Leber's hereditary optic neuropathy by optical coherence tomography. Exp Ther Med. 2014; 7:483–7.

6. Kim TW, Hwang JM. Stratus OCT in dominant optic atrophy: abdominals differentiating it from glaucoma. J Glaucoma. 2007; 16:655–8.
7. Cardell JD. The aetiology of optic atrophy. Med Press. 1948; 219:139–41.
8. Liu T, Bi H, Wang X, et al. Change of retinal nerve fiber layer thickness in patients with nonarteritic inflammatory anterior abdominal optic neuropathy. Neural Regen Res. 2012; 7:2778–83.
9. Saxena R, Bandyopadhyay G, Singh D, et al. Evaluation of changes in retinal nerve fiber layer thickness and visual functions in cases of optic neuritis and multiple sclerosis. Indian J Ophthalmol. 2013; 61:562–6.

10. Mikelberg FS, Drance SM, Schulzer M, et al. The normal human optic nerve. Axon count and axon diameter distribution. Ophthalmology. 1989; 96:1325–8.
11. Park SW, Hwang JM. Optical coherence tomography shows early loss of the inferior temporal quadrant retinal nerve fiber layer in autosomal dominant optic atrophy. Graefes Arch Clin Exp Ophthalmol. 2014; 253:135–41.

12. Jansonius NM, Nevalainen J, Selig B, et al. A mathematical abdominal of nerve fiber bundle trajectories and their variability in the human retina. Vision Res. 2009; 49:2157–63.
13. Sadun AA, Win PH, Ross-Cisneros FN, et al. Leber's hereditary optic neuropathy differentially affects smaller axons in the optic nerve. Trans Am Ophthalmol Soc. 2000; 98:223–32. discussion 232–5.
14. Pan BX, Ross-Cisneros FN, Carelli V, et al. Mathematically abdominal the involvement of axons in Leber's hereditary optic neuropathy. Invest Ophthalmol Vis Sci. 2012; 53:7608–17.
15. Rebolleda G, Sánchez-Sánchez C, González-López JJ, et al. Papillomacular bundle and inner retinal thicknesses correlate with visual acuity in nonarteritic anterior ischemic optic neuropathy. Invest Ophthalmol Vis Sci. 2015; 56:682–92.

16. Kobayashi W, Kunikata H, Omodaka K, et al. Correlation of abdominal nerve fiber bundle thickness with central visual function in open-angle glaucoma. J Ophthalmol. 2015; 2015:460918.
17. Cho KH, Ahn SJ, Jung C, et al. Ischemic injury of the abdominal bundle is a predictive marker of poor vision in eyes with branch retinal artery occlusion. Am J Ophthalmol. 2015; 162:107–20.e2.
Go to : 
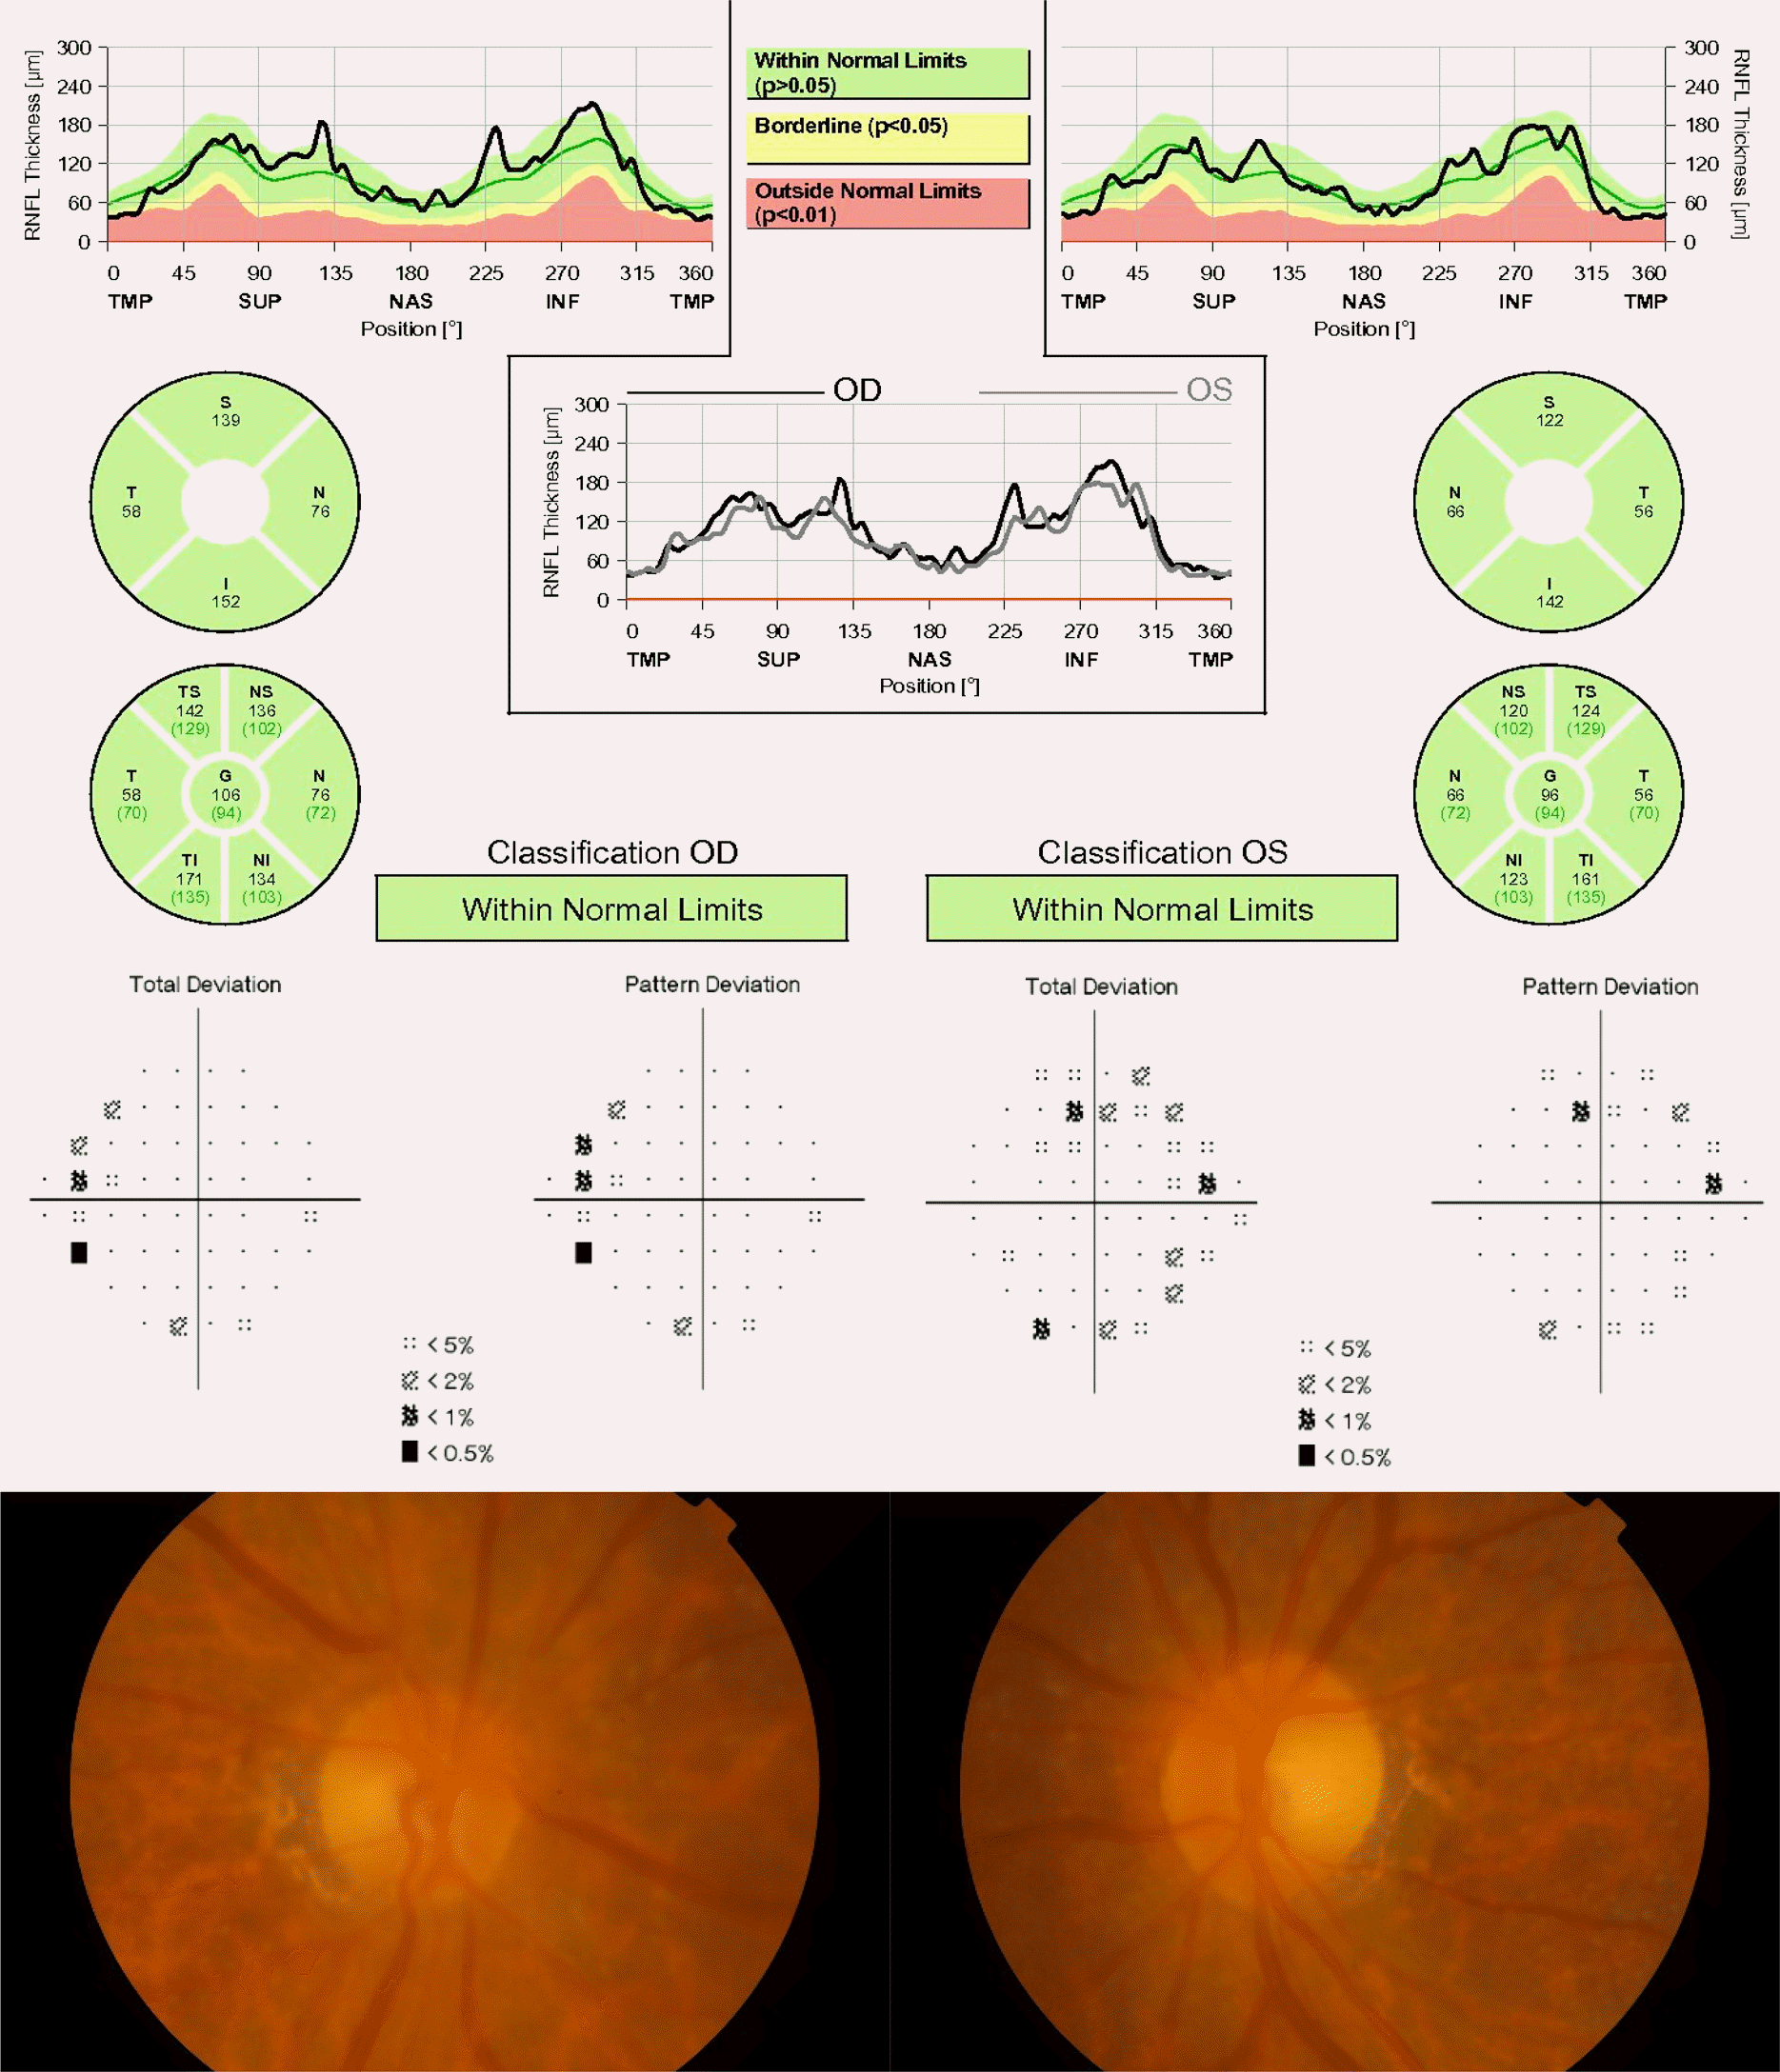
 | Figure 1.Representative figure of a 77-year-old male with visual acuity of 14/20 in the right eye and 18/20 in the left eye, showing a mild decrease in the retinal nerve fiber layer (RNFL) thickness. TMP = temporal; SUP = superior; NAS = nasal; INF = inferior; OD = oculus dexter; OS = oculus sinister; S = superior; N = nasal; I = inferior; T = temporal; TS = superotemporal; NS = superonasal; G = general; TI = inferotemporal; NI = inferonasal. |
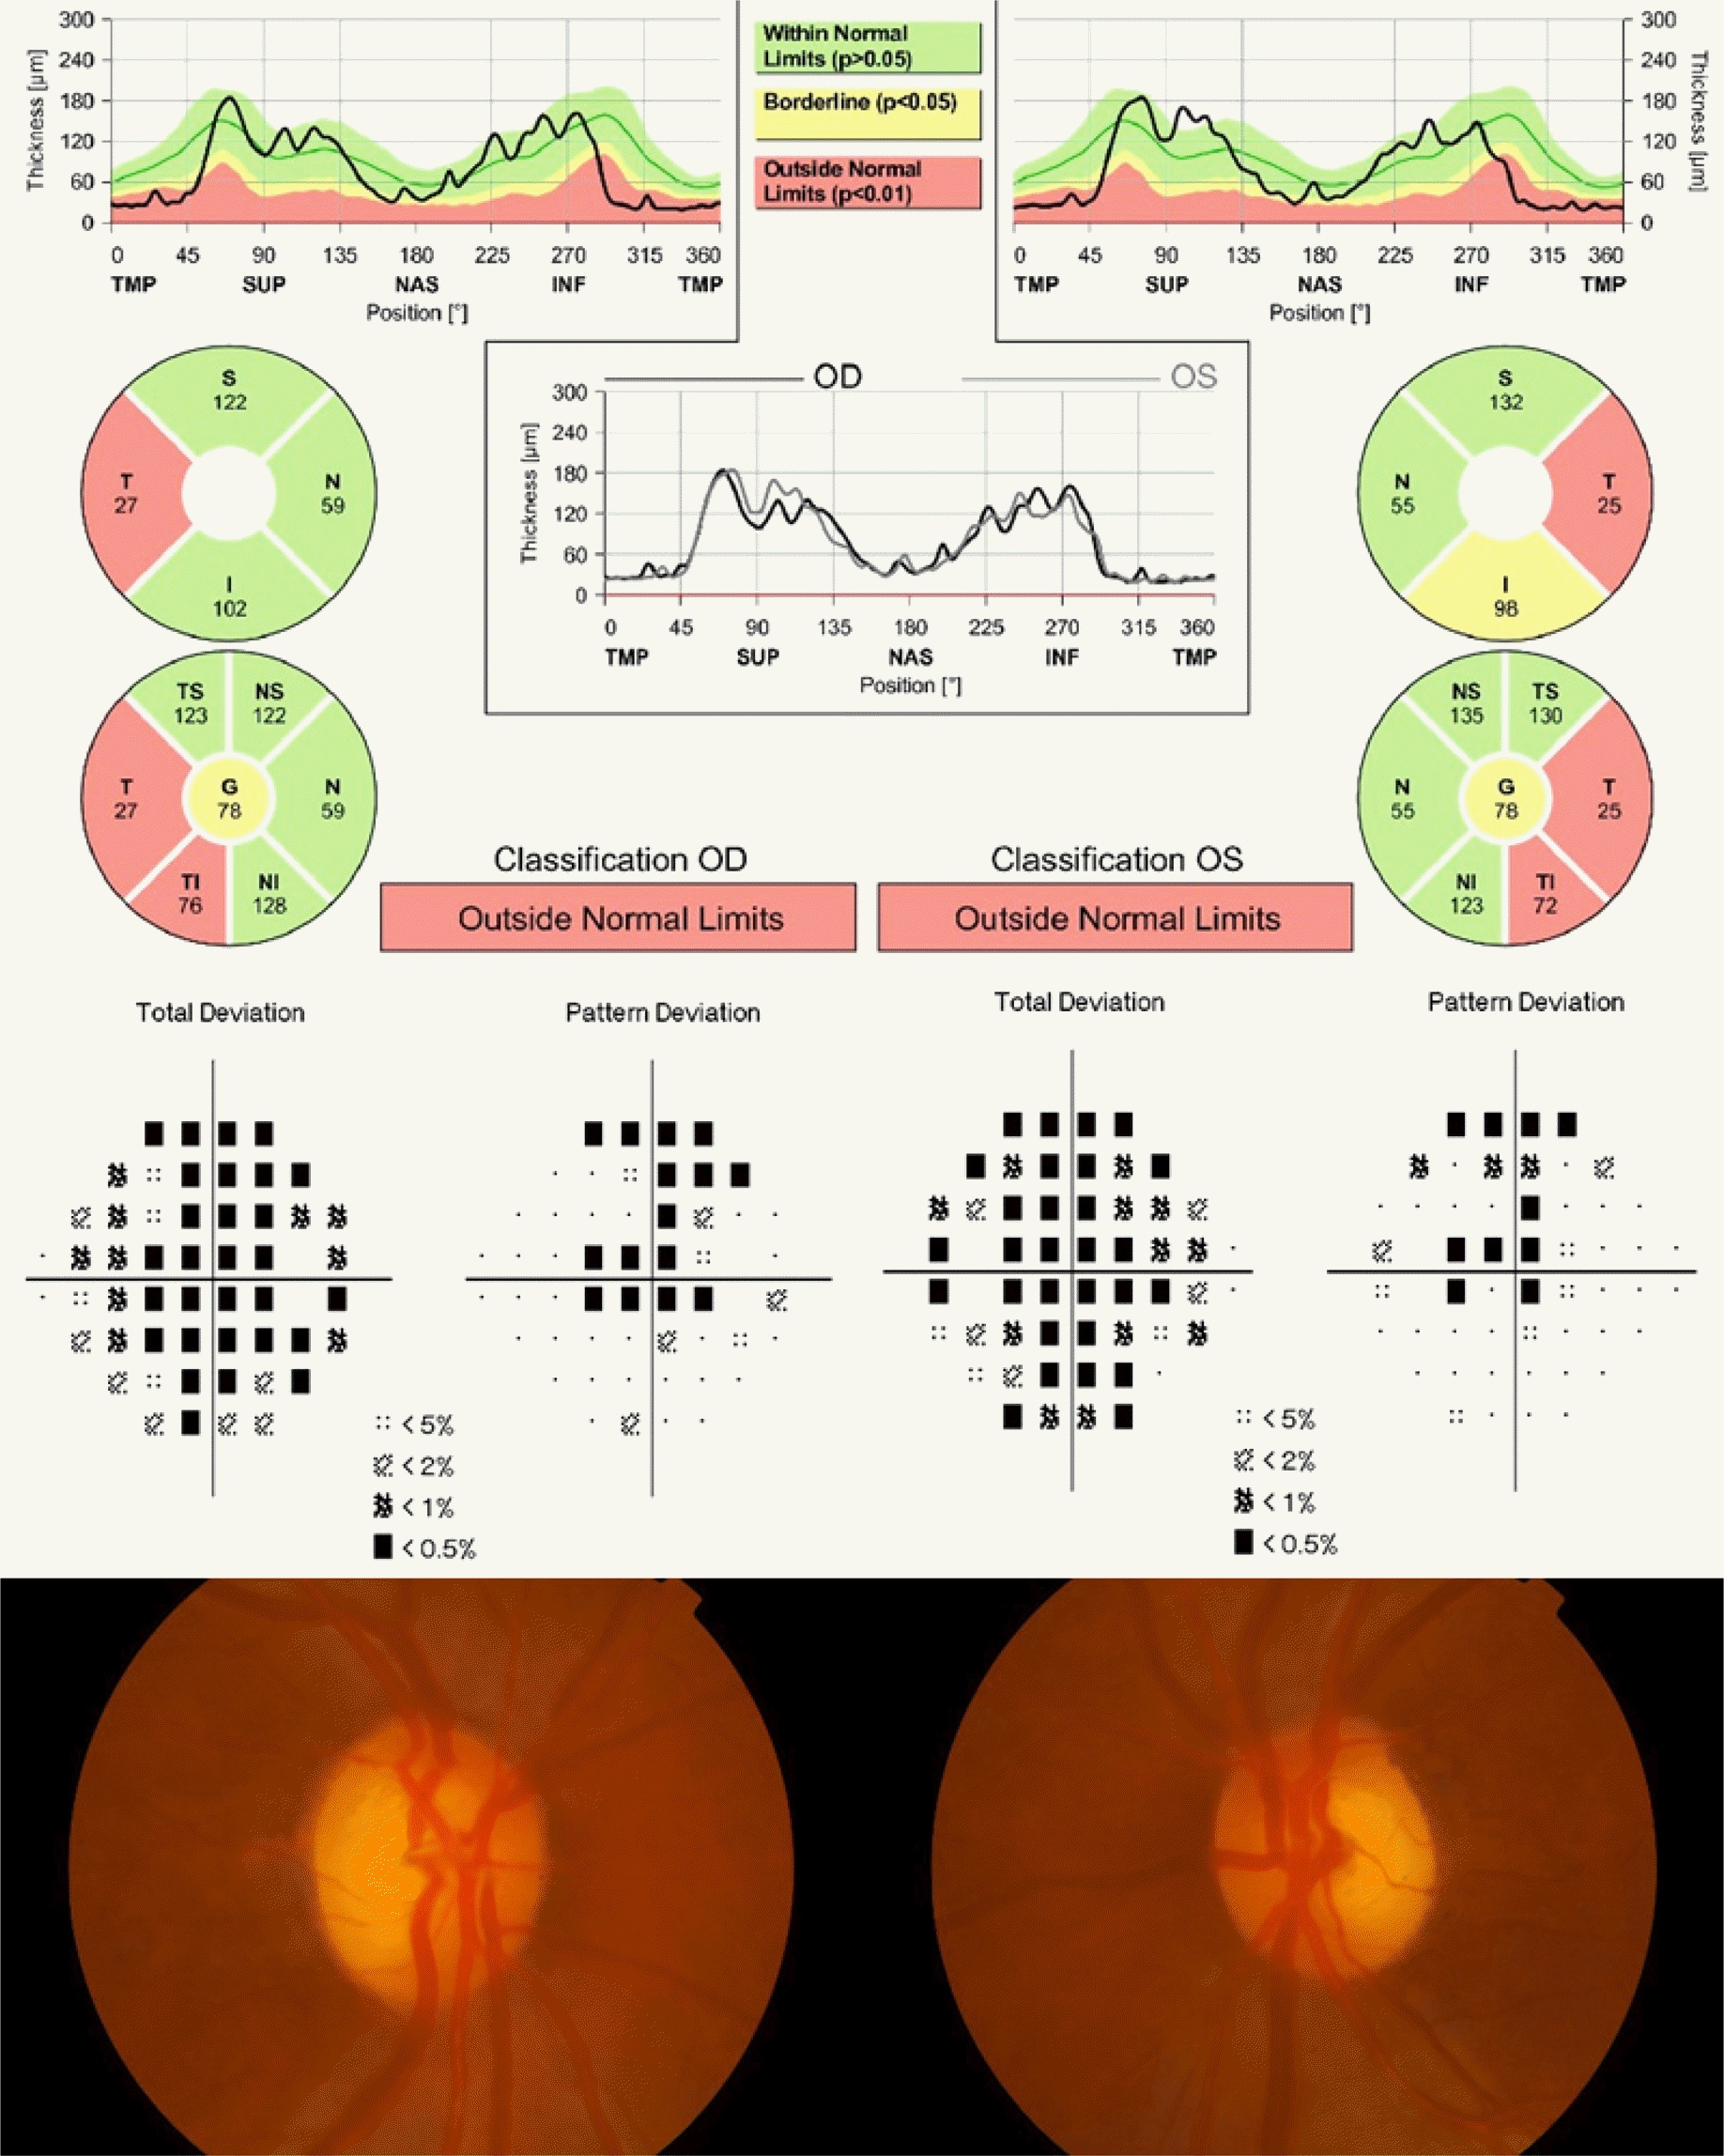
 | Figure 2.Representative figure of a 60-year-old female with a visual acuity of 3/20 in the right eye and 6/20 in the left eye, showing a severe decrease in the retinal nerve fiber layer (RNFL) thickness. TMP = temporal; SUP = superior; NAS = nasal; INF = inferior; OD = oculus dexter; OS = oculus sinister; S = superior; N = nasal; I = inferior; T = temporal; TS = superotemporal; NS = superonasal; G = general; TI = inferotemporal; NI = inferonasal. |
 | Figure 3.Scatterplots showing each linear regression analysis model.(A) Relationship between temporal retinal nerve fiber layer thickness (RNFLT) and best corrected visual acuity (BCVA): thinner temporal RNFLT was correlated with lower BCVA. (B) Relationship between inferotemporal RNFLT and mean deviation (MD): MD was low when inferotemporal RNFLT was thin. (C) Relationship between inferotemporal RNFLT and pattern standard deviation (PSD): PSD was high when inferotemporal RNFLT was thin. (D) Relationship between inferonasal RNFLT and PSD: PSD was high when inferonasal RNFLT was thin. (E) Relationship between nasal RNFLT and PSD: PSD was high when nasal RNFLT was thin. |
Table 1.
Demographics of bilateral optic atrophy patients
| Characteristics | Value |
|---|---|
| Number of subjects | 13 |
| Number of eyes | 26 |
| Sex (male/female) | 4/9 |
| Age (years) | 66.00 ± 12.26 (37–80) |
| BCVA (decimal) | 0.58 (0.1–1.0) |
| IOP (mm Hg) | 14.35 ± 1.67 (10–17) |
Table 2.
Retinal nerve fiber layer (RNFL) parameters and analysis using a mixed effect model
Table 3.
Spearman correlation coefficient between the best corrected visual acuity and retinal nerve fiber layer (RNFL) thickness of each region
| Parameters | R | p-value |
|---|---|---|
| Superotemporal RNFLT | 0.089 | 0.664 |
| Temporal RNFLT | −0.451 | 0.021 |
| Inferotemporal RNFLT | −0.201 | 0.325 |
| Inferonasal RNFLT | 0.177 | 0.386 |
| Nasal RNFLT | 0.005 | 0.982 |
| Superonasal RNFLT | 0.166 | 0.417 |
Table 4.
Pearson correlation coefficient between the visual field defect parameters and retinal nerve fiber layer (RNFL) thickness of each region


 PDF
PDF ePub
ePub Citation
 Print
Print


 XML Download