Abstract
Purpose
To evaluate diagnostic ability of macular ganglion cell complex (mGCC), macular ganglion cell inner plexiform layer (mGCIPL) measurements in glaucoma using swept source deep range imaging optical coherence tomography (DRI OCT-1, Topcon Co., Tokyo, Japan).
Methods
From August of 2014 to July of 2015, 109 eyes of 109 subjects were assessed for the average thickness and sectional thickness of both mGCC and mGCIPL to determine whether there exists any significant difference among advanced stage glaucoma group, early stage glaucoma group and normal group in Swept source OCT. Comparisons were also made between the above measurements and circumpapillary retinal nerve fiber layer (cpRNFL) thickness measurements in their diagnostic accuracy, sensitivity, and specificity.
Results
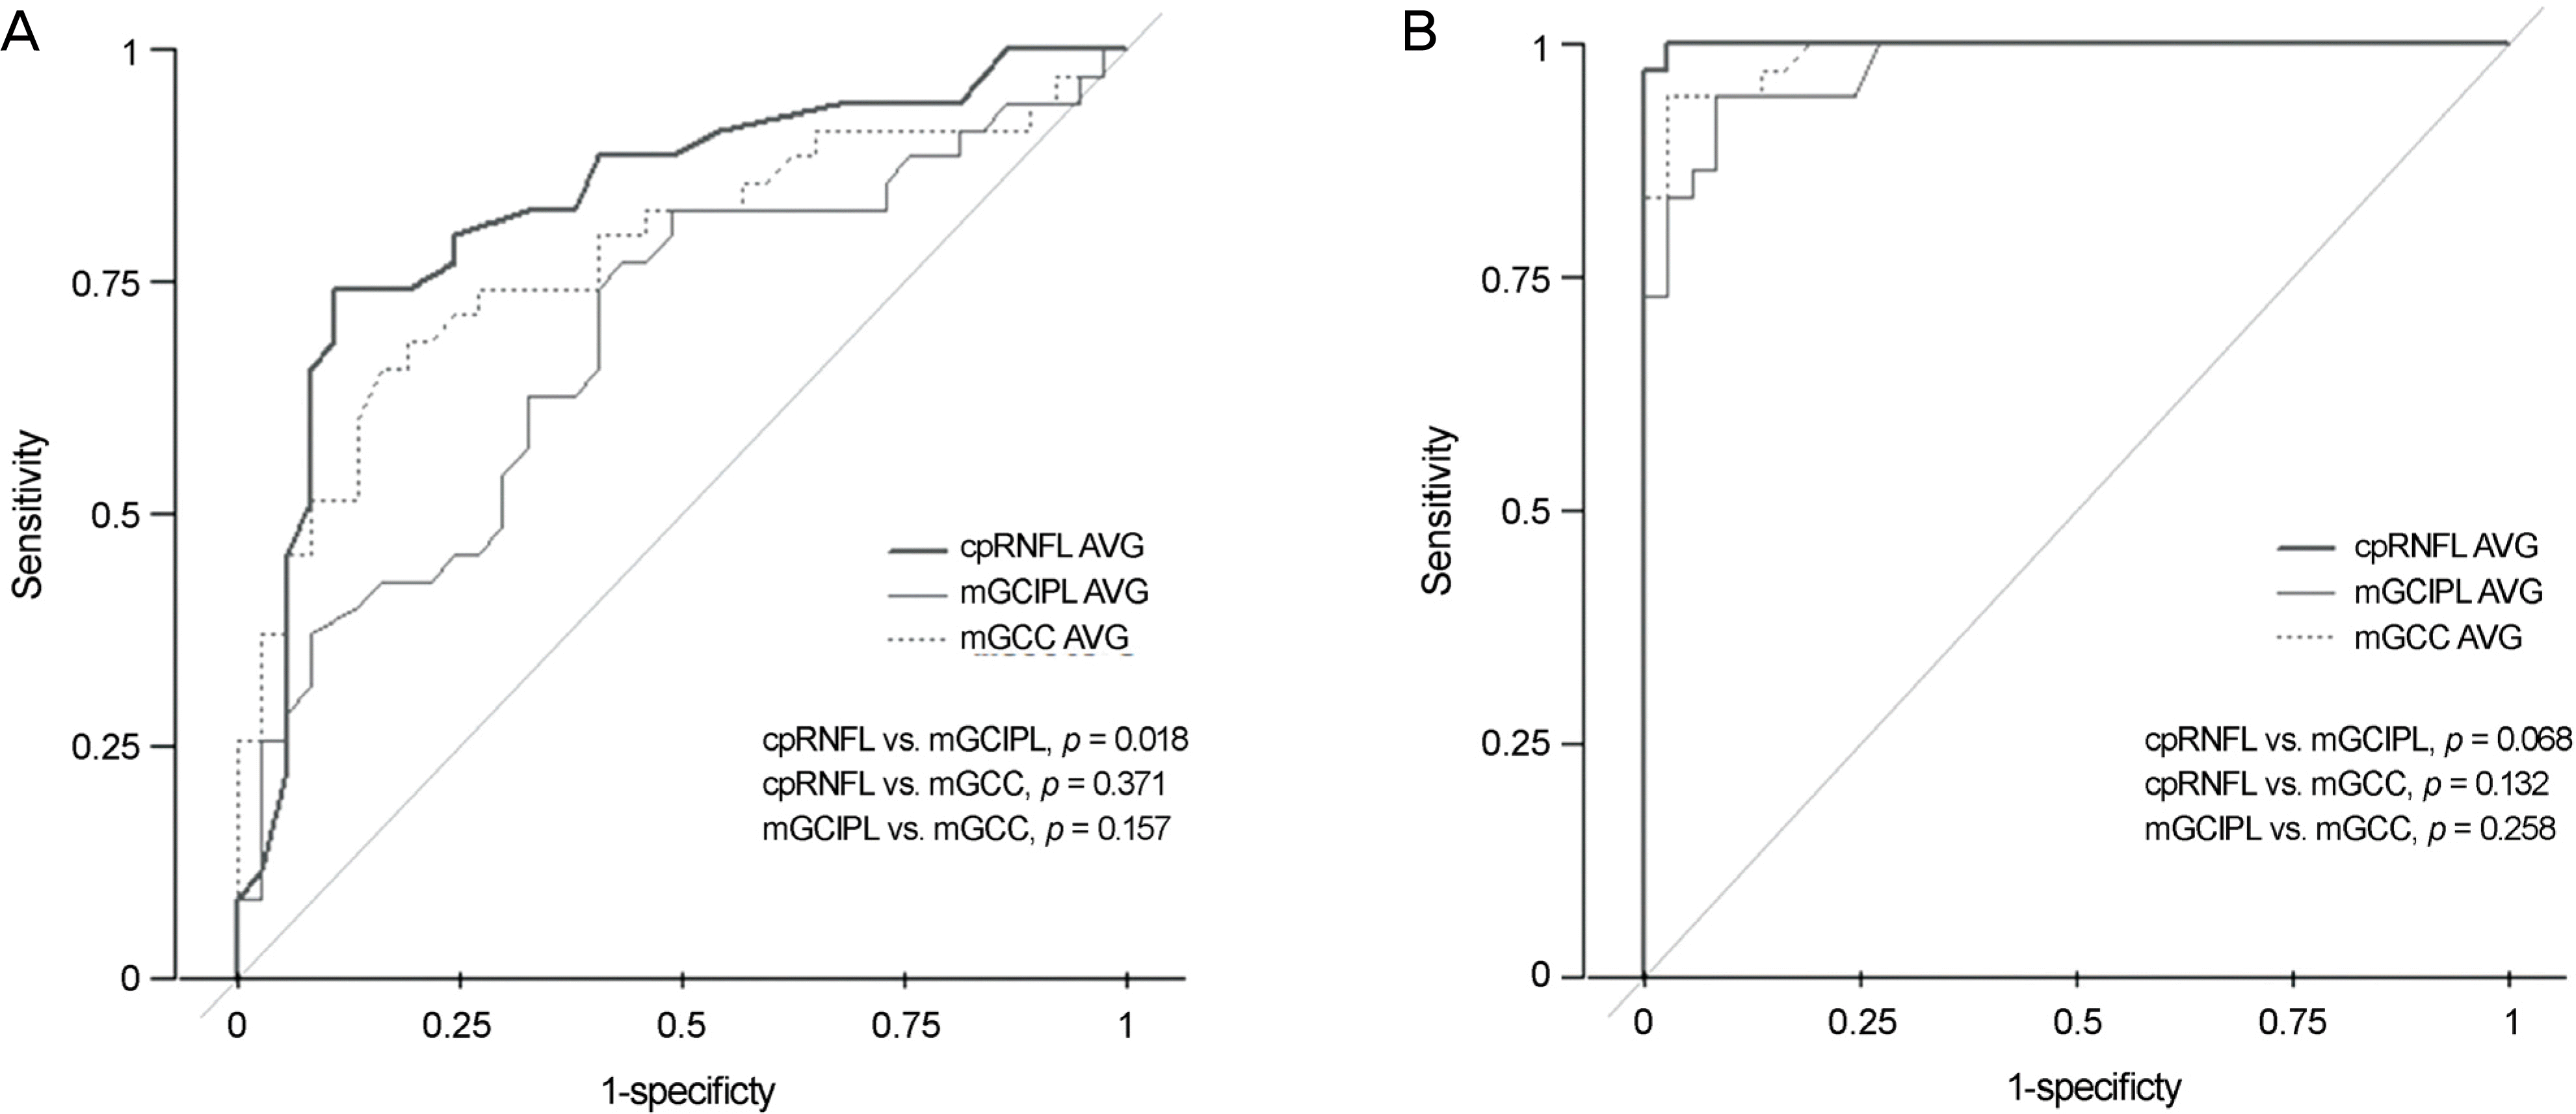
The diagnostic ability of mGCC based-mean thickness value (area under the curve [AUC] = 0.78/ 0.99) in detecting early stage glaucoma group as well as advanced stage group was not significantly different from that of cpRNFL thickness measurement. However, there was a significant difference in thickness between mGCIPL (AUC = 0.70) and cpRNFL in early stage glaucoma groups (p = 0.018). The sensitivities and specificities of mGCC were 0.95/0.97, and those of mGCIPL were 0.92/0.97, respectively.
Conclusions
The two swept source OCT based methods measuring retinal ganglion cell layer thickness appeared to have a good diagnostic accuracy, high sensitivity and specificity in detecting glaucomatous eyes. Nevertheless, of the two methods, mGCC thickness measurement was more efficient in detecting early glaucomatous changes.
References
1. Weinreb RN, Aung T, Medeiros FA. The pathophysiology and treatment of glaucoma: a review. JAMA. 2014; 311:1901–11.
3. Tatham AJ, Weinreb RN, Medeiros FA. Strategies for improving early detection of glaucoma: the combined structure-function index. Clin Ophthalmol. 2014; 8:611–21.
4. Kerrigan-Baumrind LA, Quigley HA, Pease ME, et al. Number of ganglion cells in glaucoma eyes compared with threshold visual field tests in the same persons. Invest Ophthalmol Vis Sci. 2000; 41:741–8.
5. Guedes V, Schuman JS, Hertzmark E, et al. Optical coherence abdominal measurement of macular and nerve fiber layer thickness in normal and glaucomatous human eyes. Ophthalmology. 2003; 110:177–89.
6. Lisboa R, Leite MT, Zangwill LM, et al. Diagnosing preperimetric glaucoma with spectral domain optical coherence tomography. Ophthalmology. 2012; 119:2261–9.

7. Cho JW, Sung KR, Hong JT, et al. Detection of glaucoma by abdominal domain-scanning laser ophthalmoscopy/optical coherence abdominal (SD-SLO/OCT) and time domain optical coherence tomography. J Glaucoma. 2011; 20:15–20.
8. Sung KR, Kim JS, Wollstein G, et al. Imaging of the retinal nerve fibre layer with spectral domain optical coherence tomography for glaucoma diagnosis. Br J Ophthalmol. 2011; 95:909–14.

9. Jeoung JW, Park KH. Comparison of Cirrus OCT and Stratus OCT on the ability to detect localized retinal nerve fiber layer defects in preperimetric glaucoma. Invest Ophthalmol Vis Sci. 2010; 51:938–45.

10. Seong M, Sung KR, Choi EH, et al. Macular and peripapillary abdominall nerve fiber layer measurements by spectral domain optical abdominal tomography in normal-tension glaucoma. Invest Ophthalmol Vis Sci. 2010; 51:1446–52.
11. Schulze A, Lamparter J, Pfeiffer N, et al. Diagnostic ability of abdominall ganglion cell complex, retinal nerve fiber layer, and optic nerve head measurements by Fourier-domain optical coherence tomography. Graefes Arch Clin Exp Ophthalmol. 2011; 249:1039–45.
12. Garas A, Vargha P, Holló G. Diagnostic accuracy of nerve fibre layer, macular thickness and optic disc measurements made with the RTVue-100 optical coherence tomograph to detect glaucoma. Eye (Lond). 2011; 25:57–65.

13. Yang Z, Tatham AJ, Weinreb RN, et al. Diagnostic ability of abdominal ganglion cell inner plexiform layer measurements in glaucoma using swept source and spectral domain optical coherence tomography. PLoS One. 2015; 10:e0125957.
14. Hodapp E, Parrish RK, Anderson DR. Clinical decisions in glaucoma. St. Louis: The CV Mosby Co.;1993. p. 52–61.
15. Zeimer R, Asrani S, Zou S, et al. Quantitative detection of abdominaltous damage at the posterior pole by retinal thickness mapping. A pilot study. Ophthalmology. 1998; 105:224–31.
16. Greenfield DS, Bagga H, Knighton RW. Macular thickness changes in glaucomatous optic neuropathy detected using optical coherence tomography. Arch Ophthalmol. 2003; 121:41–6.

17. Lederer DE, Schuman JS, Hertzmark E, et al. Analysis of macular volume in normal and glaucomatous eyes using optical coherence tomography. Am J Ophthalmol. 2003; 135:838–43.

18. Leung CK, Chan WM, Yung WH, et al. Comparison of macular and peripapillary measurements for the detection of glaucoma: an optical coherence tomography study. Ophthalmology. 2005; 112:391–400.
19. Na JH, Sung KR, Baek S, et al. Detection of glaucoma progression by assessment of segmented macular thickness data obtained using spectral domain optical coherence tomography. Invest Ophthalmol Vis Sci. 2012; 53:3817–26.

20. Mori S, Hangai M, Sakamoto A, Yoshimura N. Spectral-domain optical coherence tomography measurement of macular volume for diagnosing glaucoma. J Glaucoma. 2010; 19:528–34.

21. Lisboa R, Paranhos A Jr, Weinreb RN, et al. Comparison of abdominal spectral domain OCT scanning protocols for diagnosing pre-perimetric glaucoma. Invest Ophthalmol Vis Sci. 2013; 54:3417–25.
22. Cho JW, Sung KR, Lee S, et al. Relationship between visual field sensitivity and macular ganglion cell complex thickness as abdominal by spectral-domain optical coherence tomography. Invest Ophthalmol Vis Sci. 2010; 51:6401–7.
23. Wang M, Hood DC, Cho JS, et al. Measurement of local retinal ganglion cell layer thickness in patients with glaucoma using abdominal-domain optical coherence tomography. Arch Ophthalmol. 2009; 127:875–81.
24. Mwanza JC, Durbin MK, Budenz DL, et al. Glaucoma diagnostic accuracy of ganglion cell-inner plexiform layer thickness: abdominal with nerve fiber layer and optic nerve head. Ophthalmology. 2012; 119:1151–8.
25. Takayama K, Hangai M, Durbin M, et al. A novel method to detect local ganglion cell loss in early glaucoma using spectral-domain optical coherence tomography. Invest Ophthalmol Vis Sci. 2012; 53:6904–13.

26. Choi YJ, Jeoung JW, Park KH, Kim DM. Glaucoma detection abdominal of ganglion cell-inner plexiform layer thickness by spectral-abdominal optical coherence tomography in high myopia. Invest Ophthalmol Vis Sci. 2013; 54:2296–304.
27. Kim YJ, Kang MH, Cho HY, et al. Comparative study of macular ganglion cell complex thickness measured by spectral-domain abdominalal coherence tomography in healthy eyes, eyes with abdominal glaucoma, and eyes with early glaucoma. Jpn J Ophthalmol. 2014; 58:244–51.
28. Lee J, Hangai M, Kimura Y, et al. Measurement of macular abdominal cell layer and circumpapillary retinal nerve fiber layer to abdominal paracentral scotoma in early glaucoma. Graefes Arch Clin Exp Ophthalmol. 2013; 251:2003–12.
29. Tan O, Li G, Lu AT, et al. Mapping of macular substructures with optical coherence tomography for glaucoma diagnosis. Ophthalmology. 2008; 115:949–56.

30. Curcio CA, Allen KA. Topography of ganglion cells in human retina. J Comp Neurol. 1990; 300:5–25.

31. Garcia-Martin E, Pinilla I, Idoipe M, et al. Intra and interoperator reproducibility of retinal nerve fibre and macular thickness abdominals using Cirrus Fourier-domain OCT. Acta Ophthalmol. 2011; 89:e23–9.
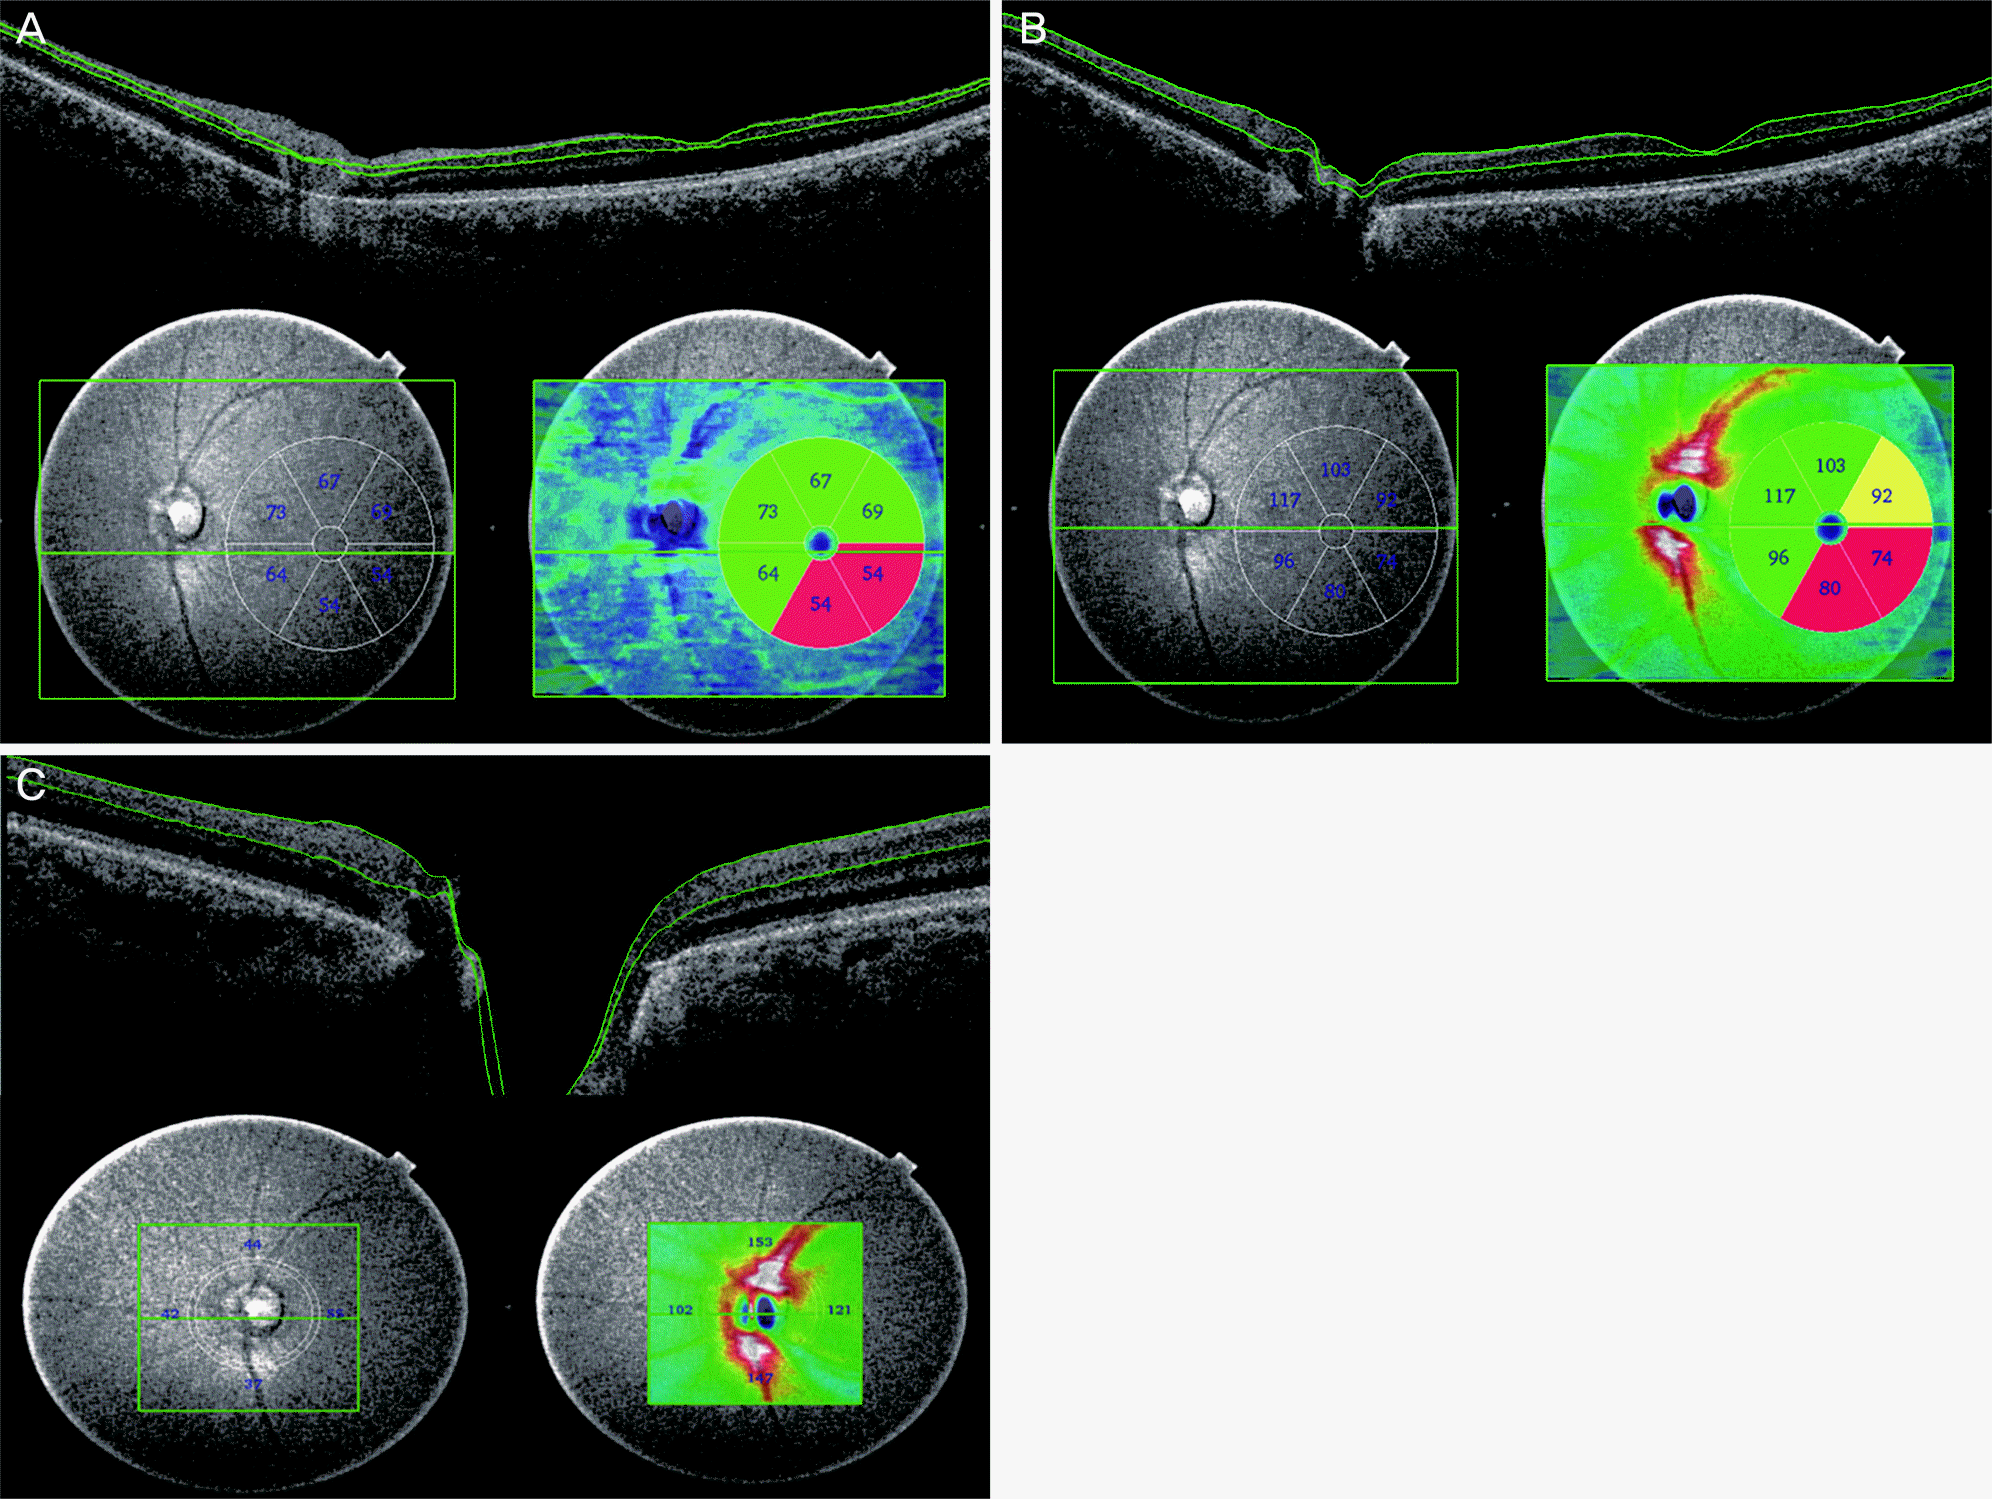
Figure 1.
Macular and optic nerve cube scan using deep range imaging swept source optic coherence tomography (DRI OCT-1; Topcon Corp., Tokyo, Japan). (A) Macular ganglion cell layer and inner plexiform layer (mGCIPL), (B) macular ganglion cell complex (mGCC), (C) circumpapillary retinal nerve fiber layer (cpRNFL).

Figure 2.
Comparison of area under the curve (AUC) of retinal nerve fiber layer (RNFL), macular ganglion cell inner plexiform layer (mGCIPL) and macular ganglion cell complex (mGCC) for distinguishing glaucoma from normal group. (A) Receiver operating characteristics (ROC) curve for detection of early glaucoma, (B) curve for detection of advanced glaucoma. p-values for comparing the AUCs were calculated by Delong's method. cpRNFL = circumpapilary retinal nerve fiber layer; AVG = average.

Table 1.
Characteristic per groups
Values are presented as mean ± SD unless otherwise indicated. p-values were calculated by analysis of variance (ANOVA) assuming unequal variance for continuous variables and Chi-square test for categorical variables. Posthoc comparison by Scheffe's method: i-j means that i-th group and j-th group had significant differences (i, j = 1, 2, 3; Group 1 = Normal, Group 2 = Early glaucoma, Group 3 = Advanced glaucoma).
Table 2.
Circumpapillary retinal nerve fiber layer (cpRNFL), macular ganglion cell inner plexiform layer (mGCIPL), macular ganglion cell complex (mGCC) thickness (μ m) per groups
| Variable | Normal (n = 37) | Early glaucoma (n = 35) | Advanced glaucoma (n = 37) | Total (n = 109) | Comparison by ANOVA* (p-value) |
Posthoc comparison (p-value)† |
||
|---|---|---|---|---|---|---|---|---|
| Normal vs. Early glaucoma | Normal vs. Advanced glaucoma | Early glaucoma vs. Advanced glaucoma | ||||||
| cpRNFL thickness (μ m) | ||||||||
| Average | 100.3 ± 11.2 | 85.9 ± 9.5 | 57.8 ± 13.2 | 81.3 ± 21.2 | <0.001 | <0.001 | <0.001 | <0.001 |
| Superior | 125.1 ± 15.4 | 100.4 ± 17.1 | 65.6 ± 18.9 | 97.0 ± 30.1 | <0.001 | <0.001 | <0.001 | <0.001 |
| Inferior | 128.8 ± 22.2 | 107.4 ± 22.5 | 65.8 ± 19.1 | 100.5 ± 33.9 | <0.001 | <0.001 | <0.001 | <0.001 |
| Nasal | 68.3 ± 13.7 | 65.9 ± 13.3 | 44.5 ± 15.1 | 59.5 ± 17.6 | <0.001 | 0.772 | <0.001 | <0.001 |
| Temporal | 79.4 ± 14.2 | 71.5 ± 14.3 | 54.5 ± 19.9 | 68.4 ± 19.4 | <0.001 | 0.134 | <0.001 | <0.001 |
| mGCIPL thickness (μ m) | ||||||||
| Average | 69.9 ± 5.4 | 65.4 ± 6.5 | 49.2 ± 10.4 | 61.4 ± 11.8 | <0.001 | 0.054 | <0.001 | <0.001 |
| Superior | 69.2 ± 7.1 | 66.0 ± 9.1 | 48.1 ± 15.5 | 61.0 ± 14.5 | <0.001 | 0.497 | <0.001 | <0.001 |
| Superonasal | 72.6 ± 8.2 | 66.6 ± 11.6 | 50.7 ± 17.1 | 63.2 ± 15.8 | <0.001 | 0.145 | <0.001 | <0.001 |
| Superotemporal | 70.5 ± 7.2 | 66.1 ± 8.9 | 49.9 ± 17.4 | 62.1 ± 14.9 | <0.001 | 0.310 | <0.001 | <0.001 |
| Inferior | 65.2 ± 6.0 | 63.9 ± 8.9 | 48.6 ± 13.9 | 59.2 ± 12.6 | <0.001 | 0.862 | <0.001 | <0.001 |
| Inferonasal | 70.2 ± 7.7 | 64.3 ± 9.0 | 48.7 ± 14.3 | 61.0 ± 14.0 | <0.001 | 0.076 | <0.001 | <0.001 |
| Inferotemporal | 71.6 ± 9.7 | 65.2 ± 9.4 | 49.2 ± 17.2 | 62.0 ± 15.8 | <0.001 | 0.112 | <0.001 | <0.001 |
| mGCC thickness (μ m) | ||||||||
| Average | 106.2 ± 9.4 | 95.4 ± 11.5 | 73.7 ± 15.5 | 91.7 ± 18.4 | <0.001 | 0.002 | <0.001 | <0.001 |
| Superior | 106.5 ± 9.2 | 96.1 ± 12.1 | 73.8 ± 21.6 | 92.1 ± 20.6 | <0.001 | 0.019 | <0.001 | <0.001 |
| Superonasal | 118.0 ± 11.5 | 104.6 ± 16.1 | 79.3 ± 18.2 | 100.5 ± 22.4 | <0.001 | 0.002 | <0.001 | <0.001 |
| Superotemporal | 94.8 ± 9.2 | 87.0 ± 11.1 | 67.8 ± 21.1 | 83.1 ± 18.7 | <0.001 | 0.087 | <0.001 | <0.001 |
| Inferior | 103.8 ± 10.4 | 94.3 ± 17.2 | 73.9 ± 18.1 | 90.6 ± 19.9 | <0.001 | 0.038 | <0.001 | <0.001 |
| Inferonasal | 117.7 ± 12.7 | 103.4 ± 16.2 | 79.6 ± 16.1 | 100.2 ± 21.8 | <0.001 | <0.001 | <0.001 | <0.001 |
| Inferotemporal | 96.4 ± 11.0 | 87.1 ± 12.6 | 67.8 ± 24.4 | 83.7 ± 20.9 | <0.001 | 0.080 | <0.001 | <0.001 |
Table 3.
Multinomial logistic regression for glaucoma with normal as a reference
Table 4.
Diagnostic performance of ocular measurements for glaucoma patients from nomal group


 PDF
PDF ePub
ePub Citation
 Print
Print


 XML Download