

 PDF
PDF ePub
ePub Citation
 Print
Print


Abstract
Purpose
To evaluate the clinical features of high myopic eyes with cataracts implanted with negative power intraocular lenses (IOLs) at the time of cataract surgery.
Methods
A retrospective chart review was conducted of 18 eyes of 14 patients who underwent cataract surgery with negative power IOLs and 10 eyes in 9 patients with low power IOLs. We investigated axial length, IOL power, preoperative and post-operative best-corrected visual acuity (BCVA) and preoperative and postoperative spherical equivalent (SE) refractive errors.
Results
Mean BCVA showed significant improvement in both groups. We measured postoperative SE refraction and the difference between the mean intended and the mean achieved SE refractive errors in the negative power group (17 eyes) was +1.59 ± 1.34 D and +0.31 ± 0.50 D in the low power group.
Conclusions
BCVA was significantly improved in the majority of eyes, although they had myopic macular degeneration or posterior staphyloma. However, the mean achieved postoperative SE refraction was more hyperopic than the predicted postoperative SE error. Additionally, hyperopic refractive error was greater in the negative power group than the low power group. Therefore, we recommend that postoperative hyperopic refractive error should be considered when performing cataract surgery in high myopic patients.
Go to : 
References
1. Hyman L. Myopic and hyperopic refractive error in adults: an overview. Ophthalmic Epidemiol. 2007; 14:192–7.

2. Saw SM, Chan YH, Wong WL, et al. Prevalence and risk factors for refractive errors in the Singapore Malay Eye Survey. Ophthalmology. 2008; 115:1713–9.
3. Lim R, Mitchell P, Cumming RG. Refractive associations with abdominal: the Blue Mountains Eye Study. Invest Ophthalmol Vis Sci. 1999; 40:3021–6.
4. Wong TY, Klein BE, Klein R, et al. Refractive errors and incident cataracts: the Beaver Dam Eye Study. Invest Ophthalmol Vis Sci. 2001; 42:1449–54.
5. Leske MC, Wu SY, Nemesure B, et al. Risk factors for incident abdominal opacities. Ophthalmology. 2002; 109:1303–8.
6. Kohnen S, Brauweiler P. First results of cataract surgery and abdominalation of negative power intraocular lenses in highly myopic eyes. J Cataract Refract Surg. 1996; 22:416–20.
7. Holladay JT. Visual acuity measurements. J Cataract Refract Surg. 2004; 30:287–90.
8. Jung SK, Lee JH, Kakizaki H, Jee D. Prevalence of myopia and its association with body stature and educational level in 19-year-old male conscripts in seoul, South Korea. Invest Ophthalmol Vis Sci. 2012; 53:5579–83.
9. Nielsen NE, Naeser K. Epidemiology of retinal detachment abdominal extracapsular cataract extraction: a follow-up study with an analysis of risk factors. J Cataract Refract Surg. 1993; 19:675–80.
10. Petermeier K, Gekeler F, Messias A, et al. Intraocular lens power calculation and optimized constants for highly myopic eyes. J Cataract Refract Surg. 2009; 35:1575–81.
11. Kapamajian MA, Miller KM. Efficacy and safety of cataract abdominal with negative power intraocular lens implantation. Open Ophthalmol J. 2008; 2:15–9.
12. Kwon JW, Lee HS, Park SH, Joo CK. Clinical result after abdominalation of minus diopter intraocular lens in the high myopia patients. J Korean Ophthalmol Soc. 2009; 50:1308–12.
13. Zuberbuhler B, Seyedian M, Tuft S. Phacoemulsification in eyes with extreme axial myopia. J Cataract Refract Surg. 2009; 35:335–40.
14. Chang YH, Lim SJ, Kim TH, Kim HB. Prediction of the refractive power after cataract surgery on myopic eyes. J Korean Ophthalmol Soc. 1999; 40:424–9.
15. Kora Y, Yaguchi S, Inatomi M, Ozawa T. Preferred postoperative refraction after cataract surgery for high myopia. J Cataract Refract Surg. 1995; 21:35–8.
16. Hayashi K, Hayashi H. Optimum target refraction for highly and moderately myopic patients after monofocal intraocular lens implantation. J Cataract Refract Surg. 2007; 33:240–6.
17. Haigis W. Intraocular lens calculation in extreme myopia. J Cataract Refract Surg. 2009; 35:906–11.
Go to :
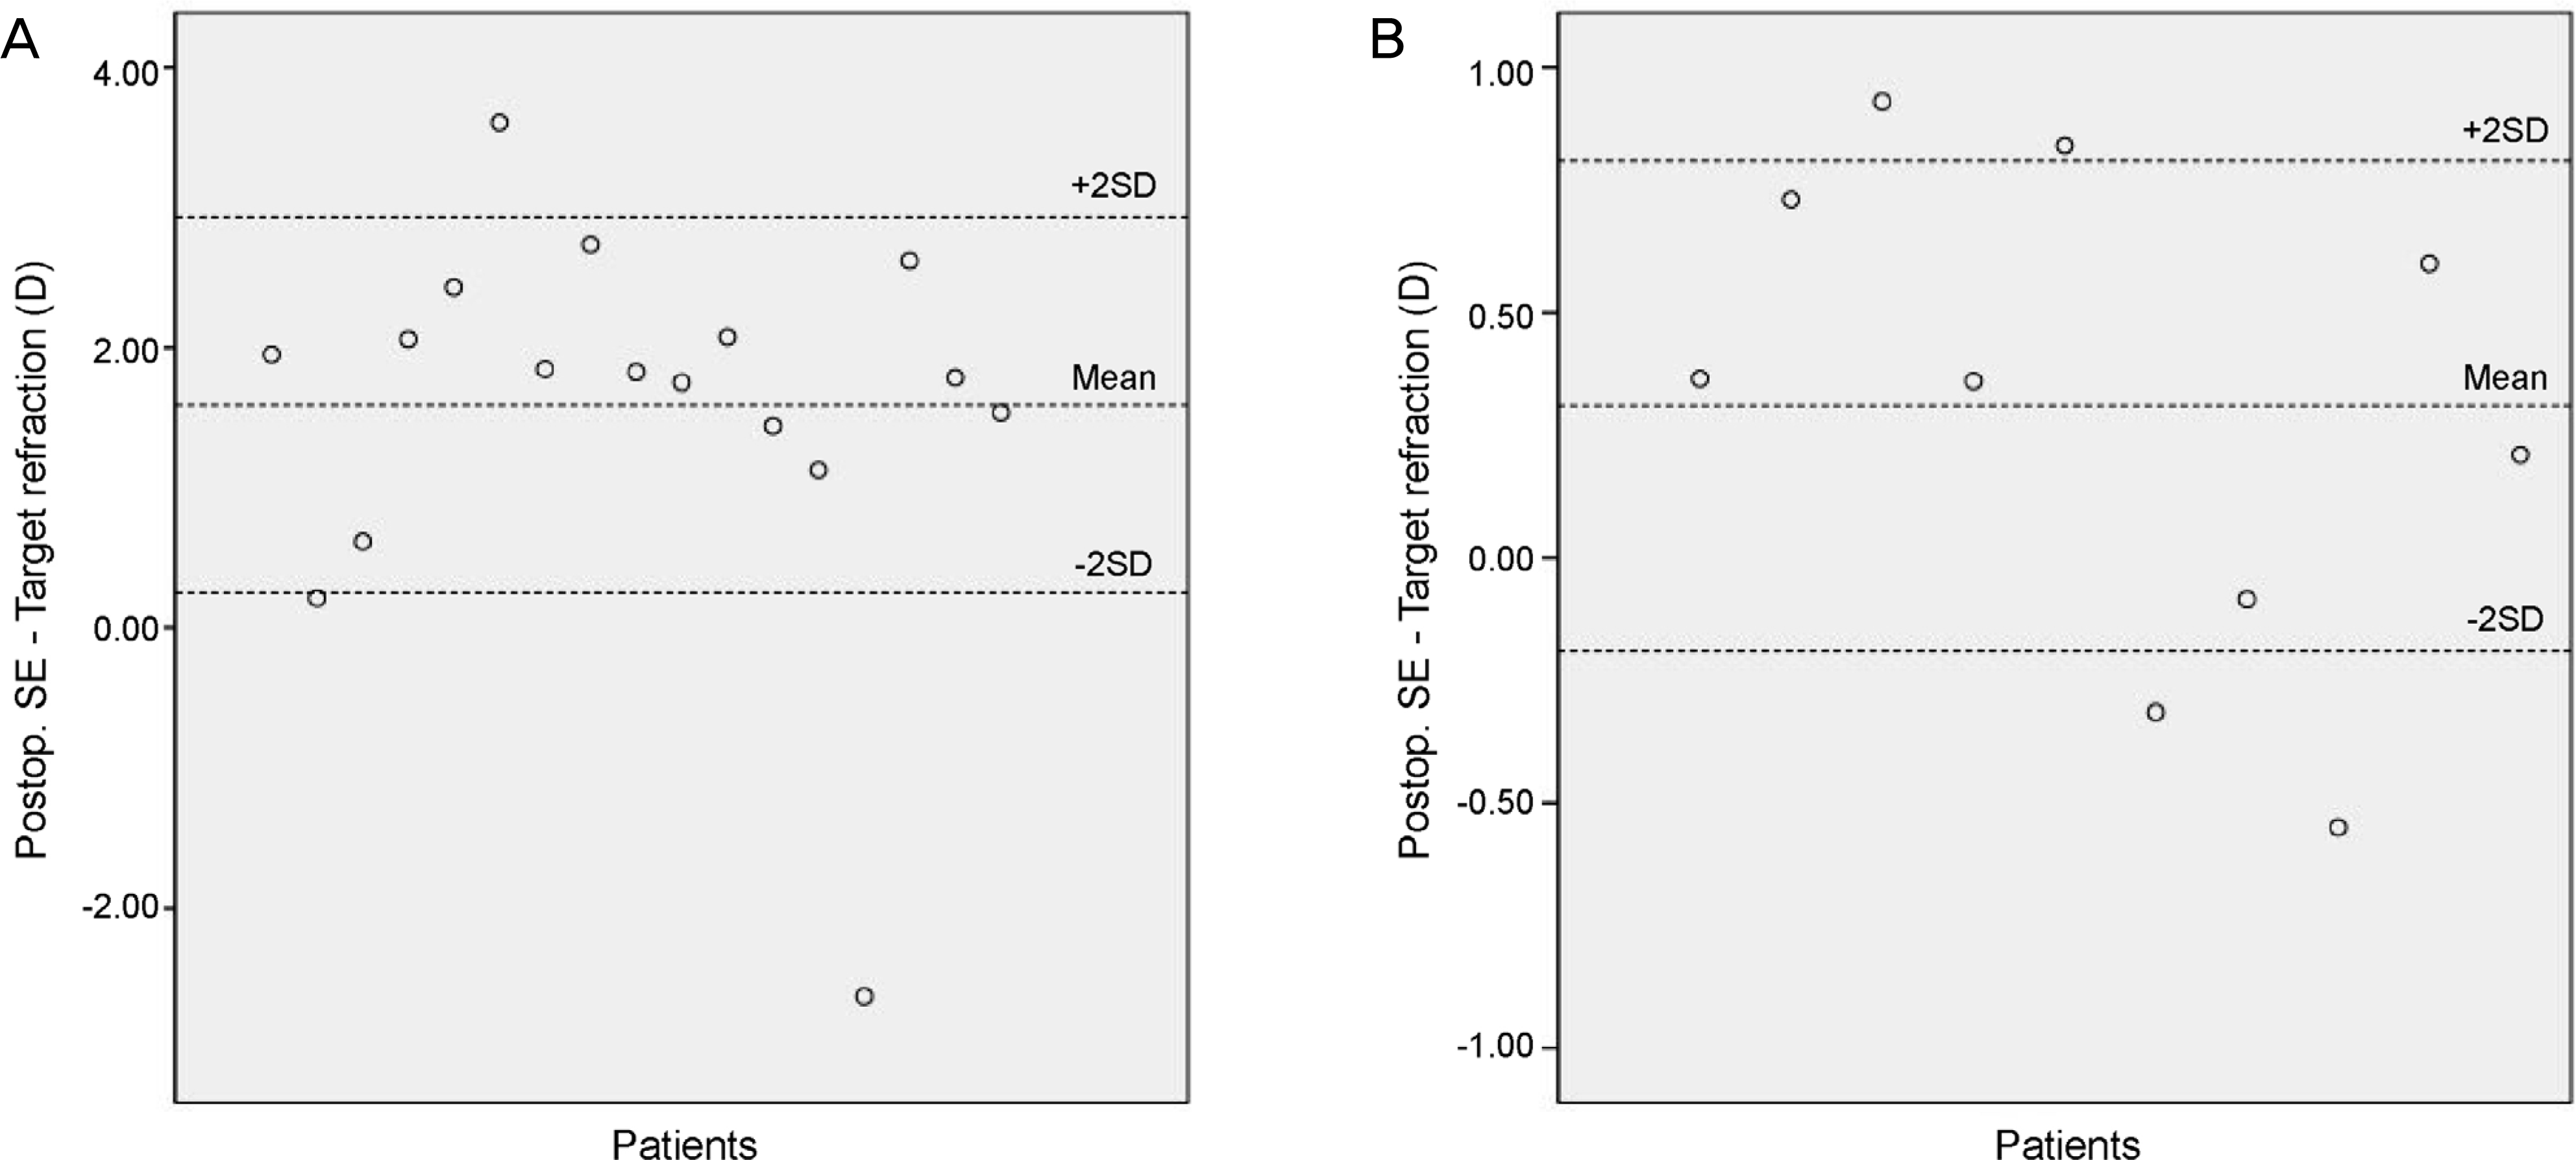 | Figure 1.Distribution of the difference between postoperative spherical equivalent (SE) and target refraction. (A) Negative-power group.(B) Low-power group. Postop. = postoperative. |
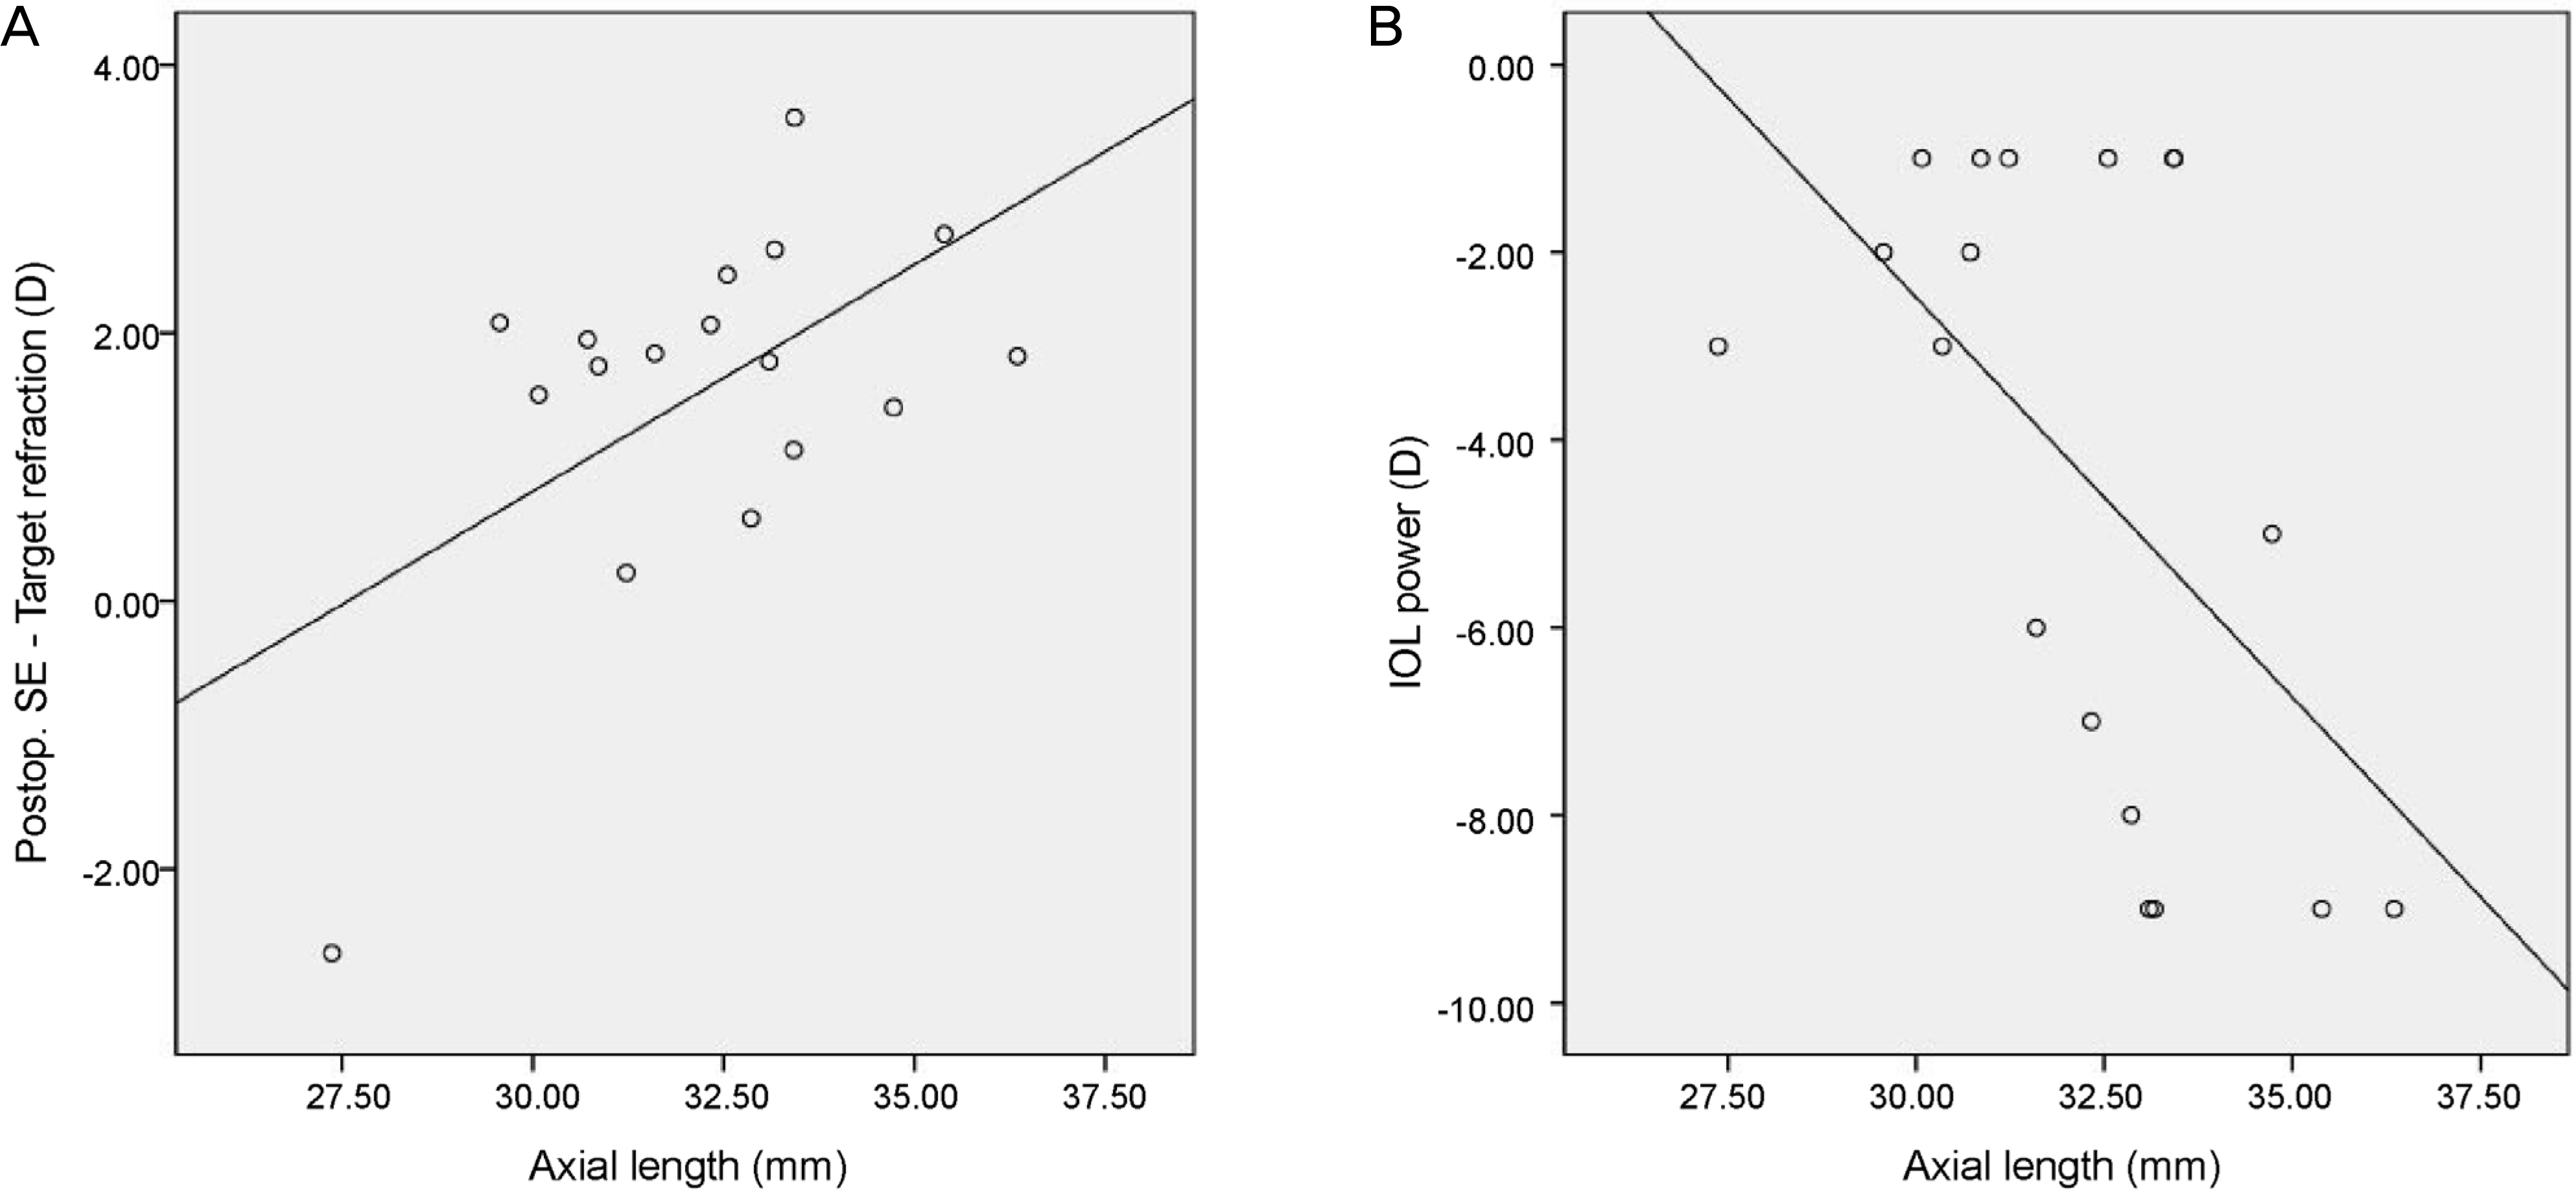 | Figure 2.Pearson correlation of axial length with (A) the difference between postoperative spherical equivalent (SE) and target refraction (r = 0.560, p = 0.019), (B) intraocular lens (IOL) power (r = −0.559, p = 0.016) in negative-power group. Postop. = postoperative. |
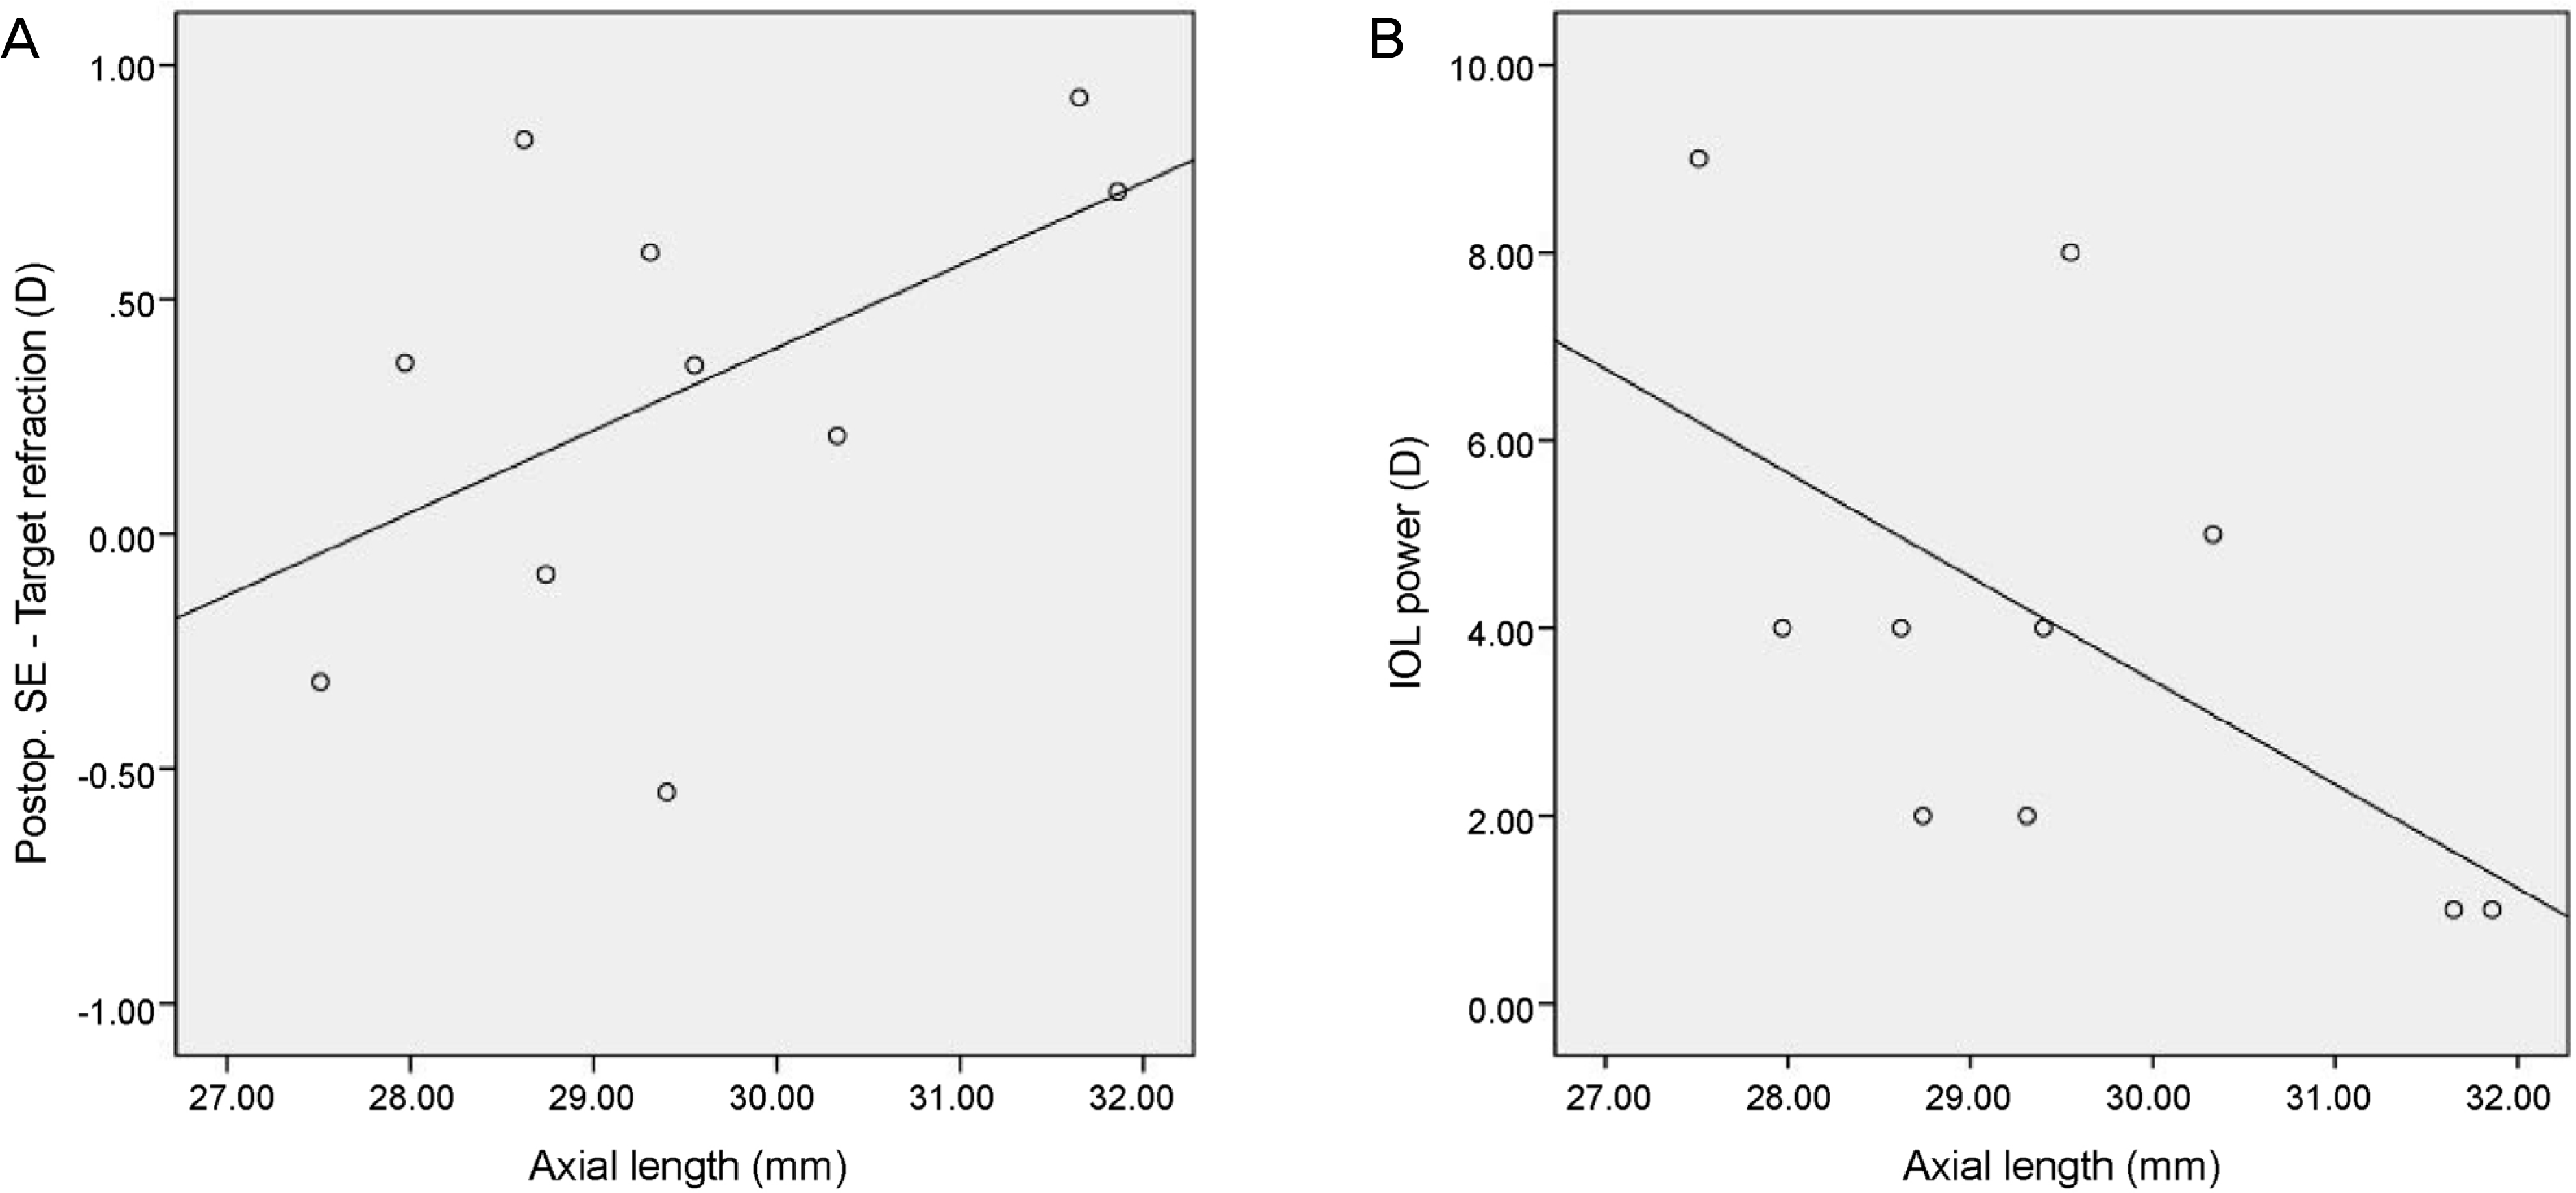 | Figure 3.Pearson correlation of axial length with (A) the difference between postoperative spherical equivalent (SE) and target re+fraction (r = 0.508, p = 0.134), (B) intraocular lens (IOL) power (r = −0.578, p = 0.080) in low-power group. Postop. = postoperative. |
Table 1.
Demographics of patients and implanted IOL
Table 2.
Demographic and surgical information of patients implanted with negative-power IOL*
Table 3.
Demographic and surgical information of patients implanted with low-power IOL*
 XML Download