Abstract
Purpose
To investigate the relationship between vision-related quality of life (QOL) and integrated binocular visual field (IVF) de-fect and the difference in QOL based on the location of visual field defects in Korean normal tension glaucoma (NTG) patients.
Methods
Two hundred monocular visual fields from 100 patients diagnosed with normal tension glaucoma in at least one eye were integrated using the best location method, and the mean deviation (MD) of whole, superior, and inferior IVF was calculated. We analyzed the correlations between subscales of the National Eye Institute Visual Function Questionnaire 25 (NEI VFQ-25) and each calculated MD using Spearman correlation. After adjusting for confounding factors of age, visual acuity of the better eye, number of medications, and education level, the impact of IVF loss on the composite score of the NEI VFQ-25 was eval-uated using multivariate linear regression analysis.
Results
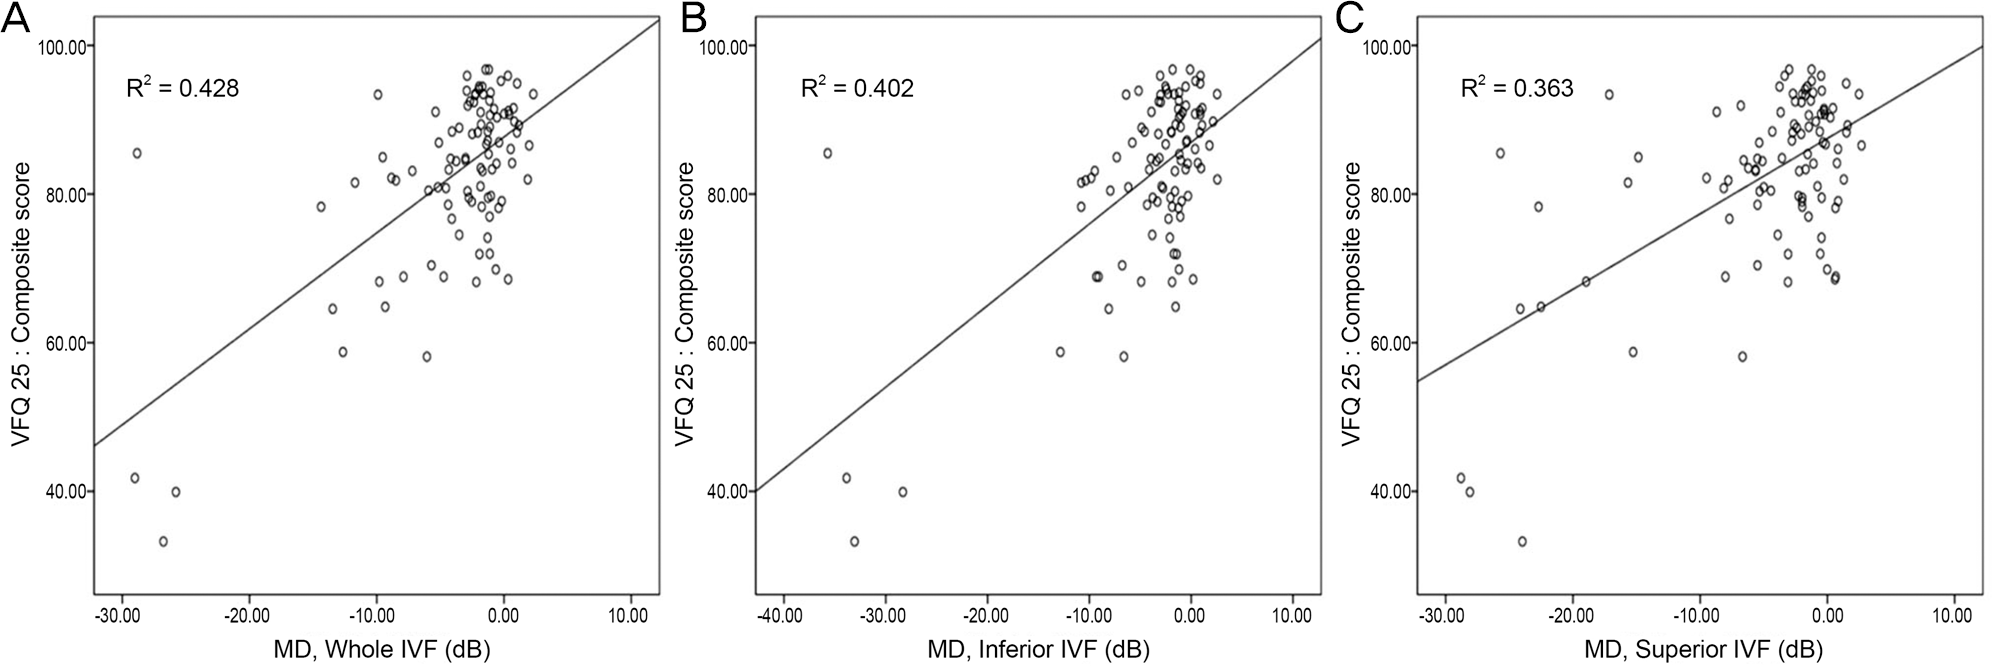
The MDs of whole and inferior IVF were significantly associated with 7 of 12 NEI VFQ-25 subscales, and the superior IVF was associated with 3 subscales ( p < 0.05). After adjusting confounding variables, the composite score of the NEI VFQ-25 showed significant correlation with whole, superior, and inferior IVF. The adjusted R2 and β coefficient of the regression line were highest in the whole IVF (Adjusted R2 = 0.451, β = 1.12), followed by the inferior and superior IVF (Adjusted R2 = 0.438, 0.395, β = 0.95, 0.85).
Conclusions
The IVF of Korean NTG patients can effectively reflect patient QOL, and the inferior IVF was significantly asso-ciated with more subscales of NEI VFQ-25 than was the superior IVF. However, overall QOL of patients is thought to be de-termined by severity of visual field loss rather than its location.
References
1. Hyman L, Wu SY, Connell AM. . Prevalence and causes of vis-ual impairment in The Barbados Eye Study. Ophthalmology. 2001; 108:1751–6.
2. Gutierrez P, Wilson MR, Johnson C. . Influence of glaucoma-tous visual field loss on health-related quality of life. Arch Ophthalmol. 1997; 115:777–84.

3. Janz NK, Wren PA, Lichter PR. . Quality of life in newly diag-nosed glaucoma patients: The Collaborative Initial Glaucoma Treatment Study. Ophthalmology. 2001; 108:887–97. discussion 898.
4. McKean-Cowdin R, Wang Y, Wu J. . Impact of visual field loss on health-related quality of life in glaucoma: the Los Angeles Latino Eye Study. Ophthalmology. 2008; 115:941–8.e1.
5. Parrish RK 2nd, Gedde SJ, Scott IU. . Visual function and qual-ity of life among patients with glaucoma. Arch Ophthalmol. 1997; 115:1447–55.

6. Crabb DP, Fitzke FW, Hitchings RA, Viswanathan AC. A practical approach to measuring the visual field component of fitness to drive. Br J Ophthalmol. 2004; 88:1191–6.

7. van Gestel A, Webers CA, Beckers HJ. . The relationship be-tween visual field loss in glaucoma and health-related qual-ity-of-life. Eye (Lond). 2010; 24:1759–69.

8. Owen VM, Crabb DP, White ET. . Glaucoma and fitness to drive: using binocular visual fields to predict a milestone to blindness. Invest Ophthalmol Vis Sci. 2008; 49:2449–55.

9. Mills RP, Drance SM. Esterman disability rating in severe glaucoma. Ophthalmology. 1986; 93:371–8.

10. Chun YS, Park IK. Comparison of mean deviation between in-tegrated binocular visual field and monocular visual field. J Korean Ophthalmol Soc. 2013; 54:919–26.

11. Nelson-Quigg JM, Cello K, Johnson CA. Predicting binocular vis-ual field sensitivity from monocular visual field results. Invest Ophthalmol Vis Sci. 2000; 41:2212–21.
12. Cheng HC, Guo CY, Chen MJ. . Patient-reported vision-related quality of life differences between superior and inferior hemifield visual field defects in primary open-angle glaucoma. JAMA Ophthalmol. 2015; 133:269–75.

13. Black AA, Wood JM, Lovie-Kitchin JE. Inferior field loss in-creases rate of falls in older adults with glaucoma. Optom Vis Sci. 2011; 88:1275–82.

14. Sawada H, Yoshino T, Fukuchi T, Abe H. Assessment of the vi-sion-specific quality of life using clustered visual field in glaucoma patients. J Glaucoma. 2014; 23:81–7.

15. Murata H, Hirasawa H, Aoyama Y. . Identifying areas of the visual field important for quality of life in patients with glaucoma. PLoS One. 2013; 8:e58695.

16. Lee JY, Cho HK, Kee CW. Assessment of the vision-specific qual-ity of life using binocular esterman visual field in glaucoma patients. J Korean Ophthalmol Soc. 2013; 54:1567–72.

17. Shin JH, Park SH. Comparative analysis of the Humphrey static perimetry and the Goldmann kinetic perimetry: application of the Humphrey static perimetry to visual disability evaluation. J Korean Ophthalmol Soc. 2013; 54:1907–17.

18. Kim CS, Seong GJ, Lee NH. . Prevalence of primary open-angle glaucoma in central South Korea the Namil study. Ophthalmology. 2011; 118:1024–30.
19. Anderson DR, Drance SM, Schulzer M. Collaborative Normal- Tension Glaucoma Study Group Natural history of normal-tension glaucoma. Ophthalmology. 2001; 108:247–53.
20. Heijl A, Bengtsson B, Hyman L. . Natural history of open-an-gle glaucoma. Ophthalmology. 2009; 116:2271–6.

21. Kang BW, Ji YS, Park SW. Analysis of factors related of location of initial visual field defect in normal tension glaucoma. J Korean Ophthalmol Soc. 2011; 52:1478–84.

22. Nah YS, Seong GJ, Kim CY. Visual function and quality of life in Korean patients with glaucoma. Korean J Ophthalmol. 2002; 16:70–4.

23. Yoon GJ, Kim DB, Yang PJ, Kim KS. A study on the relation be-tween glaucoma and quality of life. J Korean Ophthalmol Soc. 2003; 44:472–84.
24. Feng CS, Yi KS. Research on the quality of life of glaucoma patients. J Korean Ophthalmol Soc. 2014; 55:1868–77.

25. Chylack LT Jr, Wolfe JK, Singer DM. . The Lens Opacities Classification System III. The Longitudinal Study of Cataract Study Group. Arch Ophthalmol. 1993; 111:831–6.
26. Arora KS, Boland MV, Friedman DS. . The relationship be-tween better-eye and integrated visual field mean deviation and visual disability. Ophthalmology. 2013; 120:2476–84.

27. Anderson DR. The single field printout with Statpac analysis. Kist K, editor. Automated Static Perimetry. 2nd. St. Louis: Mosby;1992. chap. 5.
28. Heo JW, Yoon HS, Shin JP. . A validation and reliability study of the Korean version of National Eye Institute Visual Function Questionnaire 25. J Korean Ophthalmol Soc. 2010; 51:1354–67.

29. Asaoka R, Crabb DP, Yamashita T. . Patients have two eyes!: binocular versus better eye visual field indices. Invest Ophthalmol Vis Sci. 2011; 52:7007–11.

30. Leung EW, Medeiros FA, Weinreb RN. Prevalence of ocular sur-face disease in glaucoma patients. J Glaucoma. 2008; 17:350–5.

31. Garcia-Feijoo J, Sampaolesi JR. A multicenter evaluation of ocular surface disease prevalence in patients with glaucoma. Clin Ophthalmol. 2012; 6:441–6.
Figure 1.
Association between National Eye Institute Visual Function Questionnaire (NEI VFQ-25) composite score and the mean deviations (MD) of each integrated binocular visual fields (IVF) in Korean normal tension glaucoma patients. (A) Whole field IVF and composite score (β = 1.29, R2 = 0.428, p < 0.001). (B) Inferior field IVF and composite score (β = 1.10, R2 = 0.402, p < 0.001). (C) Superior field IVF and composite score (β = 1.02, R2 = 0.363, p < 0.001).

Figure 2.
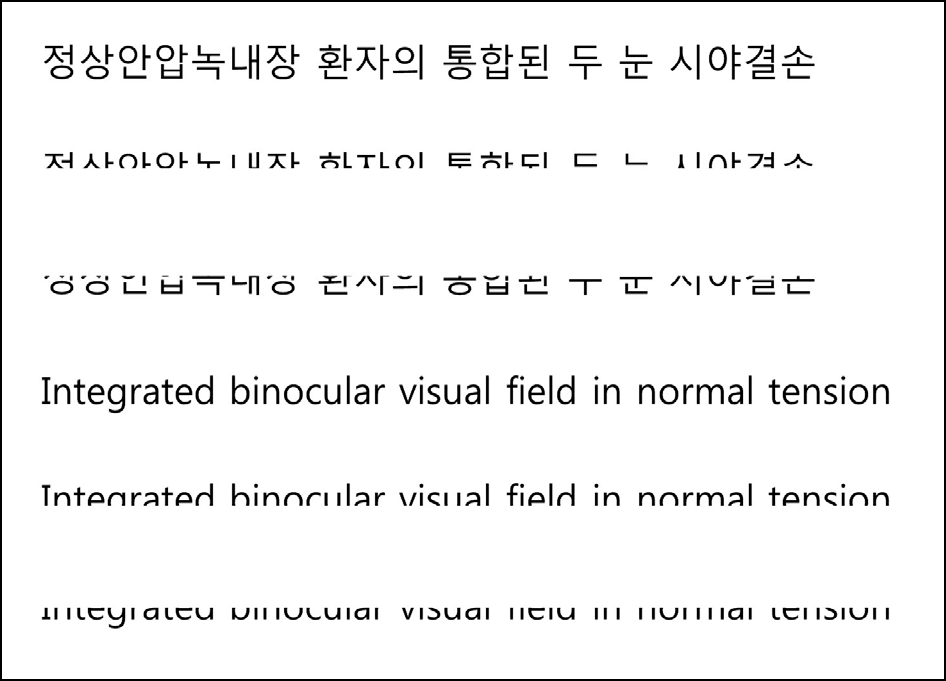
The effects of the superior and inferior field defect on word recognition in Korean and English. The upper half sentence can give clues to recognize the English letters be-cause English alphabets composed of one letter. In contrary, patients could encounter difficulties to understand a Korean sentence with just half of sentence because Korean letters are made by combinations of consonants and vowels.

Table 1.
Clinical and demographic characteristics of the subjects
Table 2.
Comparison of MDs of monocular and integrated binocular visual fields
| Visual field | MDs (range, dB) | p-value* | p-value† | p-value‡ |
|---|---|---|---|---|
| Whole IVF | -3.85 ± 5.98 (-29.01 to 2.30) | 0.001 | 0.985 | |
| Superior IVF | -4.74 ± 6.99 (-28.79 to 2.68) | 0.001 | 0.044 | |
| Inferior IVF | -3.85 ± 6.83 (-35.71 to 2.57) | 0.985 | 0.044 | |
| Better eye | -4.80 ± 6.58 (-30.56 to 1.38) | <0.001 | 0.792 | 0.003 |
| Worse eye | -9.49 ± 7.94 (-35.98 to 0.60) | <0.001 | <0.001 | <0.001 |
Table 3.
The correlation coefficients between MDs and subscales of the National Eye Institute Visual Function Questionnaire (NEI VFQ-25)
| Score |
MD of whole IVF |
MD of superior IVF |
MD of inferior IVF |
||||
|---|---|---|---|---|---|---|---|
| Correlation coefficient* | p-value | Correlation coefficient* | p-value | Correlation coefficient* | p-value | ||
| General health | 39.4 ± 20.4 | 0.107 | 0.298 | 0.028 | 0.786 | 0.115 | 0.260 |
| General vision | 66.6 ± 20.4 | 0.378 | <0.001 | 0.339 | 0.001 | 0.291 | 0.004 |
| Ocular pain | 78.9 ± 20.4 | 0.268 | 0.008 | 0.225 | 0.027 | 0.285 | 0.005 |
| Near vision | 82.3 ± 19.4 | 0.189 | 0.063 | 0.097 | 0.346 | 0.192 | 0.059 |
| Distance vision | 82.2 ± 18.3 | 0.265 | 0.009 | 0.173 | 0.090 | 0.262 | 0.009 |
| Vision-specific social functioning | 90.1 ± 15.8 | 0.214 | 0.035 | 0.195 | 0.055 | 0.194 | 0.057 |
| Vision-specific mental health | 78.1 ± 18.8 | 0.283 | 0.005 | 0.260 | 0.010 | 0.261 | 0.010 |
| Vision-specific role difficulties | 75.5 ± 29.1 | 0.225 | 0.027 | 0.194 | 0.057 | 0.263 | 0.009 |
| Vision-specific dependency | 90.2 ± 18.1 | 0.184 | 0.071 | 0.162 | 0.113 | 0.228 | 0.025 |
| Driving | 84.6 ± 18.1 | -0.010 | 0.948 | 0.074 | 0.631 | -0.014 | 0.928 |
| Color vision | 94.8 ± 13.9 | 0.040 | 0.697 | 0.021 | 0.840 | 0.067 | 0.516 |
| Peripheral vision | 88.1 ± 18.4 | 0.203 | 0.047 | 0.164 | 0.109 | 0.214 | 0.036 |
| Composite score | 82.7 ± 11.8 | 0.411 | <0.001 | 0.341 | 0.001 | 0.407 | <0.001 |
Table 4.
Coefficients from a univariate linear regression analyses with composite score of the National Eye Institute Visual Function Questionnaire (NEI VFQ-25)
Table 5.
Correlation coefficients from multiple regression models between the National Eye Institute Visual Function Questionnair (NEI VFQ-25) composite score and the mean deviations of integrated binocular visual fields


 PDF
PDF ePub
ePub Citation
 Print
Print


 XML Download