Abstract
Purpose
To measure retinal nerve fiber layer (RNFL) volume in normal children using spectral domain optical coherence tomography (SD-OCT).
Methods
This study included 79 eyes of 54 normal children between 4 and 15 years of age evaluated from February 2012 to November 2012. All participants underwent ocular examination and 3D-disc scanning using SD-OCT. RNFL volume was calculated between 2.5 and 5 mm diameter circles using the length, width, and height of each pixel derived from the RNFL thickness map with Matlab software. The relationship between RNFL volume and thickness was analyzed.
Results
The RNFL volumes of the mean total, superior, nasal, inferior, and temporal areas were 1.48 ± 0.09 mm3, 0.45 ± 0.04 mm3, 0.29 ± 0.04 mm3, 0.46 ± 0.03 mm3, and 0.29 ± 0.04 mm3, respectively. Comparing RNFL volume and conventional circumpapillary RNFL thickness measured using built-in software, a strong correlation between mean total, superior, and inferior areas (R = 0.980, 0.953 and 0.932, respectively) and a moderate correlation between the nasal and temporal areas were observed (R = 0.545 and 0.514, respectively). The negative correlations between RNFL thickness and RNFL volumes of the mean total, superior, nasal, inferior, and temporal areas and age were not significant (p > 0.05).
Go to : 
References
1. Tuulonen A. Lehtola J. Alraksinen PJ. Nerve fiber layer defects with normal visual fields. Do normal optic disc and normal visual field indicate absence of glaucomatous abnormality? Ophthalmology. 1993; 100:587–97. discussion. 597–8.
2. Airaksinen PJ. Alanko HI. Effect of retinal nerve fibre loss on the optic nerve head configuration in early glaucoma. Graefes Arch Clin Exp Ophthalmol. 1983; 220:193–6.

3. Rao A. Sahoo B. Kumar M, et al. Retinal nerve fiber layer thickness in children< 18 years by spectral-domain optical coherence tomography. Semin Ophthalmol. 2013; 28:97–102.
4. Yoon SW. Kang SM. Comparison of RNFL thickness among normal, glaucoma suspect and glaucoma in children. J Korean Ophthalmol Soc. 2009; 50:113–9.

5. Huynh SC. Wang XY. Rochtchina E. Mitchell P. Peripapillary retinal nerve fiber layer thickness in a population of 6-year-old children: findings by optical coherence tomography. Ophthalmology. 2006; 113:1583–92.
6. Salchow DJ. Oleynikov YS. Chiang MF, et al. Retinal nerve fiber layer thickness in normal children measured with optical coherence tomography. Ophthalmology. 2006; 113:786–91.

7. Ahn HC. Son HW. Kim JS. Lee JH. Quantitative analysis of retinal nerve fiber layer thickness of normal children and adolescents. Korean J Ophthalmol. 2005; 19:195–200.

8. Song JH. Kim E. Yoo JM. Analysis of RNFL thickness and optic nerve head measured with OCT in children. J Korean Ophthalmol Soc. 2007; 48:1346–53.

9. Cho YK. Lee YC. Lee SY. Factors mediating effects on the retinal nerve fiber layer thickness in normal children. J Korean Ophthalmol Soc. 2008; 49:98–103.

10. Kang KD. Abdul Majid AS. Kim YD, et al. Retinal nerve fiber layer thickness in children with glaucoma. J Korean Ophthalmol Soc. 2009; 50:887–92.

11. Shin JW. Uhm KB. Seong M. Lee DE. Retinal nerve fiber layer volume measurements in healthy subjects using spectral domain optical coherence tomography. J Glaucoma. 2014; 23:567–73.

12. Schuman JS. Hee MR. Puliafito CA, et al. Quantification of nerve fiber layer thickness in normal and glaucomatous eyes using optical coherence tomography. Arch Ophthalmol. 1995; 113:586–96.

13. Kanamori A. Nakamura M. Escano MF, et al. Evaluation of the glaucomatous damage on retinal nerve fiber layer thickness measured by optical coherence tomography. Am J Ophthalmol. 2003; 135:513–20.

14. Chi QM. Tomita G. Inazumi K, et al. Evaluation of the effect of aging on the retinal nerve fiber layer thickness using scanning laser polarimetry. J Glaucoma. 1995; 4:406–13.

15. Varma R. Bazzaz S. Lai M. Optical tomography-measured retinal nerve fiber layer thickness in normal latinos. Invest Ophthalmol Vis Sci. 2003; 44:3369–73.

16. Poinoosawmy D. Fontana L. Wu JX, et al. Variation of nerve fibre layer thickness measurements with age and ethnicity by scanning laser polarimetry. Br J Ophthalmol. 1997; 81:350–4.

17. Dichtl A. Jonas JB. Naumann GO. Retinal nerve fiber layer thickness in human eyes. Graefes Arch Clin Exp Ophthalmol. 1999; 237:474–9.

18. Alamouti B. Funk J. Retinal thickness decreases with age: an OCT study. Br J Ophthalmol. 2003; 87:899–901.

Go to : 
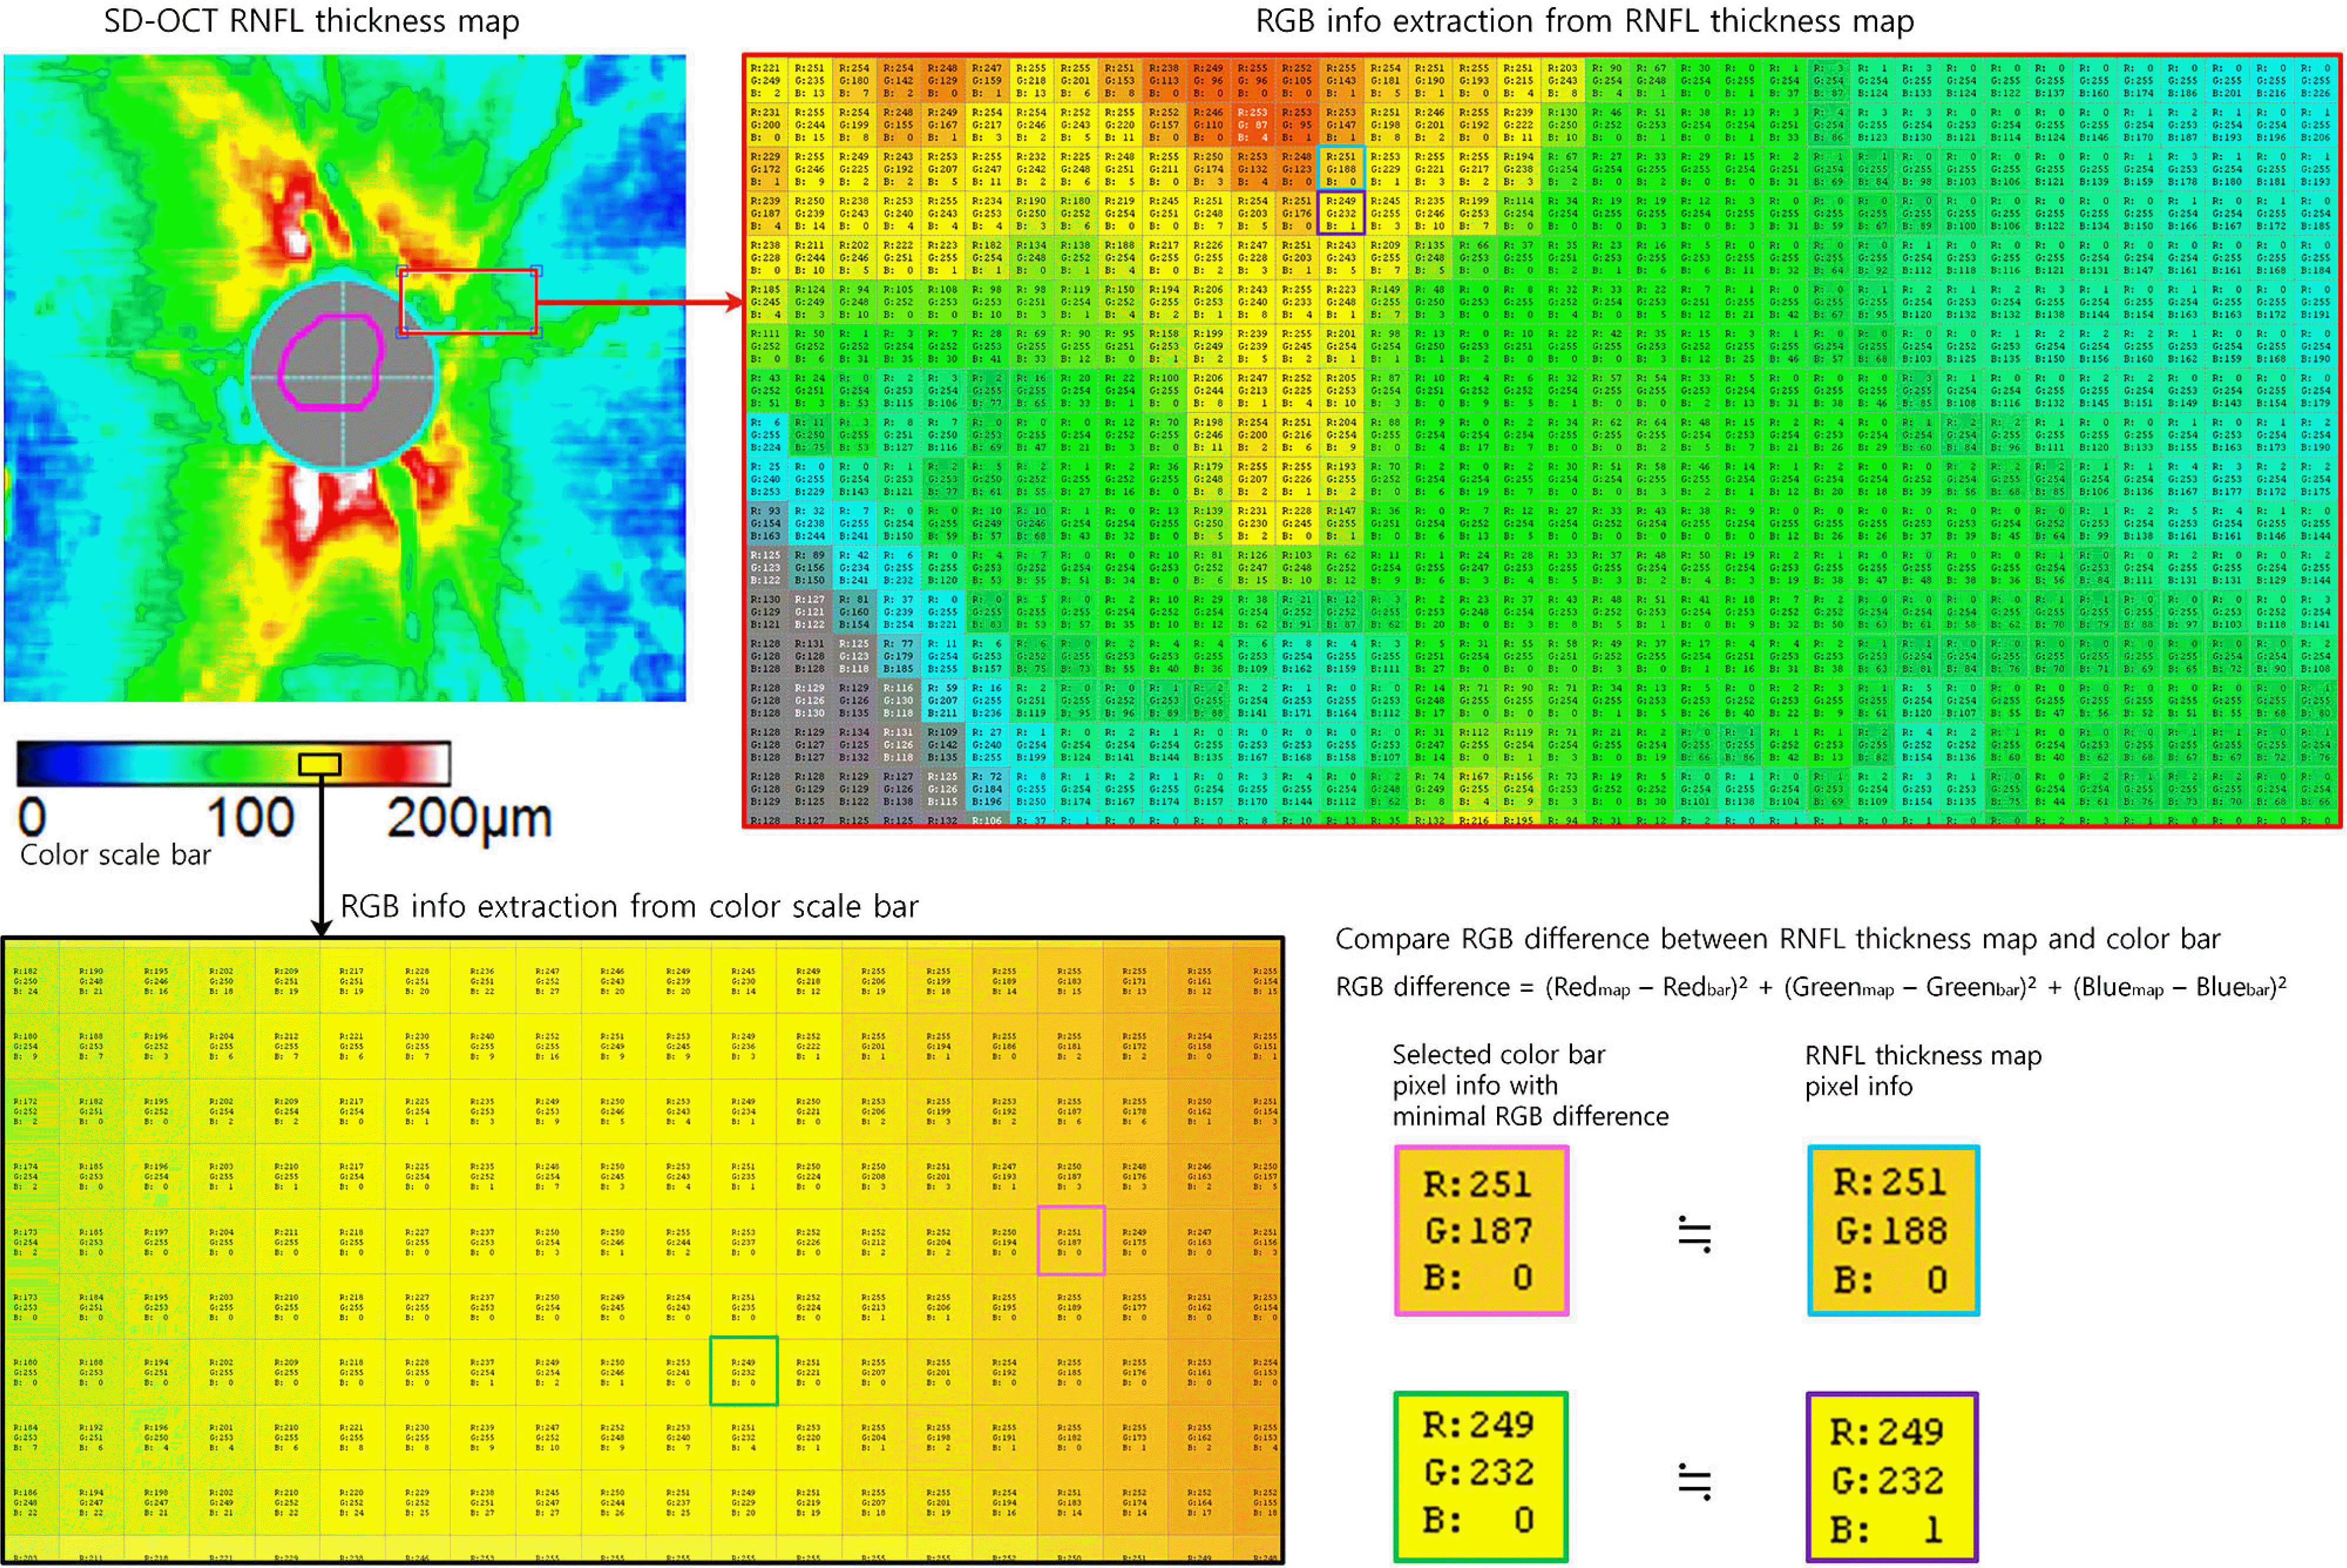
 | Figure 1.A process for measuring retinal nerve fiber layer (RNFL) thickness of each pixel in the RNFL thickness map. The RNFL thickness map in the 6 × 6 mm2 (540 × 540 pixels) parapapillary area is converted to RGB color information (red arrow). The color scale bar is also converted to red, green and blue (RGB) color format (black arrow). Then, each color pixel (blue and violet boxes) in the RNFL thickness map is compared with the RGB dataset (black box) of the color scale bar, and the RGB difference is calculated. We define RGB difference as (Red map - Red bar)2 + (Green map - Green bar)2 + (Blue map - Blue bar)2. Each different minimal RGB position (pink and green boxes) is selected in the color scale bar and translated to the corresponding numeric RNFL thickness measurement. SD-OCT = spectral domain optical coherence tomography. |
 | Figure 2.Three-dimensional (3-D) structure of retinal nerve fiber layer (RNFL). (A) 3-D RNFL structure as the integral of a number of cube pixels. (B) The RNFL volume as the sum of ‘(6/540) mm × (6/540) mm × (RNFL thickness of corresponding pixel/1,000) mm’ within the measuring area. (C) RNFL volume between the 2.5- and 5-mm diameter circles, and RNFL thickness on the 3.4-mm circle. |
 | Figure 3.Retinal nerve fiber layer (RNFL) volume in children according to age. (A) Total mean RNFL volume. (B) Superior quadrant RNFL volume. (C) Nasal quadrant RNFL volume. (D) Inferior RNFL volume. (E) Temporal RNFL volume. ∗Correlation coefficient; †Statistical significance was tested using Person’s correlation test. |
Table 1.
Study characteristics
| Age (years) | 10.03 ± 3.39 |
| Sex (male/female) | 30/24 |
| Visual acuity | 0.81 ± 0.28 |
| Refractive error (dipoters) | -0.15 ± 1.13 |
| Intraocular pressure (mm Hg) | 13.42 ± 5.21 |
Table 2.
RNFL volume and thickness based on quadrant in normal children and correlations between measurements
| RNFL volume (mm3) | RNFL thickness (μm) | R∗ | ||
|---|---|---|---|---|
| Total mean | 1.48 ± 0.09 | 107.11 ± 7.19 | 0.980 | |
| Superior | 0.45 ± 0.04 | 130.61 ± 12.16 | 0.953 | |
| Nasal | 0.29 ± 0.04 | 77.89 ± 11.36 | 0.545 | |
| Inferior | 0.46 ± 0.03 | 133.18 ± 11.11 | 0.932 | |
| Temporal | 0.29 ± 0.04 | 86.81 ± 10.43 | 0.514 |
Table 3.
Analysis of RNFL change in children according to age
| Variables | 4≤~<8 years | 8≤~ < 12 years | 12≤~<15 years | p-value∗ | p-value† |
|---|---|---|---|---|---|
| Mean age (years) | 6.80 ± 1.47 | 10.01 ± 1.58 | 13.04 ± 1.66 | ||
| Number (eyes) | 25 | 27 | 27 | ||
| RNFL volume (mm3) | |||||
| Total mean | 1.49 ± 0.09 | 1.51 ± 0.09 | 1.45 ± 0.08 | 0.063 | 0.081 |
| Superior quadrant | 0.45 ± 0.04 | 0.46 ± 0.04 | 0.43 ± 0.04 | 0.065 | 0.141 |
| Nasal quadrant | 0.29 ± 0.04 | 0.29 ± 0.04 | 0.28 ± 0.04 | 0.891 | 0.630 |
| Inferior quadrant | 0.46 ± 0.03 | 0.46 ± 0.03 | 0.45 ± 0.03 | 0.116 | 0.222 |
| Temporal quadrant | 0.29 ± 0.04 | 0.29 ± 0.03 | 0.28 ± 0.04 | 0.088 | 0.057 |
| RNFL thickness (μm) | |||||
| Total mean | 108.04 ± 7.02 | 108.63 ± 7.39 | 104.32 ± 6.22 | 0.075 | 0.068 |
| Superior quadrant | 131.36 ± 10.75 | 133.96 ± 12.36 | 126.16 ± 11.72 | 0.083 | 0.124 |
| Nasal quadrant | 78.32 ± 13.51 | 78.59 ± 10.62 | 75.64 ± 11.61 | 0.471 | 0.242 |
| Inferior quadrant | 134.24 ± 10.89 | 134.67 ± 10.32 | 129.96 ± 11.60 | 0.323 | 0.187 |
| Temporal quadrant | 88.20 ± 9.46 | 87.30 ± 9.70 | 85.36 ± 11.69 | 0.241 | 0.082 |
Table 4.
Mean RNFL volume and thickness according to sex
| Gender | Size (eyes) | Age (years) |
RNFL volume (mm3) |
RNFL thickness (μm) |
||||||||
|---|---|---|---|---|---|---|---|---|---|---|---|---|
| Total mean | Superior | Nasal | Inferior | Temporal | Total mean | Superior | Nasal | Inferior | Temporal | |||
| Male | 45 | 10.11 ± 3.21 | 1.48 ± 0.09 | 0.45 ± 0.38 | 0.29 ± 0.03 | 0.45 ± 0.03 | 0.29 ± 0.04 | 107.00 ± 7.24 | 130.78 ± 12.50 | 79.40 ± 10.78 | 132.50 ± 110.19 | 85.18 ± 9.43 |
| Female | 34 | 9.91 ± 3.67 | 1.49 ± 0.09 | 0.45 ± 0.04 | 0.29 ± 0.04 | 0.46 ± 0.04 | 0.29 ± 0.04 | 107.26 ± 7.22 | 130.38 ± 11.88 | 75.88 ± 11.95 | 134.06 ± 12.32 | 88.97 ± 11.40 |
| p-value∗ | 0.798 | 0.793 | 0.948 | 0.947 | 0.582 | 0.885 | 0.872 | 0.887 | 0.175 | 0.543 | 0.110 | |
Table 5.
Comparison of studies reporting optical coherence tomography-measured RNFL in normal children


 PDF
PDF ePub
ePub Citation
 Print
Print


 XML Download