

 PDF
PDF ePub
ePub Citation
 Print
Print


Abstract
Purpose
To evaluate segmentation reliability in diabetic macular edema (DME) estimates between a Cirrus™ HD-OCT image analysis algorithm and an Iowa reference algorithm, which are an automatic segmentation software.
Methods
Thirty eyes from 23 patients diagnosed with DME were included and underwent spectral-domain optical coherence scans (Cirrus™ HD-OCT). Central foveal thickness (CFT) and ganglion cell layer-inner plexiform layer segmentation data were compared with those produced by the Cirrus™ HD-OCT segmentation algorithm and Iowa reference algorithm. Measurement agreement was assessed using intraclass correlation (ICC) and segmentation errors were confirmed by 2 ophthalmologists.
Results
The mean CFT in the 1-mm central area determined by the manufacturer-supplied Cirrus software and Iowa reference algorithm was 512.07 ± 182.35 ^m and 476.53 ± 32.36 μm, respectively (p < 0.05). The mean paired difference was 35.53 ± 92.46 μm (ICC, 0.929). Segmentation errors were demonstrated in eyes with a CFT less than 400 μm, specifically for 45% of scans obtained by the Cirrus algorithm and 9% from the Iowa algorithm; in eyes with a CFT equal to or higher than 400 μm, the error rates were 95% and 42%, respectively.
Conclusions
CFT measurement in eyes with diabetic macular edema using the Cirrus algorithm and Iowa algorithm showed relatively high degrees of agreement and significant correlation. In eyes with a CFT equal to or higher than 400 μm, the Iowa algorithm showed higher reliability in retinal segmentation than the Cirrus algorithm.
References
1. Csaky KG. Richman EA. Ferris FL 3rd. Report from the NEI/FDA Ophthalmic Clinical Trial Design and Endpoints Symposium. Invest Ophthalmol Vis Sci. 2008; 49:479–89.

2. Diabetic Retinopathy Clinical Research Network. Browning DJ. Glassman AR, et al. Relationship between optical coherence tomography-measured central retinal thickness and visual acuity in diabetic macular edema. Ophthalmology. 2007; 114:525–36.
3. Murakami T. Yoshimura N. Structural changes in individual retinal layers in diabetic macular edema. J Diabetes Res. 2013; 2013:920713.
4. Murakami T. Nishijima K. Akagi T, et al. Segmentational analysis of retinal thickness after vitrectomy in diabetic macular edema. Invest Ophthalmol Vis Sci. 2012; 53:6668–74.
5. Sakamoto A. Nishijima K. Kita M, et al. Association between foveal photoreceptor status and visual acuity after resolution of diabetic macular edema by pars plana vitrectomy. Graefes Arch Clin Exp Ophthalmol. 2009; 247:1325–30.
6. Costa RA. Calucci D. Skaf M, et al. Optical coherence tomography 3: automatic delineation of the outer neural retinal boundary and its influence on retinal thickness measurements. Invest Ophthalmol Vis Sci. 2004; 45:2399–406.
7. Otani T. Yamaguchi Y. Kishi S. Correlation between visual acuity and foveal microstructural changes in diabetic macular edema. Retina. 2010; 30:774–80.
8. Wolf-Schnurrbusch UE. Ceklic L. Brinkmann CK, et al. Macular thickness measurements in healthy eyes using six different optical coherence tomography instruments. Invest Ophthalmol Vis Sci. 2009; 50:3432–7.
9. Lammer J. Scholda C. Prünte C, et al. Retinal thickness and volume measurements in diabetic macular edema: a comparison of four optical coherence tomography systems. Retina. 2011; 31:48–55.
10. Quellec G. Lee K. Dolejsi M, et al. Three-dimensional analysis of retinal layer texture: identification of fluid-filled regions in SD-OCT of the macula. IEEE Trans Med Imaging. 2010; 29:1321–30.
11. Chen X. Niemeijer M. Zhang L, et al. Three-dimensional segmentation of fluid-associated abnormalities in retinal OCT: probability constrained graph-search-graph-cut. IEEE Trans Med Imaging. 2012; 31:1521–31.
12. Zhang L. Sonka M. Folk JC, et al. Quantifying disrupted outer retinal-subretinal layer in SD-OCT images in choroidal neovascularization. Invest Ophthalmol Vis Sci. 2014; 55:2329–35.
13. Han IC. Jaffe GJ. Evaluation of artifacts associated with macular spectral-domain optical coherence tomography. Ophthalmology. 2010; 117:1177–89. e4.
14. Vujosevic S. Martini F. Longhin E, et al. Subthreshold micropulse yellow laser versus subthreshold micropulse infrared laser in center-involving diabetic macular edema: morphologic and functional safety. Retina. 2015; 35:1594–603.
15. Wells JA. Glassman AR. Jampol LM, et al. Association of baseline visual acuity and retinal thickness with 1-year efficacy of aflibercept, bevacizumab, and ranibizumab for diabetic macular edema. JAMA Ophthalmol. 2016; 134:127–34.
16. Lee JY. Chiu SJ. Srinivasan PP, et al. Fully automatic software for retinal thickness in eyes with diabetic macular edema from images acquired by cirrus and spectralis systems. Invest Ophthalmol Vis Sci. 2013; 54:7595–602.
17. Sohn EH. Chen JJ. Lee K, et al. Reproducibility of diabetic macular edema estimates from SD-OCT is affected by the choice of image analysis algorithm. Invest Ophthalmol Vis Sci. 2013; 54:4184–8.
18. Matt G. Sacu S. Buehl W, et al. Comparison of retinal thickness values and segmentation performance of different OCT devices in acute branch retinal vein occlusion. Eye (Lond). 2011; 25:511–8.
19. Mylonas G. Ahlers C. Malamos P, et al. Comparison of retinal thickness measurements and segmentation performance of four different spectral and time domain OCT devices in neovascular age-related macular degeneration. Br J Ophthalmol. 2009; 93:1453–60.
20. Garvin MK. Lee K. Burns TL, et al. Reproducibility of SD-OCT-based ganglion cell-layer thickness in glaucoma using two different segmentation algorithms. Invest Ophthalmol Vis Sci. 2013; 54:6998–7004.
Figure 1.
Representative automatic segmentation results for a normal eye. (A) Cirrus™ High definition optical coherence tomography (HD-OCT) segmentation of the ganglion cell layer (GCL) + inner plexiform layer (IPL) between the purple line and the yellow line. (B) Iowa algorithm segmentation of the GCL + IPL between the second surface (orange) and the third surface (yellow).
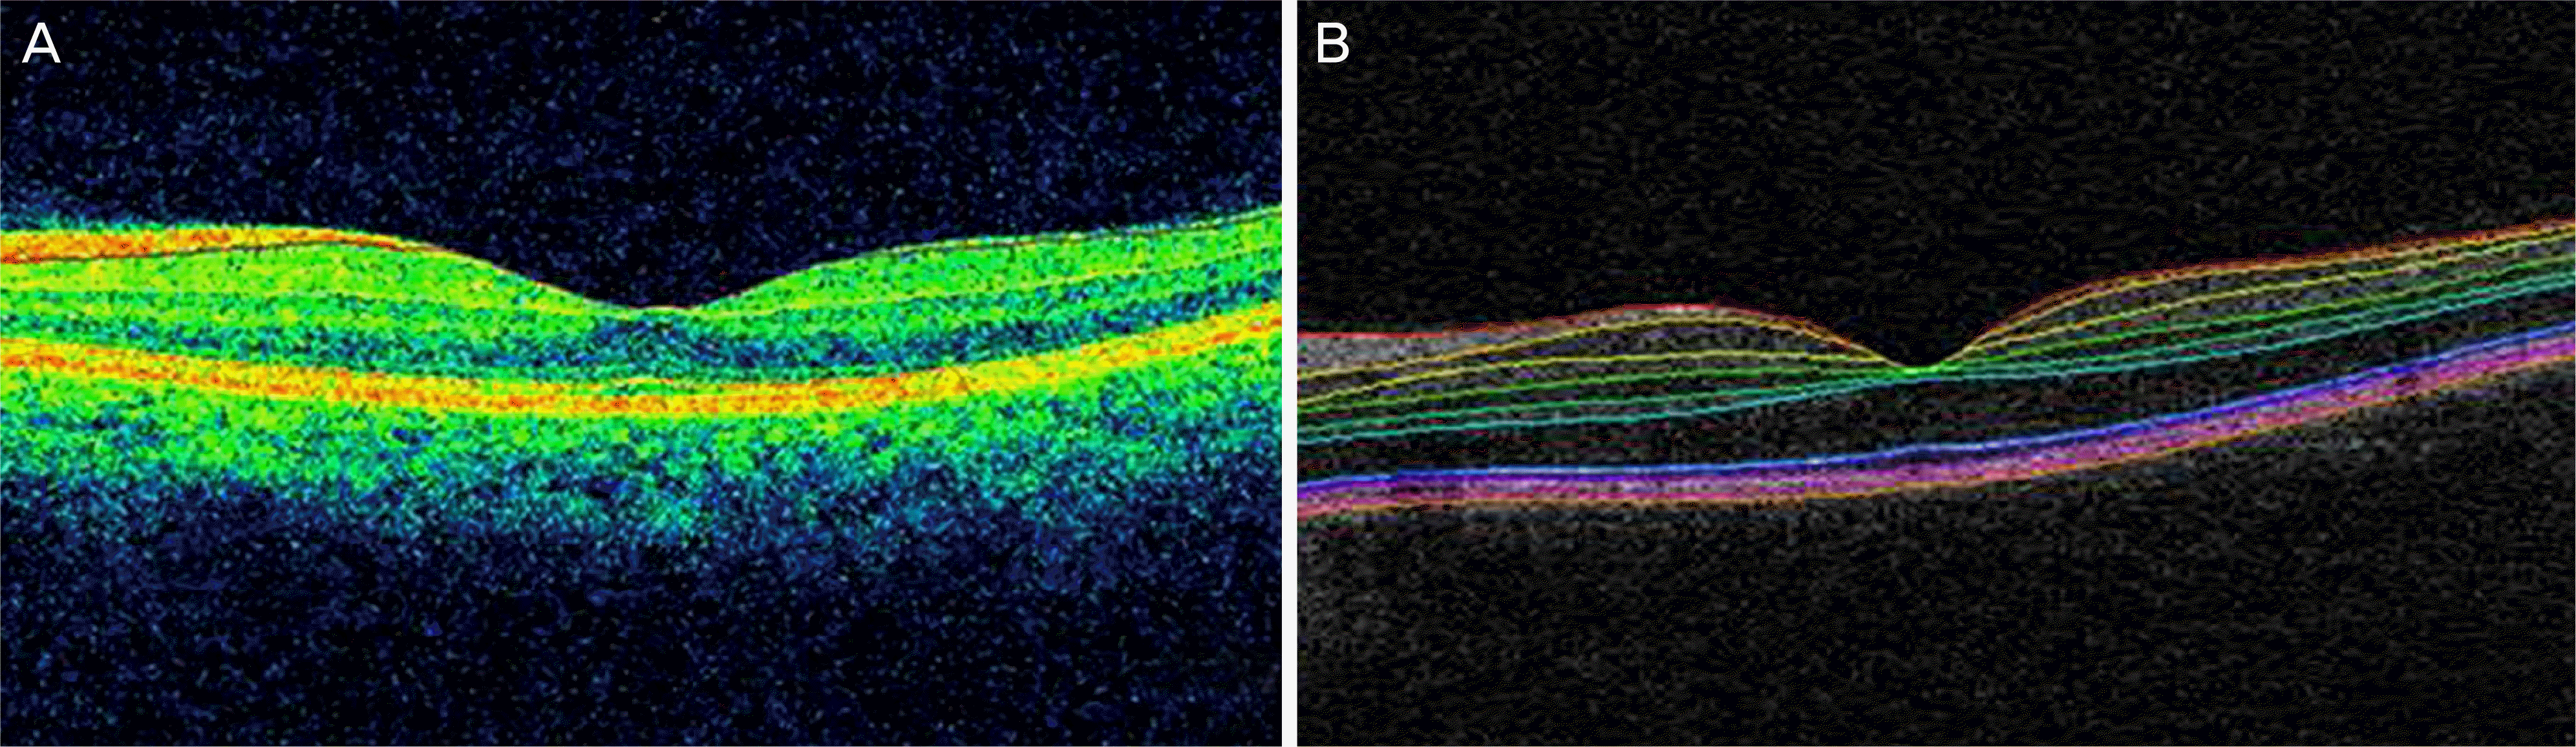
Figure 2.
Automatic segmentation results for eyes with diabetic macular edema. (A, B) An eye with central foveal thickness (CFT) < 400 μm. (C, D) An eye with CFT < 400 μm. (A, C) Iowa reference algorithm segmentation image. (B, D) Cirrus segmentation image. (A, B) show the correct segmentation results for the two algorithms, while (C, D) show incorrect segmentation results for the Cirrus segmentation image.
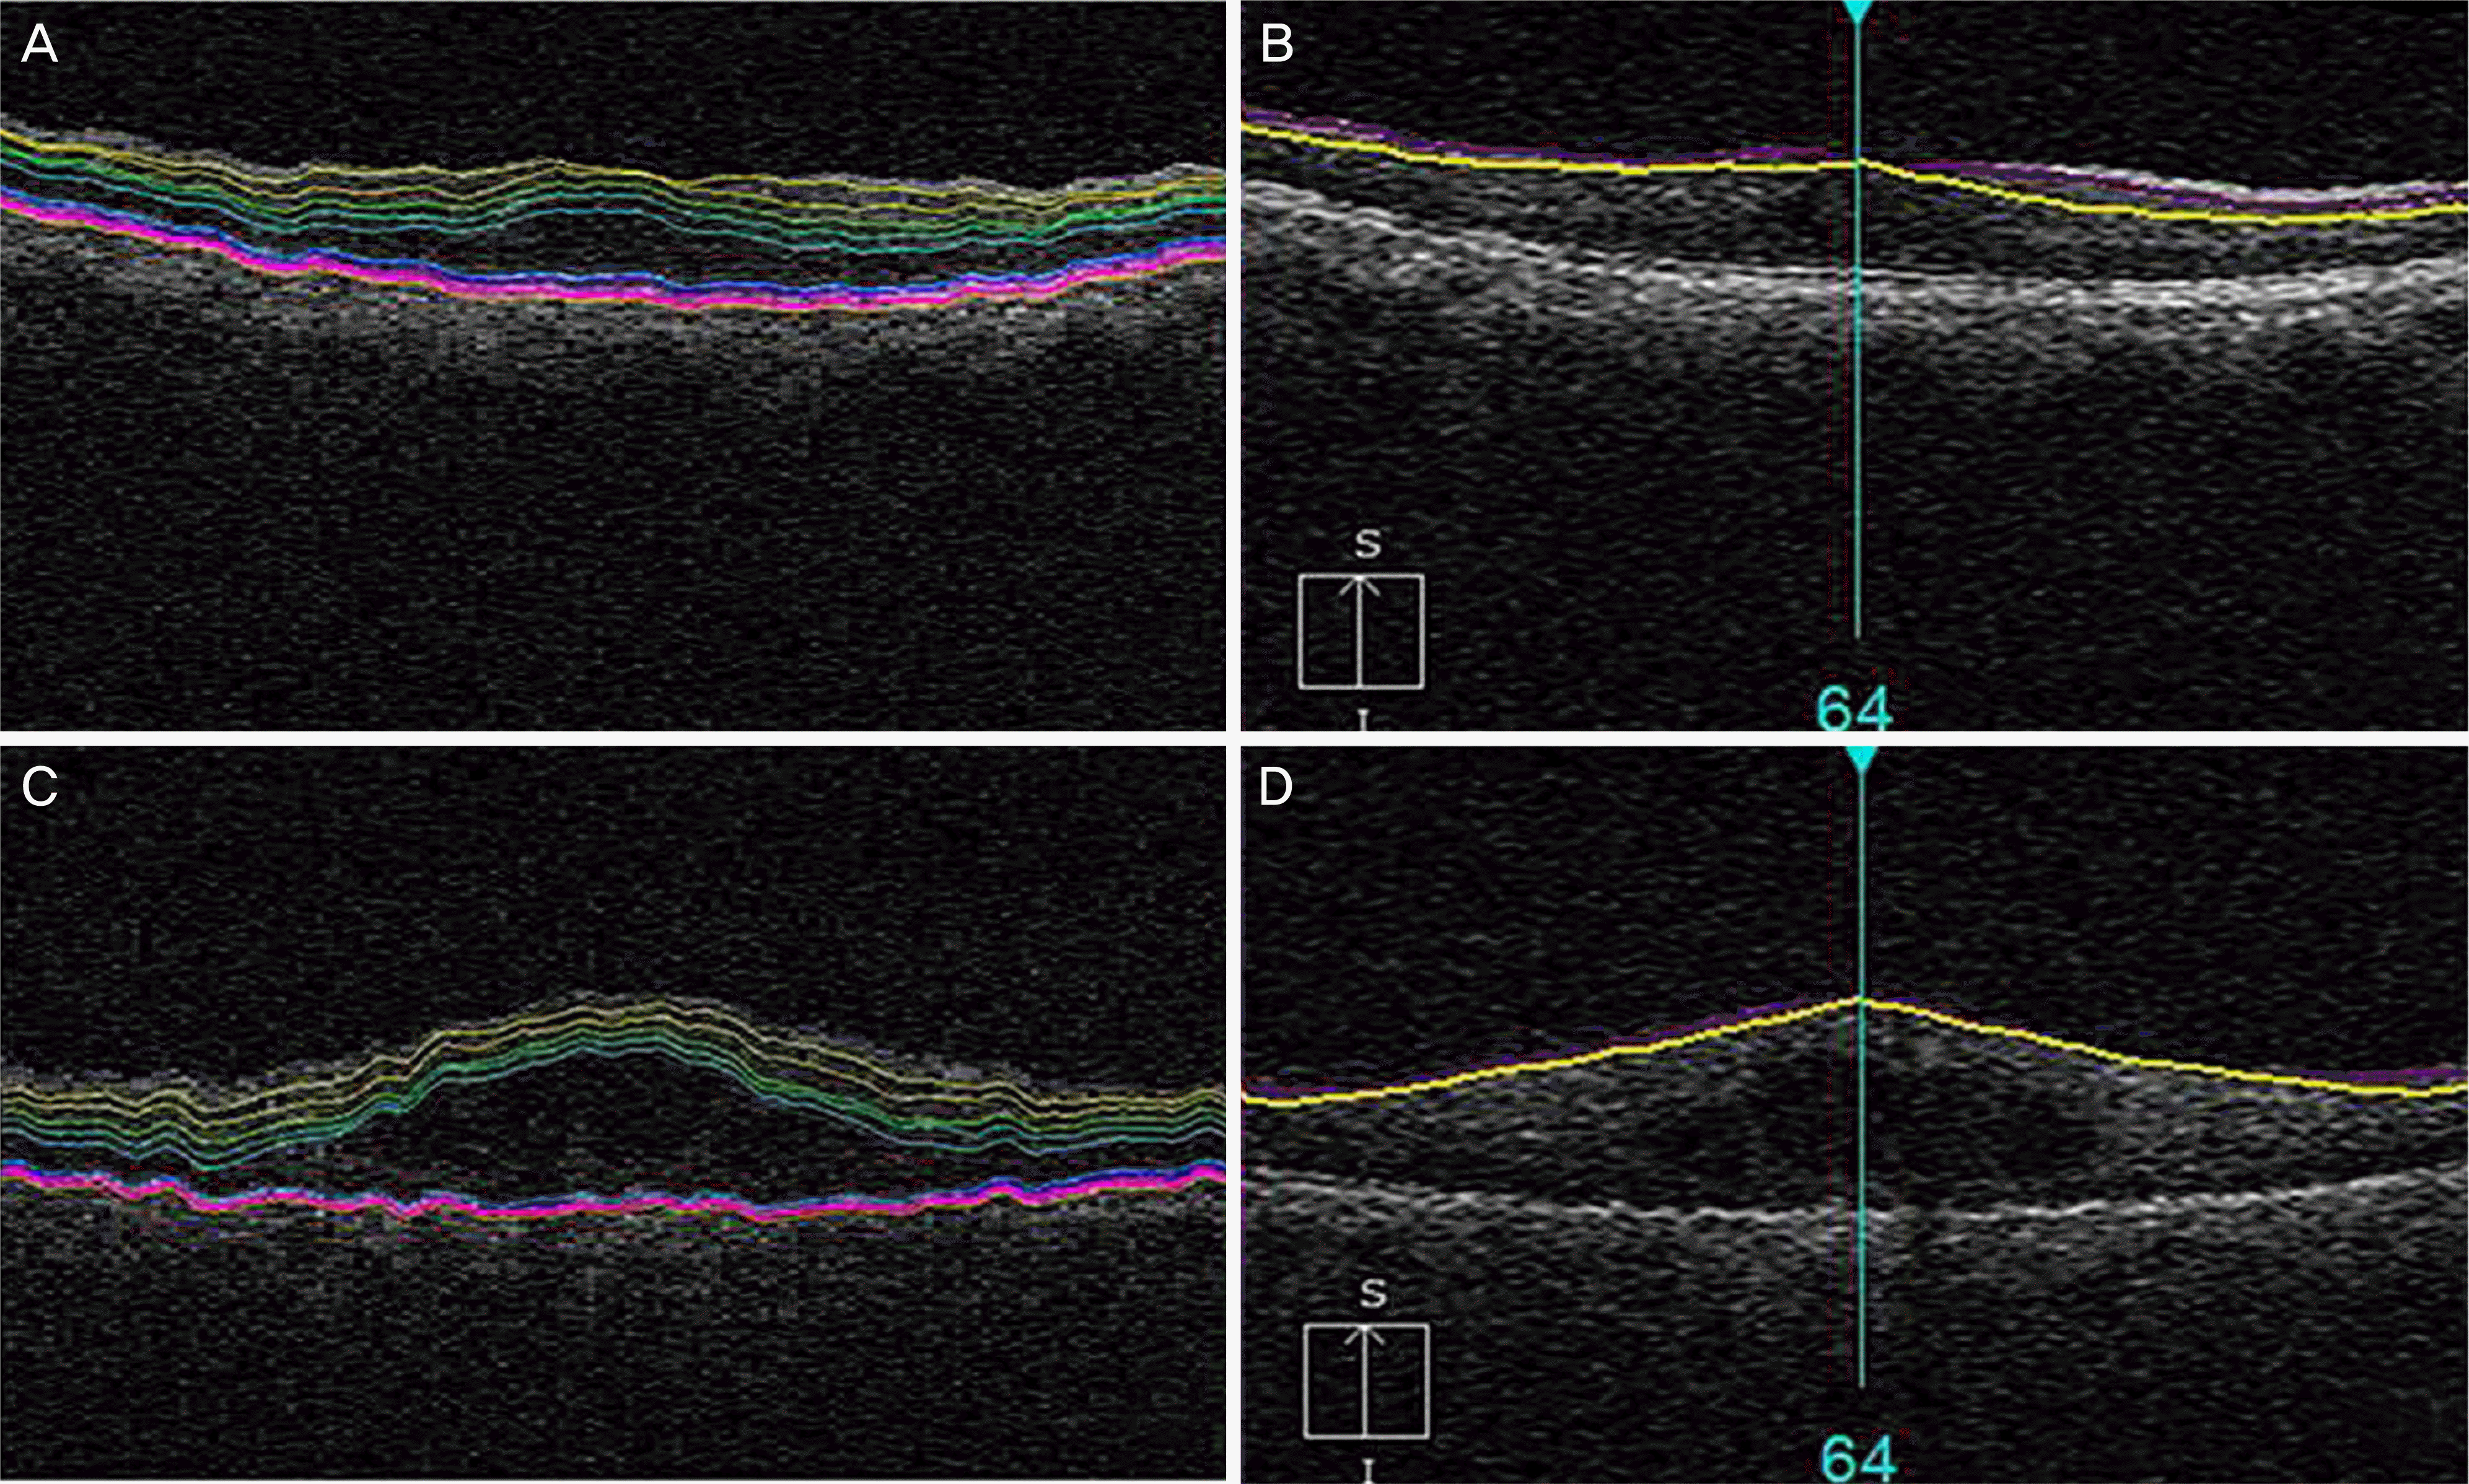
Figure 3.
Bland-Altman plot for the Cirrus versus Iowa algorithm. The solid line indicates the average mean difference, whereas dotted lines delineate 95% confidence intervals.
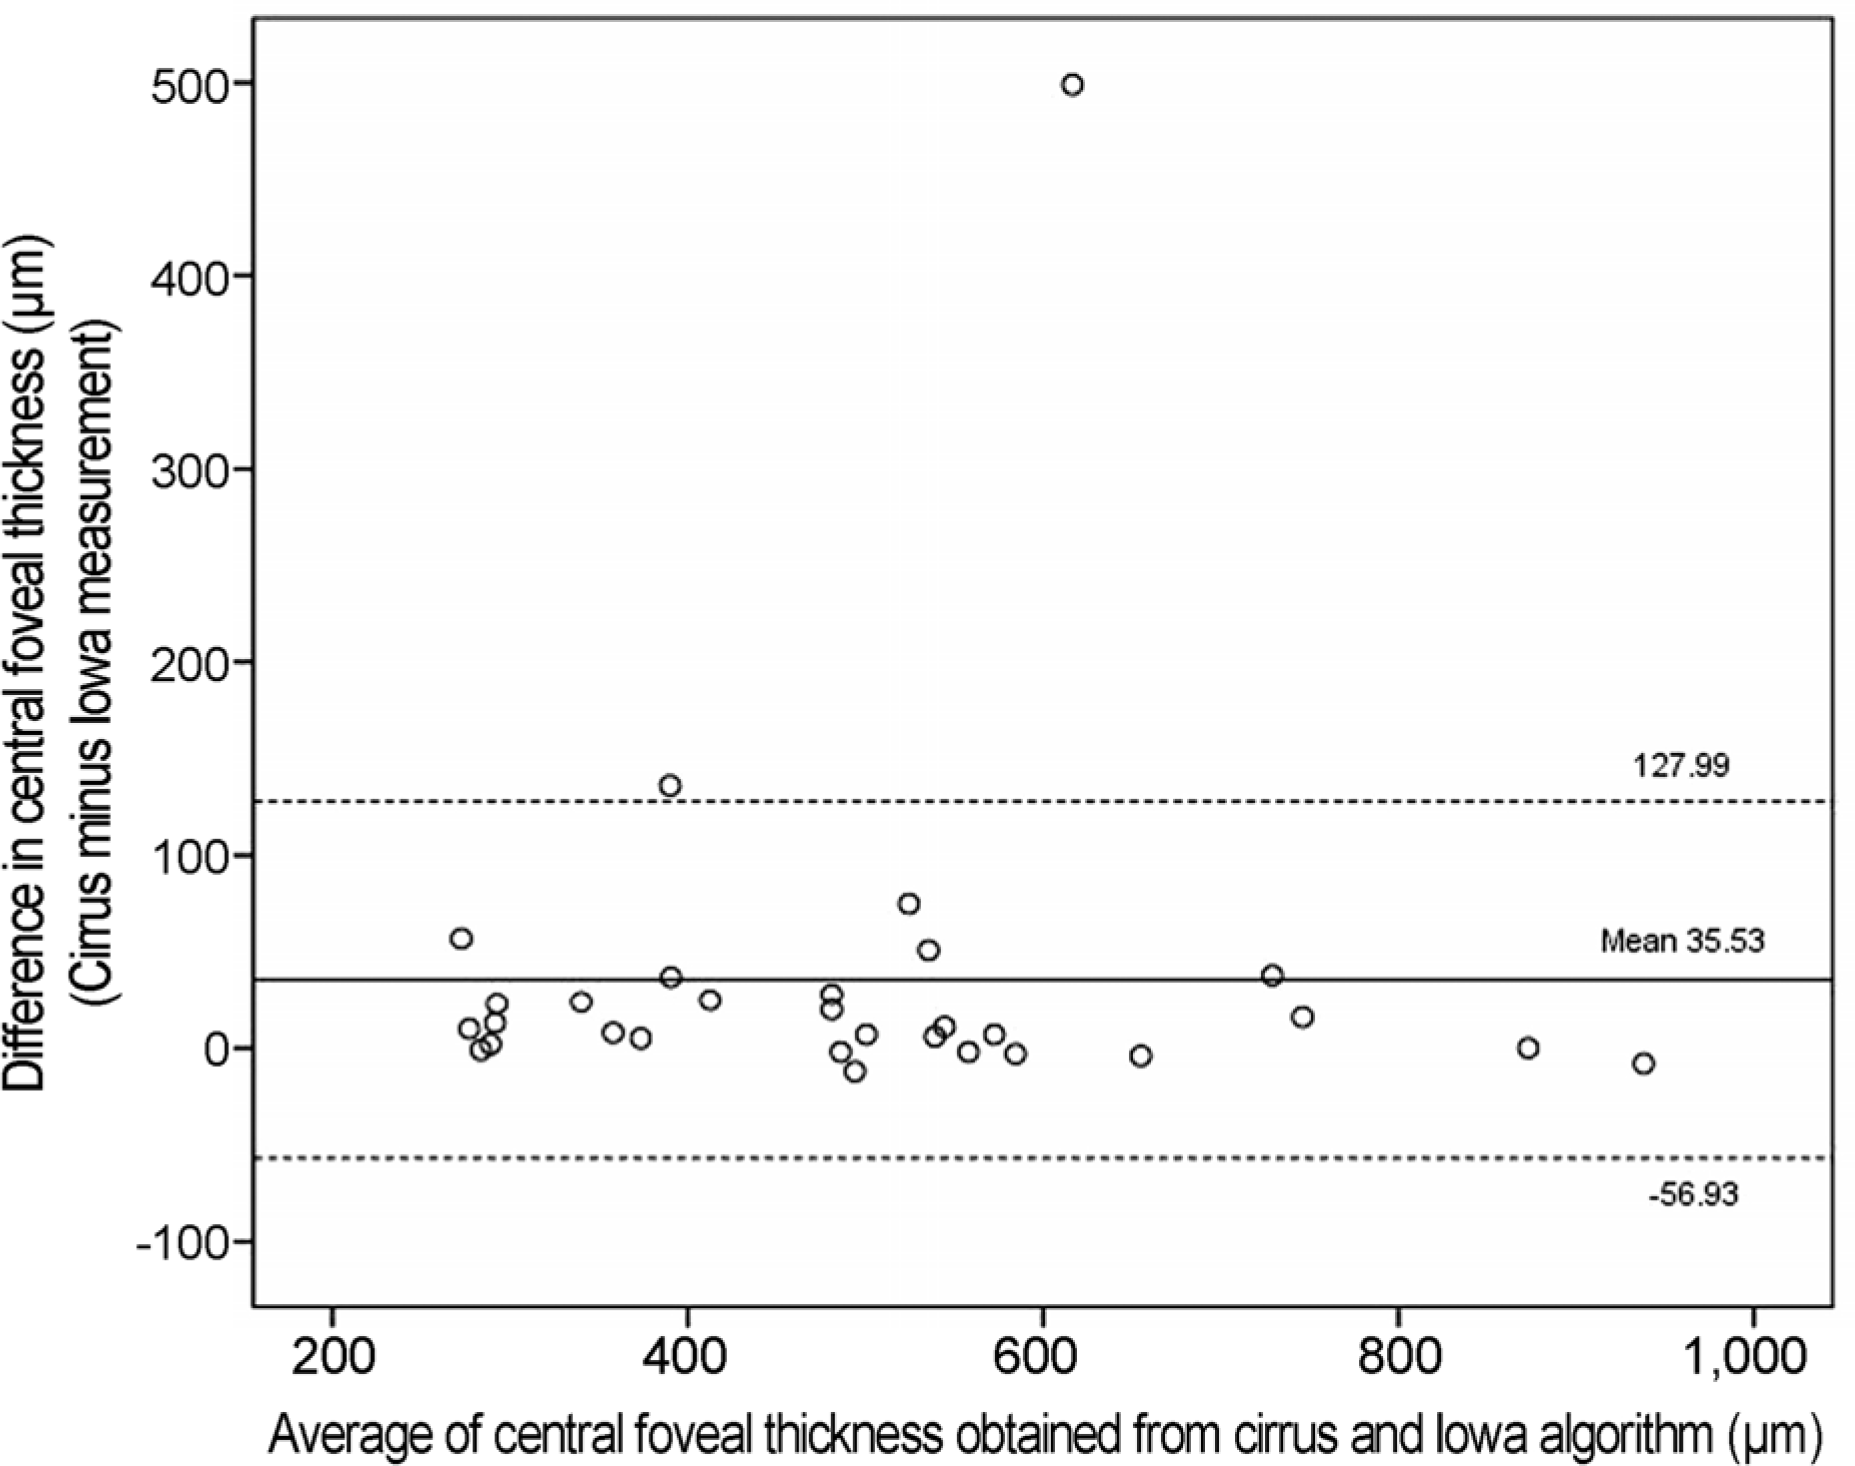
Figure 4.
Scatterplots of central foveal thickness obtained with the Cirrus software algorithm and the Iowa reference algorithm (Pearson correlation β = 0.868, p < 0.001).
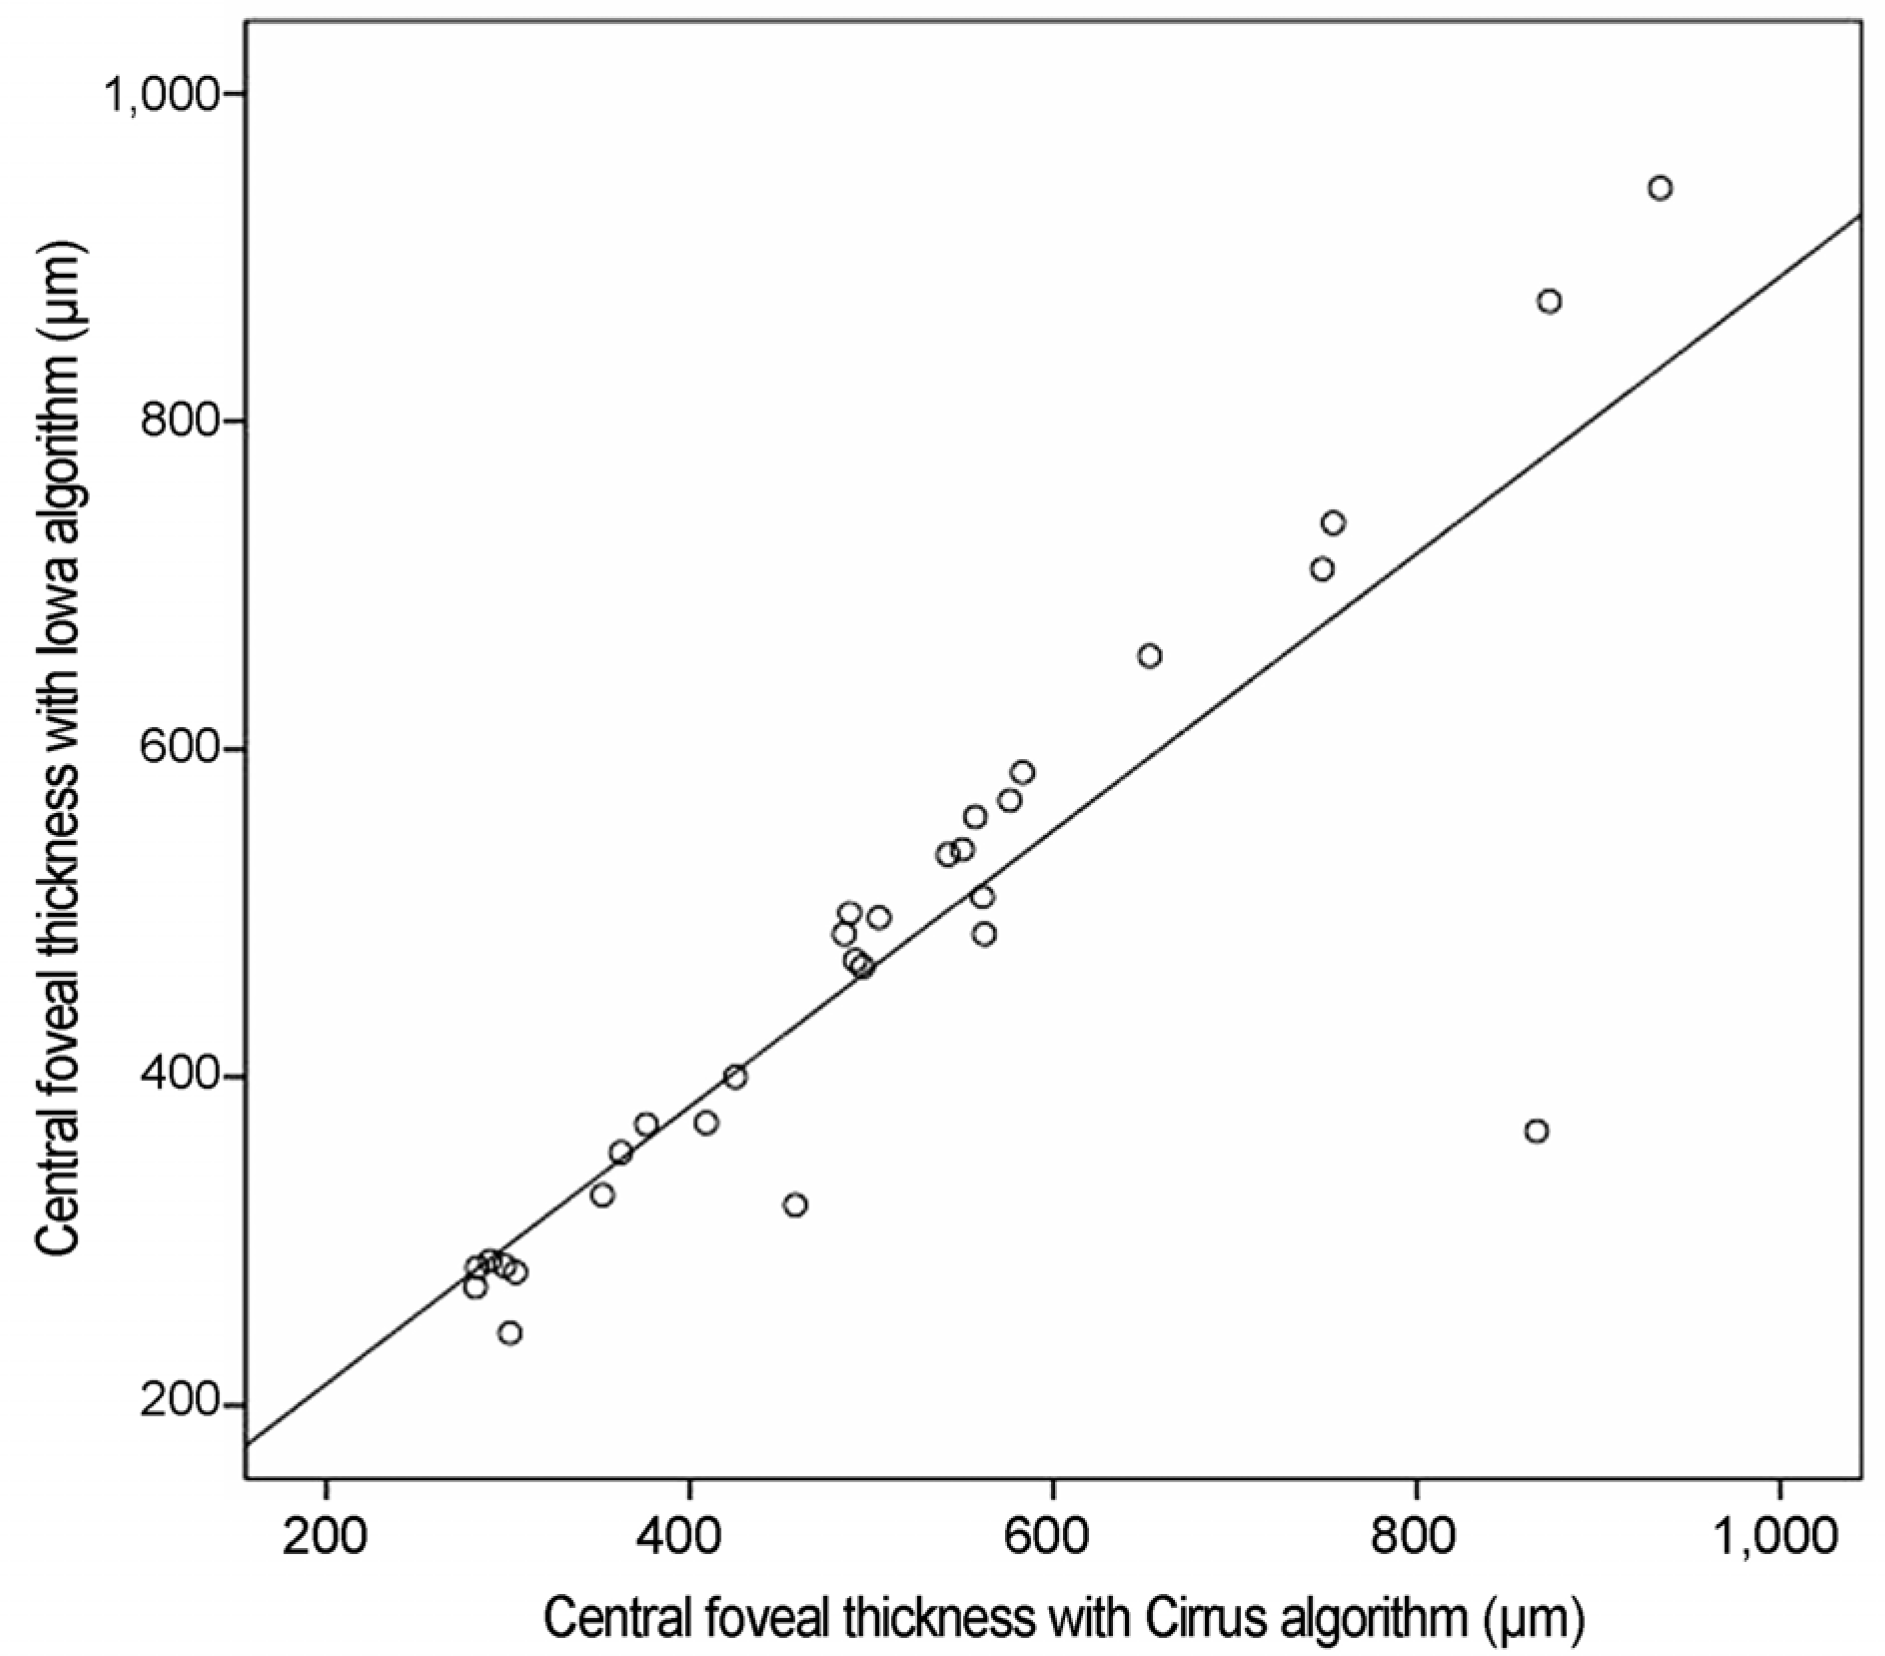
Figure 5.
Proportion of segmentation errors obtained with the Cirrus software algorithm and Iowa reference algorithm. CFT = central foveal thickness.
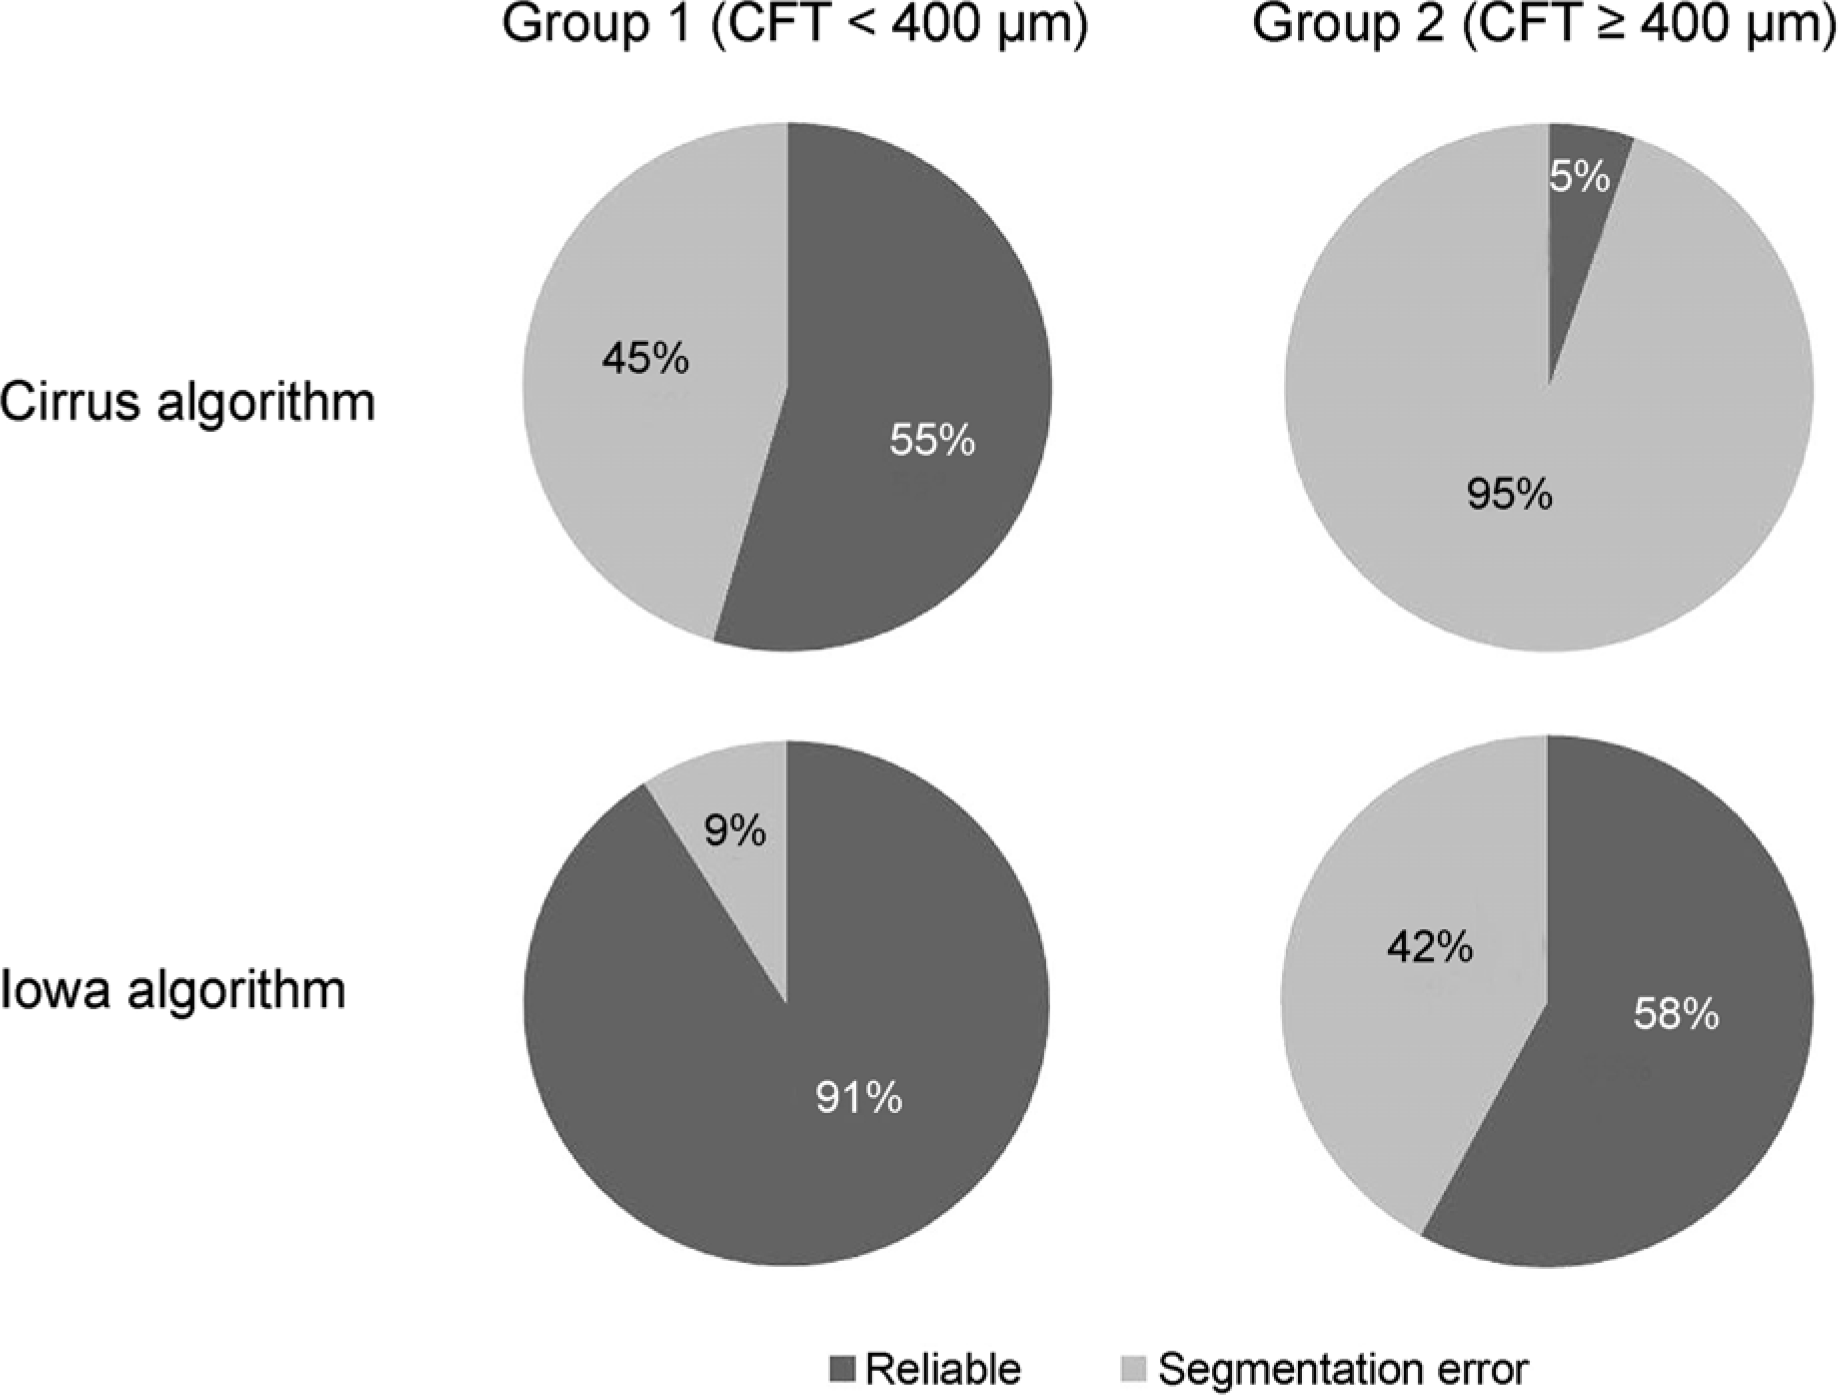
Table 1.
Demographics
| Total | Group 1∗ | Group 2† | |
|---|---|---|---|
| Number of eyes (patients) | 30 (23) | 11 (11) | 19 (12) |
| Sex (male:female) | 14:16 | 4:7 | 10:9 |
| Age (years) | 59.10 ± 12.24 | 56.55 ± 13.02 | 60.58 ± 11.88 |
| Laterality (OD:OS) | 18:12 | 8:3 | 10:9 |
| Visual acuity (letters) | 18.50 ± 11.35 | 25.63 ± 6.95 | 14.38 ± 11.47 |
Table 2.
Comparison of central foveal thicknesses (CFT) measured by the Cirrus algorithm and the Iowa algorithm
| Cirrus algorithm (μm) | Iowa algorithm (μm) | Mean paired difference (μm) | ICC (95% CI) | |
|---|---|---|---|---|
| Total | 512.07 ± 182.35 | 476.53 ± 177.22 | 35.53 ± 92.46 | 0.929 (0.851-0.966) |
| Group 1∗ | 337.73 ± 58.52 | 309.18 ± 42.88 | 28.55 ± 39.52 | 0.826 (0.352-0.953) |
| Group 2† | 613.00 ± 149.47 | 573.42 ± 150.18 | 39.58 ± 113.40 | 0.833 (0.566-0.936) |
 XML Download