Abstract
Purpose
To document alteration of the outer retinal layers and fundus autofluorescence (FAF) change in eyes with chronic central serous chorioretinopathy (CSCR).
Methods
Seventeen eyes of fifteen patients diagnosed with chronic CSCR from January 2014 to March 2015 with at least 6 months of follow-up and no history of surgery were enrolled in this study. Morphologic alterations in the retinal pigment epithelium (RPE), the photoreceptor inner segment/outer segment (IS/OS) junction layer, and the outer retina were evaluated by Spectral domain optical coherence tomography (SD-OCT). The FAF images were obtained via Heidelberg Retina Angiogram using a view mode of 30° and were described using distribution patterns of retinal autofluorescence compared to background autofluorescence. After tomographic alignment of the FAF intensities with the OCT findings, we analyzed and assessed the alteration of the outer retinal layers and the characteristics of retinal autofluorescence.
Results
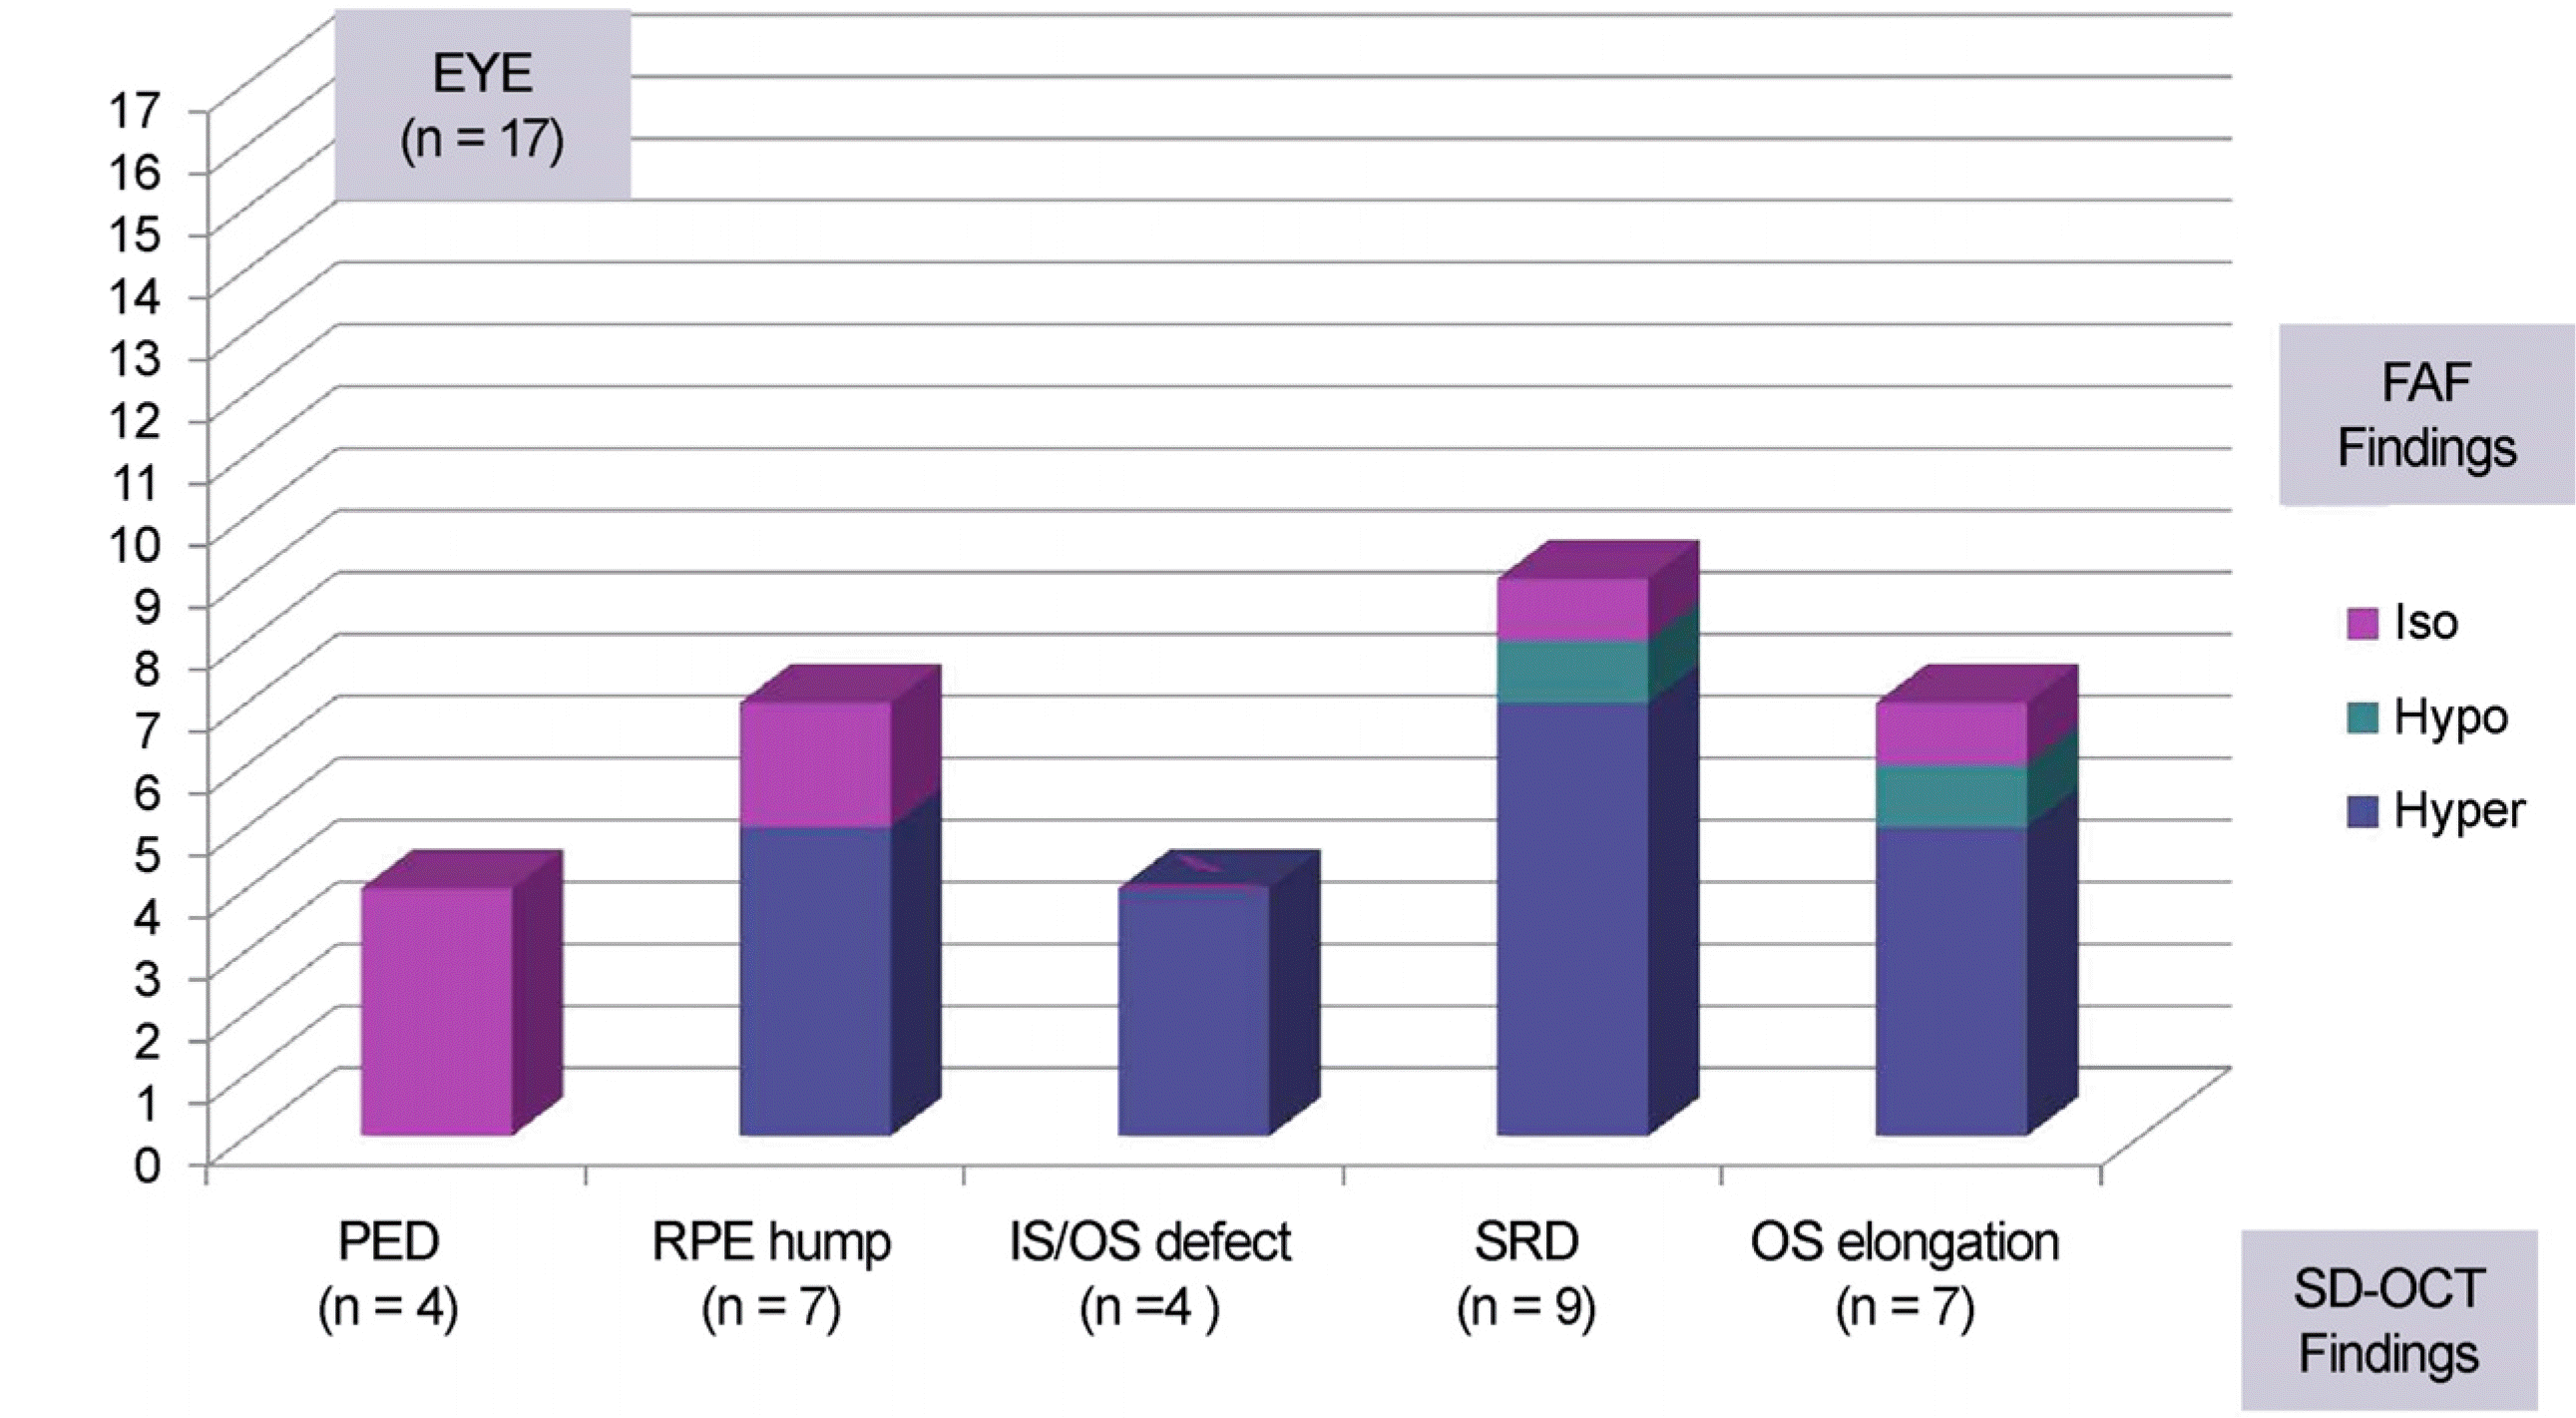
RPE detachment lesions in SD-OCT showed little or no change in autofluorescence pattern. Five of seven eyes with RPE humps in SD-OCT showed hyper-fluorescence in FAF. All of the eyes with defects or changes of the reflective line representing the IS/OS junction in SD-OCT correlated with hyper-fluorescence in FAF. Seven of nine eyes with persistent subretinal detachment (SRD) showed specific ring-shaped hyper-fluorescence in FAF matching up with the border of the SRD, and five eyes with photoreceptor OS elongation within SRD showed a granular type of hyper-fluorescence within the ring-shaped hyper-fluorescence in FAF.
Conclusions
In chronic CSCR, we found that RPE humps, the lesion IS/OS junction defect, the border of SRD, photoreceptor OS elongation in SD-OCT correlate with hyper-fluorescence lesions in FAF. The areas of the autofluorescence changes in the FAF images are associated with the extent of change in the RPE and outer retina.
Go to : 
References
1. Nicholson B. Noble J. Forooghian F. Meyerle C. Central serous chorioretinopathy: update on pathophysiology and treatment. Surv Ophthalmol. 2013; 58:103–26.

2. Ross A. Ross AH. Mohamed Q. Review and update of central serous chorioretinopathy. Curr Opin Ophthalmol. 2011; 22:166–73.

3. Kim YY. Flaxel CJ. Factors influencing the visual acuity of chronic central serous chorioretinopathy. Korean J Ophthalmol. 2011; 25:90–7.

4. Song IS. Shin YU. Lee BR. Time-periodic characteristics in the morphology of idiopathic central serous chorioretinaopthy evaluated by volume scan using spectral-domain optical coherence tomography. Am J Ophthalmol. 2012; 154:366–75.
5. von Rückmann A. Fitzke FW. Bird AC. Distribution of fundus autofluorescence with a scanning laser ophthalmoscope. Br J Ophthalmol. 1995; 79:407–12.
6. Yalcinbayir O. Gelisken O. Akova-Budak B, et al. Correlation of spectral domain optical coherence tomography findings and visual acuity in central serous chorioretinopathy. Retina. 2014; 34:705–12.

7. Framme C. Walter A. Gabler B, et al. Fundus autofluorescence in acute and chronic-recurrent central serous chorioretinopathy. Acta Ophthalmol Scand. 2005; 83:161–7.

8. Park YM. Lee MH. Lee JE. Oum BS. Fudnus autofluorescence in acute and chronic-recurrent central serous chorioretinopathy. J Korean Opthalmol Soc. 2009; 50:1353–8.
9. Roisman L. Lavinsky D. Magalhaes F, et al. Fundus autofluorescence and spectral domain OCT in central serous chorioretinopathy. J Ophthalmol. 2011; 2011:706849.

10. Sekiryu T. Iida T. Maruko I, et al. Infrared fundus autofluorescence and central serous chorioretinopathy. Invest Ophthalmol Vis Sci. 2010; 51:4956–62.

11. Spai de RF. Klancnik JM Jr. Fundus autofluorescence and central serous choroiretinopathy. Ophthalmology. 2005; 112:825–33.
12. Dinc UA. Tatlipinar S. Yenerel M, et al. Fundus autofluorescence in acute and chronic central serous chorioretinopathy. Clin Exp Optom. 2011; 94:452–7.

13. Teke MY. Elgin U. Nalcacioglu-Yuksekkaya P, et al. Comparison of autofluorescence and optical coherence tomography findings in acute and chronic central serous chorioretinopathy. Int J Ophthlmol. 2014; 7:350–4.
14. Spaide R. Autofluorescence from the outer retina and subretinal space: hypothesis and review. Retina. 2008; 28:5–35.
Go to : 
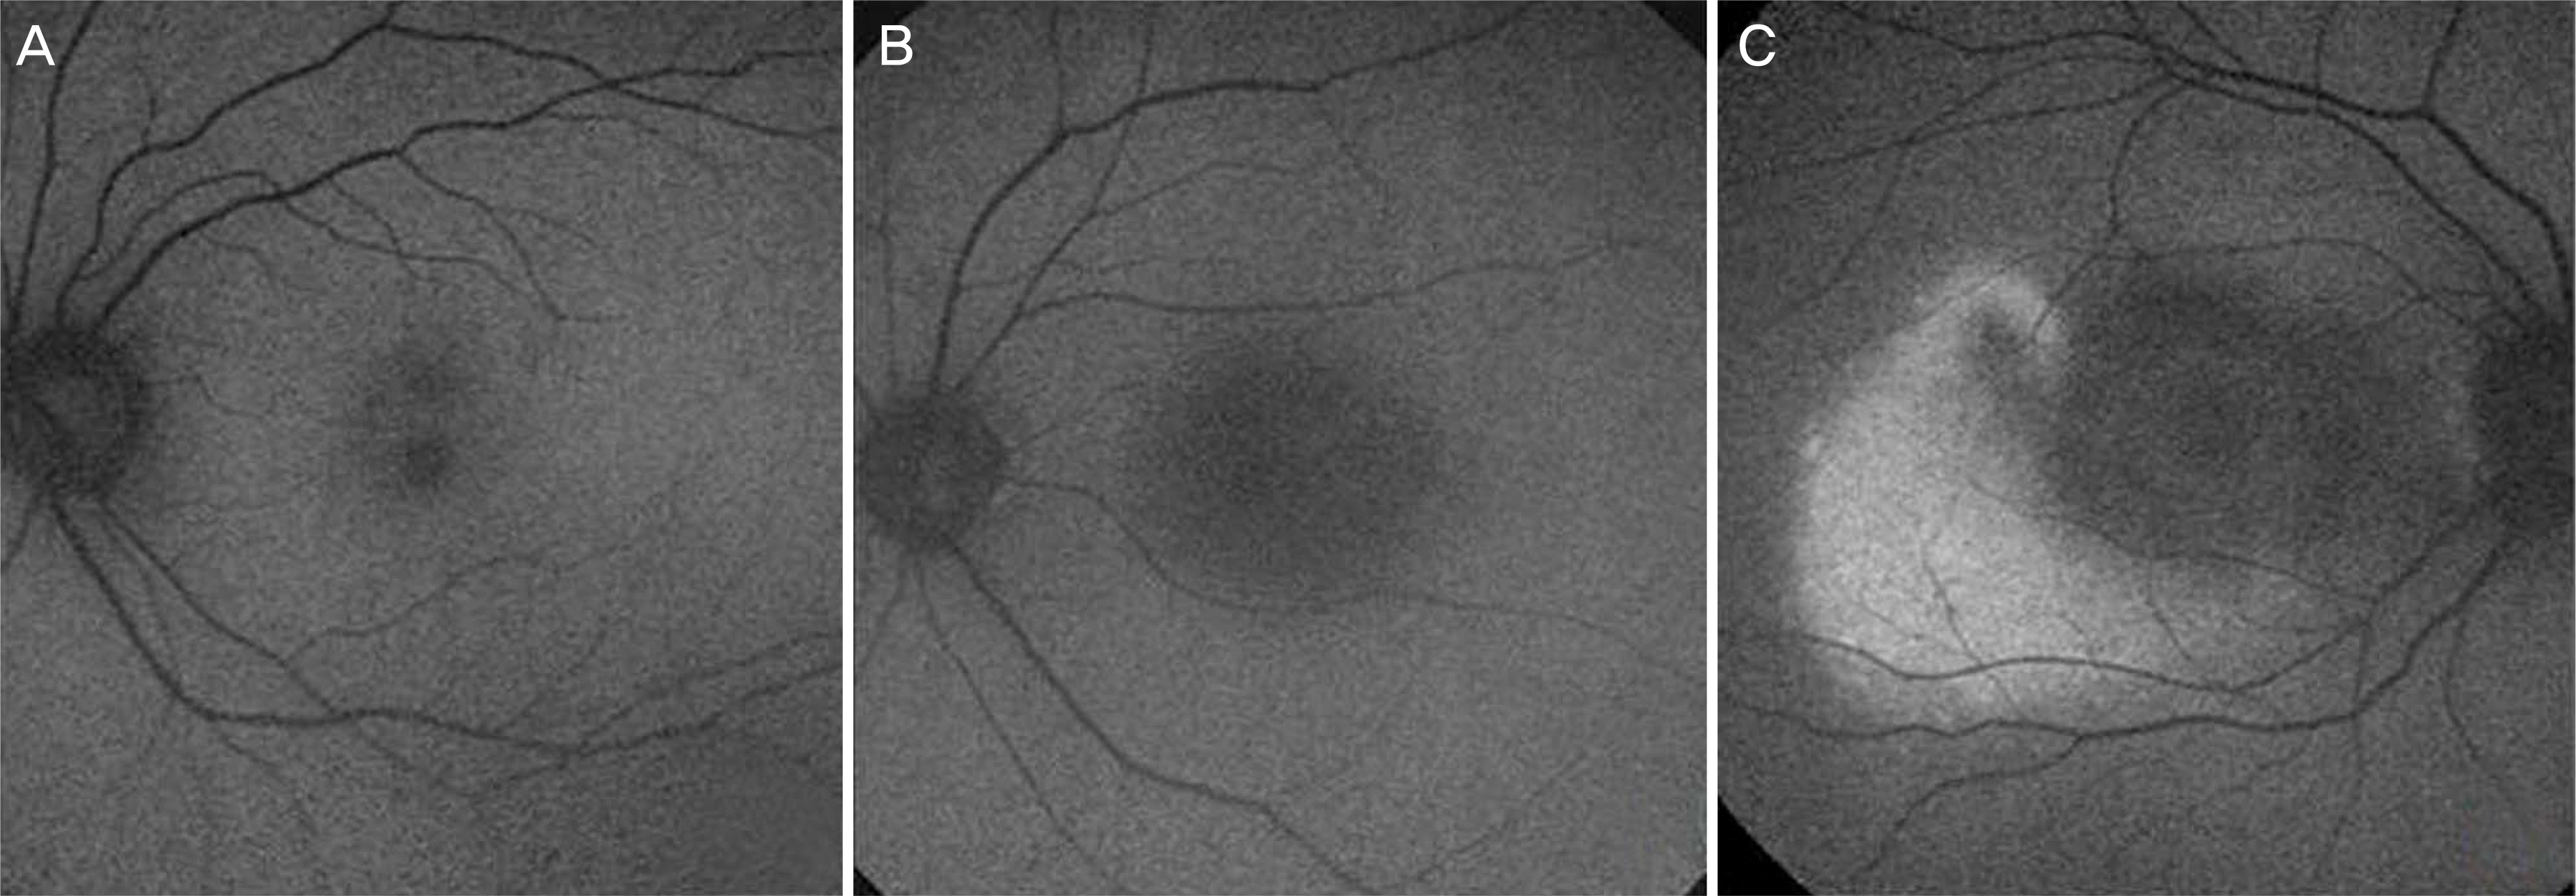
 | Figure 1.Fundus autofluorescence image classification compared to background autofluorescence. (A) Iso-fluorescence. (B) Hypo-fluorescence. (C) Hyper-fluorescence. |
 | Figure 2.Relation between altering the outer retina on spectral domain optical coherence tomography (SD-OCT) and the fundus autofluorescence image in chronic central serous chorioretinopathy. FAF = fundus autofluorescence; PED = pigment epithelial detachment; RPE hump = retinal pigment epithelium hump; IS/OS defect = inner and outer photoreceptor segment defect; SRD = serous retinal detachment; OS elongation = outer photo receptor segment elongation. |
 | Figure 3.Patient with 16 months of history of central serous chorioretinopathy in the left eye (Case 1). (A) Fundus autofluorescent image, presenting with diffuse hyper-fluorescence at the superior temporal area of the macula (white arrow area), normal perifoveal intensity (red arrow area). (B) Fluorescence angiography, showing several dots of leakage with window defect lesion. (C) Spectral domain-optical coherence tomography (SD-OCT) raster scan image, exhibiting semicircular pigment epithelial detachment (red arrows) with continuation of the inner segment/outer segment photoreceptor junction line. (D) SD-OCT raster scan image, showing the retinal pigment epithelium humps (white arrows). |
 | Figure 4.Patient with 11 month history of central serous chorioretinopathy in the right eye before treatment (Case 3). (A) Fundus autofluorescent image, presenting ring-shaped hyper-fluorescence (blue arrows) with more hyper-fluorescence at the bottom of the macular area (∗). (B) Fluorescence angiography image, window defect at the macular area with hyper-fluorescence. (C) Spectral domain-optical coherence tomography (SD-OCT) raster scan image, exhibiting neurosensory retinal detachment (SRD) (blue arrows) with elongation of the photoreceptor outer segments (yellow arrowheads). (D) SD-OCT raster scan image, showing accumulation of photo-sensitive materials at the bottom of SRD (∗). |
 | Figure 5.Patient with 12-month history of central serous chorioretinopathy in the right eye after focal laser photocoagulation (Case 9). (A) Fundus autofluorescent image, presenting with diffuse hyper-fluorescence at the temporal and inferior temporal areas of macula and ring-shaped hyper-fluorescence at the macular area (blue arrow area). The asterisks (∗) show retinal damage scarring by focal laser photocoagulation. (B) Fluorescence angiography, window defect at the superior temporal area with mild pooling of hyper-fluorescence at the late phase. (C) Spectral domain-optical coherence tomography (SD-OCT) raster scan image, exhibiting elongation of the photoreceptor outer segment (yellow arrowheads) at the neurosensory retinal detachment area (blue arrows). (D) SD-OCT raster scan image, showing discontinuation of the inner segment/outer segment photoreceptor junction line (yellow arrows). |
Table 1.
Baseline characteristics of chronic central serous chorioretinopathy patients
| Variable | Chronic CSCR (n = 17) |
|---|---|
| Age (years) | 53.70 ± 9.09 |
| Sex (male:female) | 12:5 |
| Laterality (right:left) | 11:6 |
| Baseline BCVA (log MAR) | 0.19 ± 0.22 |
| Duration of symptom (months) | 10.65 ± 2.60 |
Table 2.
Clinical correlation between SD-OCT and fundus autofluorescence in chronic CSCR


 PDF
PDF ePub
ePub Citation
 Print
Print


 XML Download