

 PDF
PDF ePub
ePub Citation
 Print
Print


Abstract
Purpose
To observe the shape of posterior vitreous spaces using swept-source optical coherence tomography (SS-OCT) in normal eyes.
Methods
The posterior vitreous of 80 eyes of 80 volunteers without ocular disease was imaged. The DRI OCT-1 Atlantis (Topcon, Oakland, NJ, USA) was used to acquire scans of the posterior vitreous over an 18 × 18-mm2 area using the 12-mm horizontal line scan protocol. The size of the premacularis bursa was measured by the aliper function of the OCT.
Go to : 
References
1. Barteselli G, Bartsch DU, El-Emam S, et al. Combined depth imaging technique on spectral-domain optical coherence tomography. Am J Ophthalmol. 2013; 155:727–32. 732.e1.

2. Hoehn F, Mirshahi A, Hattenbach LO. Optical coherence tomography for diagnosis of posterior vitreous detachment at the macular region. Eur J Ophthalmol. 2009; 19:442–7.
3. You JY, Kim HC, Moon JW. Comparison of the efficacy between time and spectral domain optical coherence tomography for the identification of vitreomacular interface. J Korean Ophthalmol Soc. 2013; 54:97–103.
4. Spaide RF. Measurement of the posterior precortical vitreous pocket in fellow eyes with posterior vitreous detachment and macular holes. Retina. 2003; 23:481–5.
5. Park HY, Shin HY, Park CK. Imaging the posterior segment of the eye using swept-source optical coherence tomography in myopic glaucoma eyes: comparison with enhanced-depth imaging. Am J Ophthalmol. 2014; 157:550–7.
6. Worst JG. Cisternal systems of the fully developed vitreous body in the young adult. Trans Ophthalmol Soc U K. 1977; 97:550–4.
7. Yokoi T, Toriyama N, Yamane T, et al. Development of a premacular vitreous pocket. JAMA Ophthalmol. 2013; 131:1095–6.
8. Kishi S, Shimizu K. Posterior precortical vitreous pocket. Arch Ophthalmol. 1990; 108:979–82.
9. Fisher YL, Slakter JS, Friedman RA, Yannuzzi LA. Kinetic ultrasound evaluation of the posterior vitreoretinal interface. Ophthalmology. 1991; 98:1135–8.
10. Perichon JY, Brasseur G, Uzzan J. Ultrasonographic study of posterior vitreous detachment in emmetropic eyes. J Fr Ophtalmol. 1993; 16:538–44.
11. Shin YU, Lee BR, Lim HW. A comparison of image quality between swept source optical coherence tomography and spectral domain optical coherence tomography according to ocular media opacity. Invest Ophthalmol Vis Sci. 2014; 55:3359.
12. Park SM, Cho SW, Lee TG. Swept source optical coherence tomography findings in gas-filled eyes after macular hole surgery. J Korean Ophthalmol Soc. 2015; 56:1386–91.
13. Itakura H, Kishi S, Li D, Akiyama H. Observation of posterior precortical vitreous pocket using swept-source optical coherence tomography. Invest Ophthalmol Vis Sci. 2013; 54:3102–7.
14. Stanga PE, Sala-Puigdollers A, Caputo S, et al. In vivo imaging of cortical vitreous using 1050-nm swept-source deep range imaging optical coherence tomography. Am J Ophthalmol. 2014; 157:397–404.e2.
15. Itakura H, Kishi S. Alterations of posterior precortical vitreous pockets with positional changes. Retina. 2013; 33:1417–20.
16. Uchino E, Uemura A, Ohba N. Initial stages of posterior vitreous detachment in healthy eyes of older persons evaluated by optical coherence tomography. Arch Ophthalmol. 2001; 119:1475–9.
17. Mojana F, Kozak I, Oster SF, et al. Observations by spectral-domain optical coherence tomography combined with simultaneous scanning laser ophthalmoscopy: imaging of the vitreous. Am J Ophthalmol. 2010; 149:641–50.
18. Itakura H, Kishi S. Aging changes of vitreomacular interface. Retina. 2011; 31:1400–4.
19. Li D, Kishi S, Itakura H, et al. Posterior precortical vitreous pockets and connecting channels in children on swept-source optical coherence tomography. Invest Ophthalmol Vis Sci. 2014; 55:2412–6.
Go to :
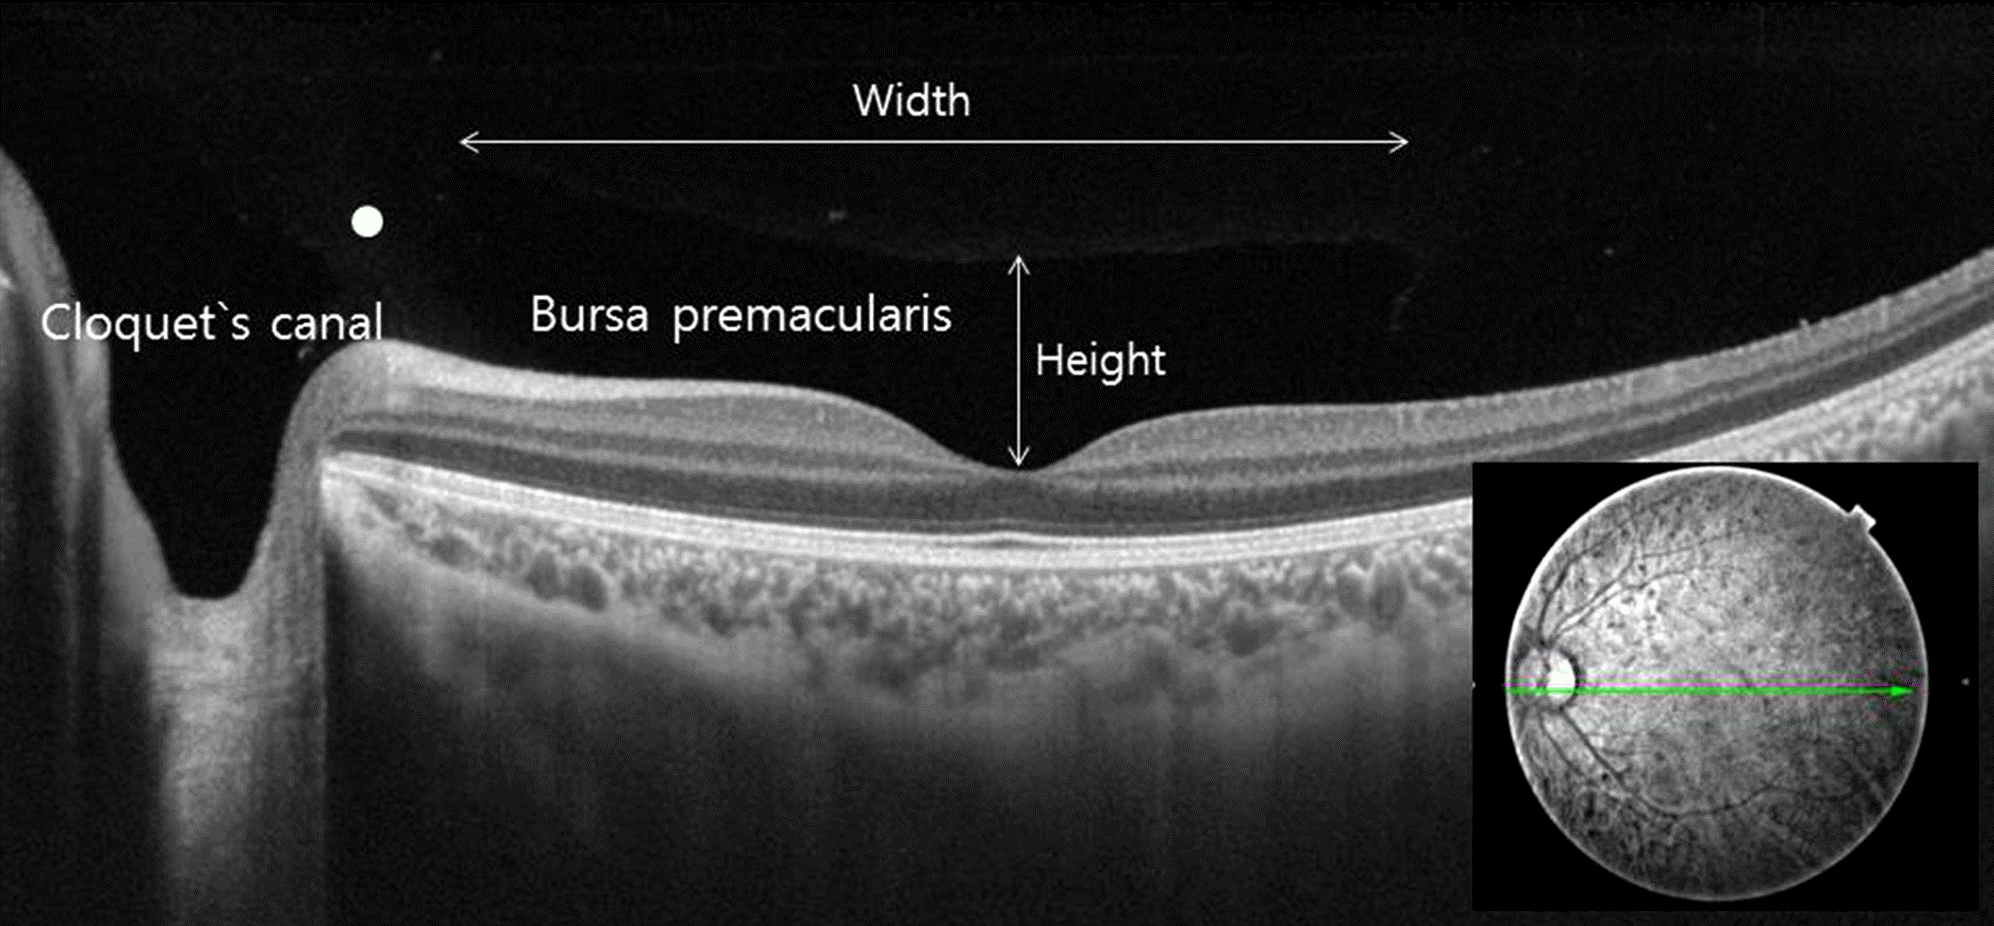 | Figure 1.Evaluation of cortical vitreous using SS-OCT. An OCT 12-mm horizontal scan through the fovea in the left eye of a 57-year-old man. To improve visualization, the brightness and contrast were increased. The height of the bursa premacularis is defined as the distance between the fovea and the anterior border, and the width is the maximum diameter in the 12-mm horizontal scan through the fovea and the disc. The white dot indicates the septum between the bursa premacularis and Cloquet's canal. SS-OCT = swept-source optical coherence tomography. |
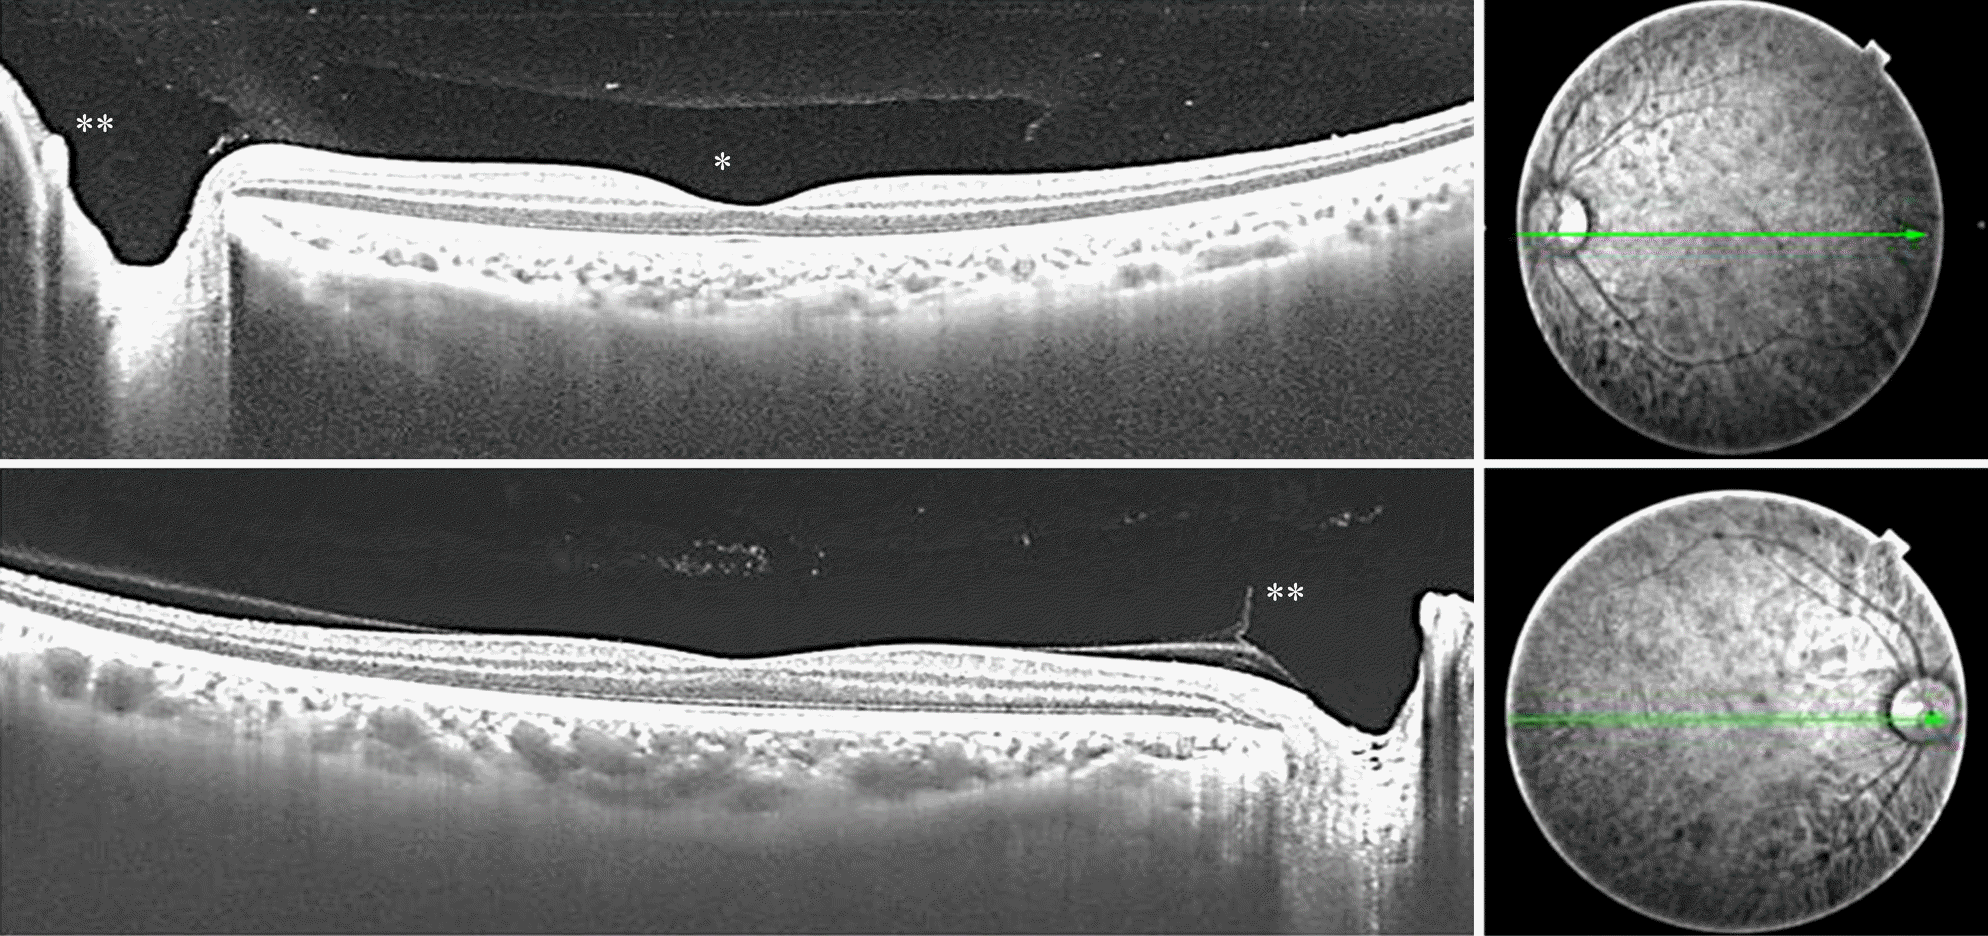 | Figure 2.Swept-source optical coherence tomography of the cortical vitreous. A horizontal scan through the fovea and the optic disc showed a boat-shaped bursa premacularis (*). In front of the optic disc, the Cloquet's canal (**) was connected to the bursa premacularis. |
 | Figure 3.Classification of posterior vitreous detachment (PVD). ‘’ indicates the border of posterior vitreous. (A) No PVD. (B) PVD stage 1. (C) PVD stage 2. (D) PVD stage 3. |
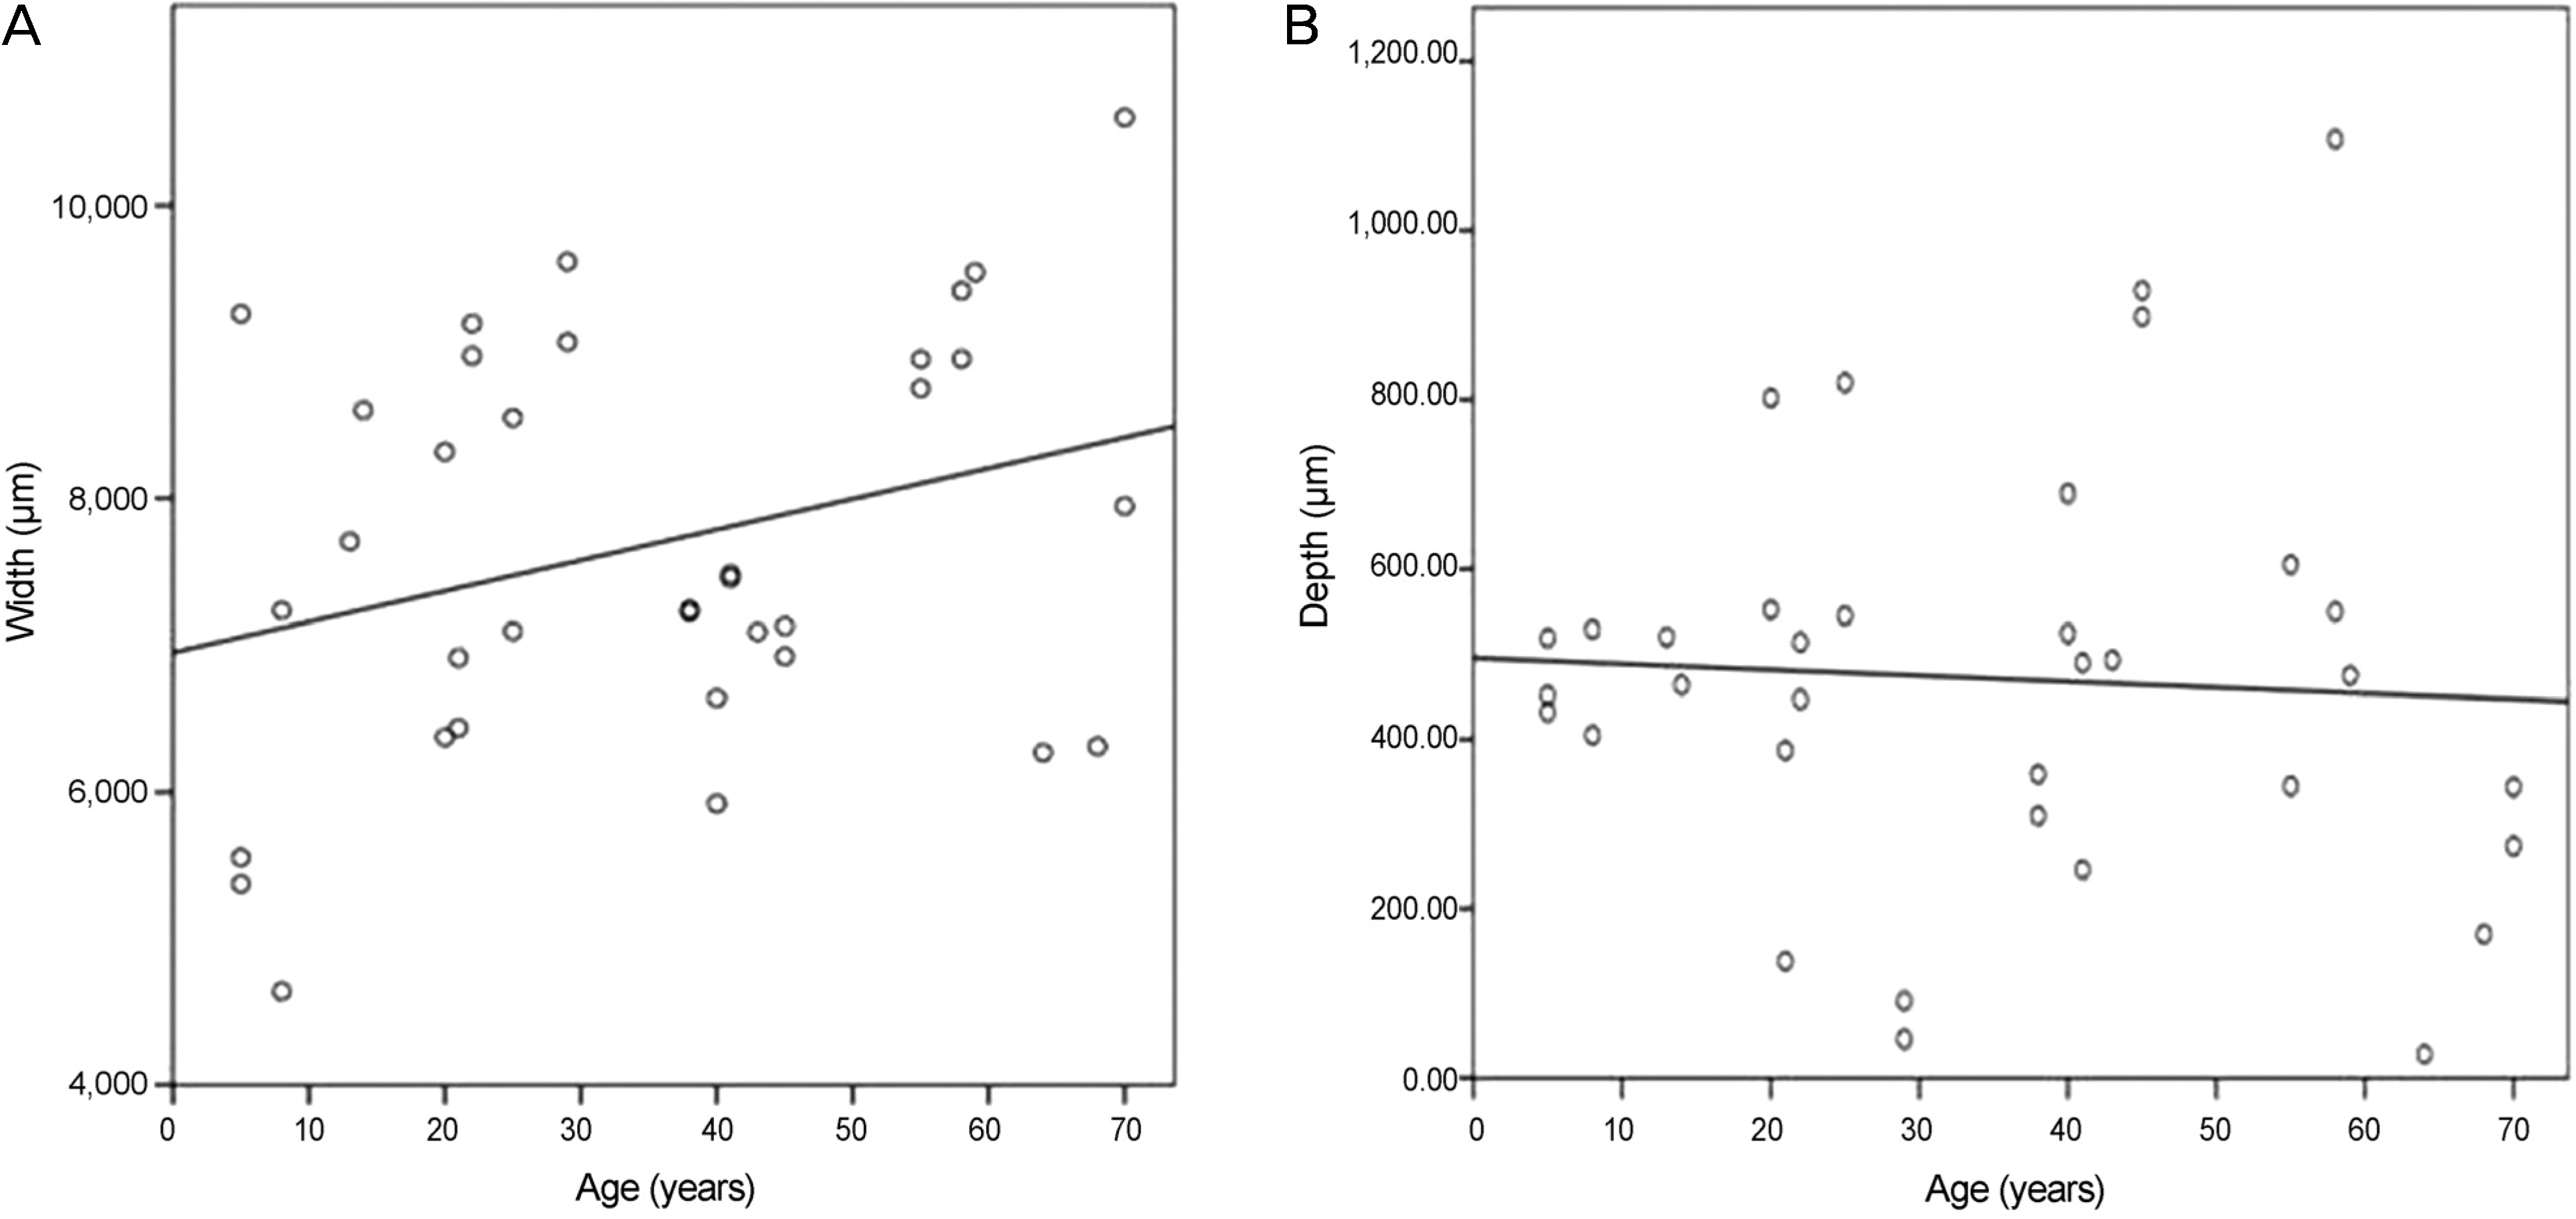 | Figure 4.Correlation of variation in width and depth of the bursa premacularis with patient age. There was no correlation between variation in width and patient age (R2 = 0.09; A), and between variation in depth and patient age (R2 = 0.03; B). |
Table 1.
Number of eyes and prevalence of the bursa premacularis in the cortical vitreous according to PVD stage
|
Eyes |
Prevalence of bursa premacularis |
|||
|---|---|---|---|---|
| % | No. | % | No. | |
| No PVD | 58.75 | 47 | 91.5 | 43/47 |
| PVD stage 1* | 8.75 | 7 | 28.6 | 2/7 |
| PVD stage 2† | 10 | 8 | 12.5 | 1/8 |
| PVD stage 3‡ | 5 | 4 | 25 | 1/4 |
| PVD stage 4§ | 0 | 0 | − | 0 |
| Not gradable | 17.5 | 14 | 21.4 | 3/14 |
| Total | 100 | 80 | − | 50/80 |
 XML Download