Abstract
Purpose
To evaluate the differences in dry eye and meibomian gland dysfunction (MGD) by comparing ocular surface status before and after wearing an orthokeratologic (OK) lens and rigid gas permeable (RGP) lens made of the same material.
Methods
The ocular surface and meibomian gland statuses of 12 eyes of 12 OK lens wearers (OK lens group) and 16 eyes of 16 RGP wearers (RGP lens group) were evaluated before and 1 and 3 months after lens wearing. Ocular surface disease index (OSDI), tear film break-up time (TBUT), Schirmer's test I, and ocular surface staining score were evaluated for ocular surface parameters. Meibomian gland function was evaluated by assessing lid margin abnormality, meibomian gland expressibility, and meibum quality.
Results
TBUT and ocular surface staining score after 1 and 3 months of wearing an OK lens were significantly aggravated (p = 0.004, p < 0.001). The MGD grade, lid margin abnormality, meibomian gland expressibility, and meibum quality were aggravated after 1 and 3 months of wearing an OK lens (p < 0.001, p < 0.001, p < 0.001, p = 0.002). After 1 and 3 months of wearing an RGP lens, OSDI, TBUT, and ocular surface staining score were aggravated (all p < 0.001). The MGD grade, lid margin abnormality, meibomian gland expressibility, and meibum quality were aggravated after 1 and 3 months of wearing an RGP lens (all p < 0.001). MGD grade, lid margin abnormality, meibomian gland expressibility, and meibum quality were significantly more aggravated in the RGP lens group than in the OK lens group after 3 months (p < 0.001, p < 0.001, p = 0.001, p < 0.001).
References
1. Kim JH, Song JS, Hyon JY, et al. A survey of contact lens-related complications in Korea: The Korean Contact Lens Study Society. J Korean Ophthalmol Soc. 2014; 55:20–31.

2. Nichols JJ, Mitchell GL, Nichols KK, et al. The performance of the contact lens dry eye questionnaire as a screening survey for contact lens-related dry eye. Cornea. 2002; 21:469–75.

3. Begley CG, Chalmers RL, Mitchell GL, et al. Characterization of ocular surface symptoms from optometric practices in North America. Cornea. 2001; 20:610–8.

4. Begley CG, Caffery B, Nichols KK, Chalmers R. Responses of contact lens wearers to a dry eye survey. Optom Vis Sci. 2000; 77:40–6.

5. Pisella PJ, Malet F, Lejeune S, et al. Ocular surface changes induced by contact lens wear. Cornea. 2001; 20:820–5.

6. Lemp MA. Report of the National Eye Institute/Industry workshop on clinical trials in dry eyes. CLAO J. 1995; 21:221–32.
7. Hatfield RO, Jordan DR, Bennett ES, et al. Initial comfort and surface wettability: a comparison between different contact lens materials. J Am Optom Assoc. 1993; 64:271–3.
8. Iskeleli G, Karakoç Y, Aydin O, et al. Comparison of tear-film osmolarity in different types of contact lenses. CLAO J. 2002; 28:174–6.
9. Arita R, Itoh K, Inoue K, et al. Contact lens wear is associated with decrease of meibomian glands. Ophthalmology. 2009; 116:379–84.

10. Ong BL, Larke JR. Meibomian gland dysfunction: some clinical, biochemical and physical observations. Ophthalmic Physiol Opt. 1990; 10:144–8.

11. Henriquez AS, Korb DR. Meibomian glands and contact lens wear. Br J Ophthalmol. 1981; 65:108–11.

12. Van Der Worp E, De Brabander J, Swarbrick H, Hendrikse F. Eyeblink frequency and type in relation to 3- and 9-o'clock staining and gas permeable contact lens variables. Optom Vis Sci. 2008; 85:E857–66.

13. Watt K, Swarbrick HA. Microbial keratitis in overnight orthokeratology: review of the first 50 cases. Eye Contact Lens. 2005; 31:201–8.

14. Chan B, Cho P, Cheung SW. Orthokeratology practice in children in a university clinic in Hong Kong. Clin Exp Optom. 2008; 91(4):53–60.

15. Jeon JH, Kim HS, Jung JW, et al. Effect of cyclosporin A on tear film and corneal aberration after cataract surgery. J Korean Ophthalmol Soc. 2014; 55:978–83.

16. Nichols KK, Foulks GN, Bron AJ, et al. The international workshop on meibomian gland dysfunction: executive summary. Invest Ophthalmol Vis Sci. 2011; 52:1922–9.

17. Ong BL. Relation between contact lens wear and meibomian gland dysfunction. Optom Vis Sci. 1996; 73:208–10.

18. Korb DR, Henriquez AS. Meibomian gland dysfunction and contact lens intolerance. J Am Optom Assoc. 1980; 51:243–51.
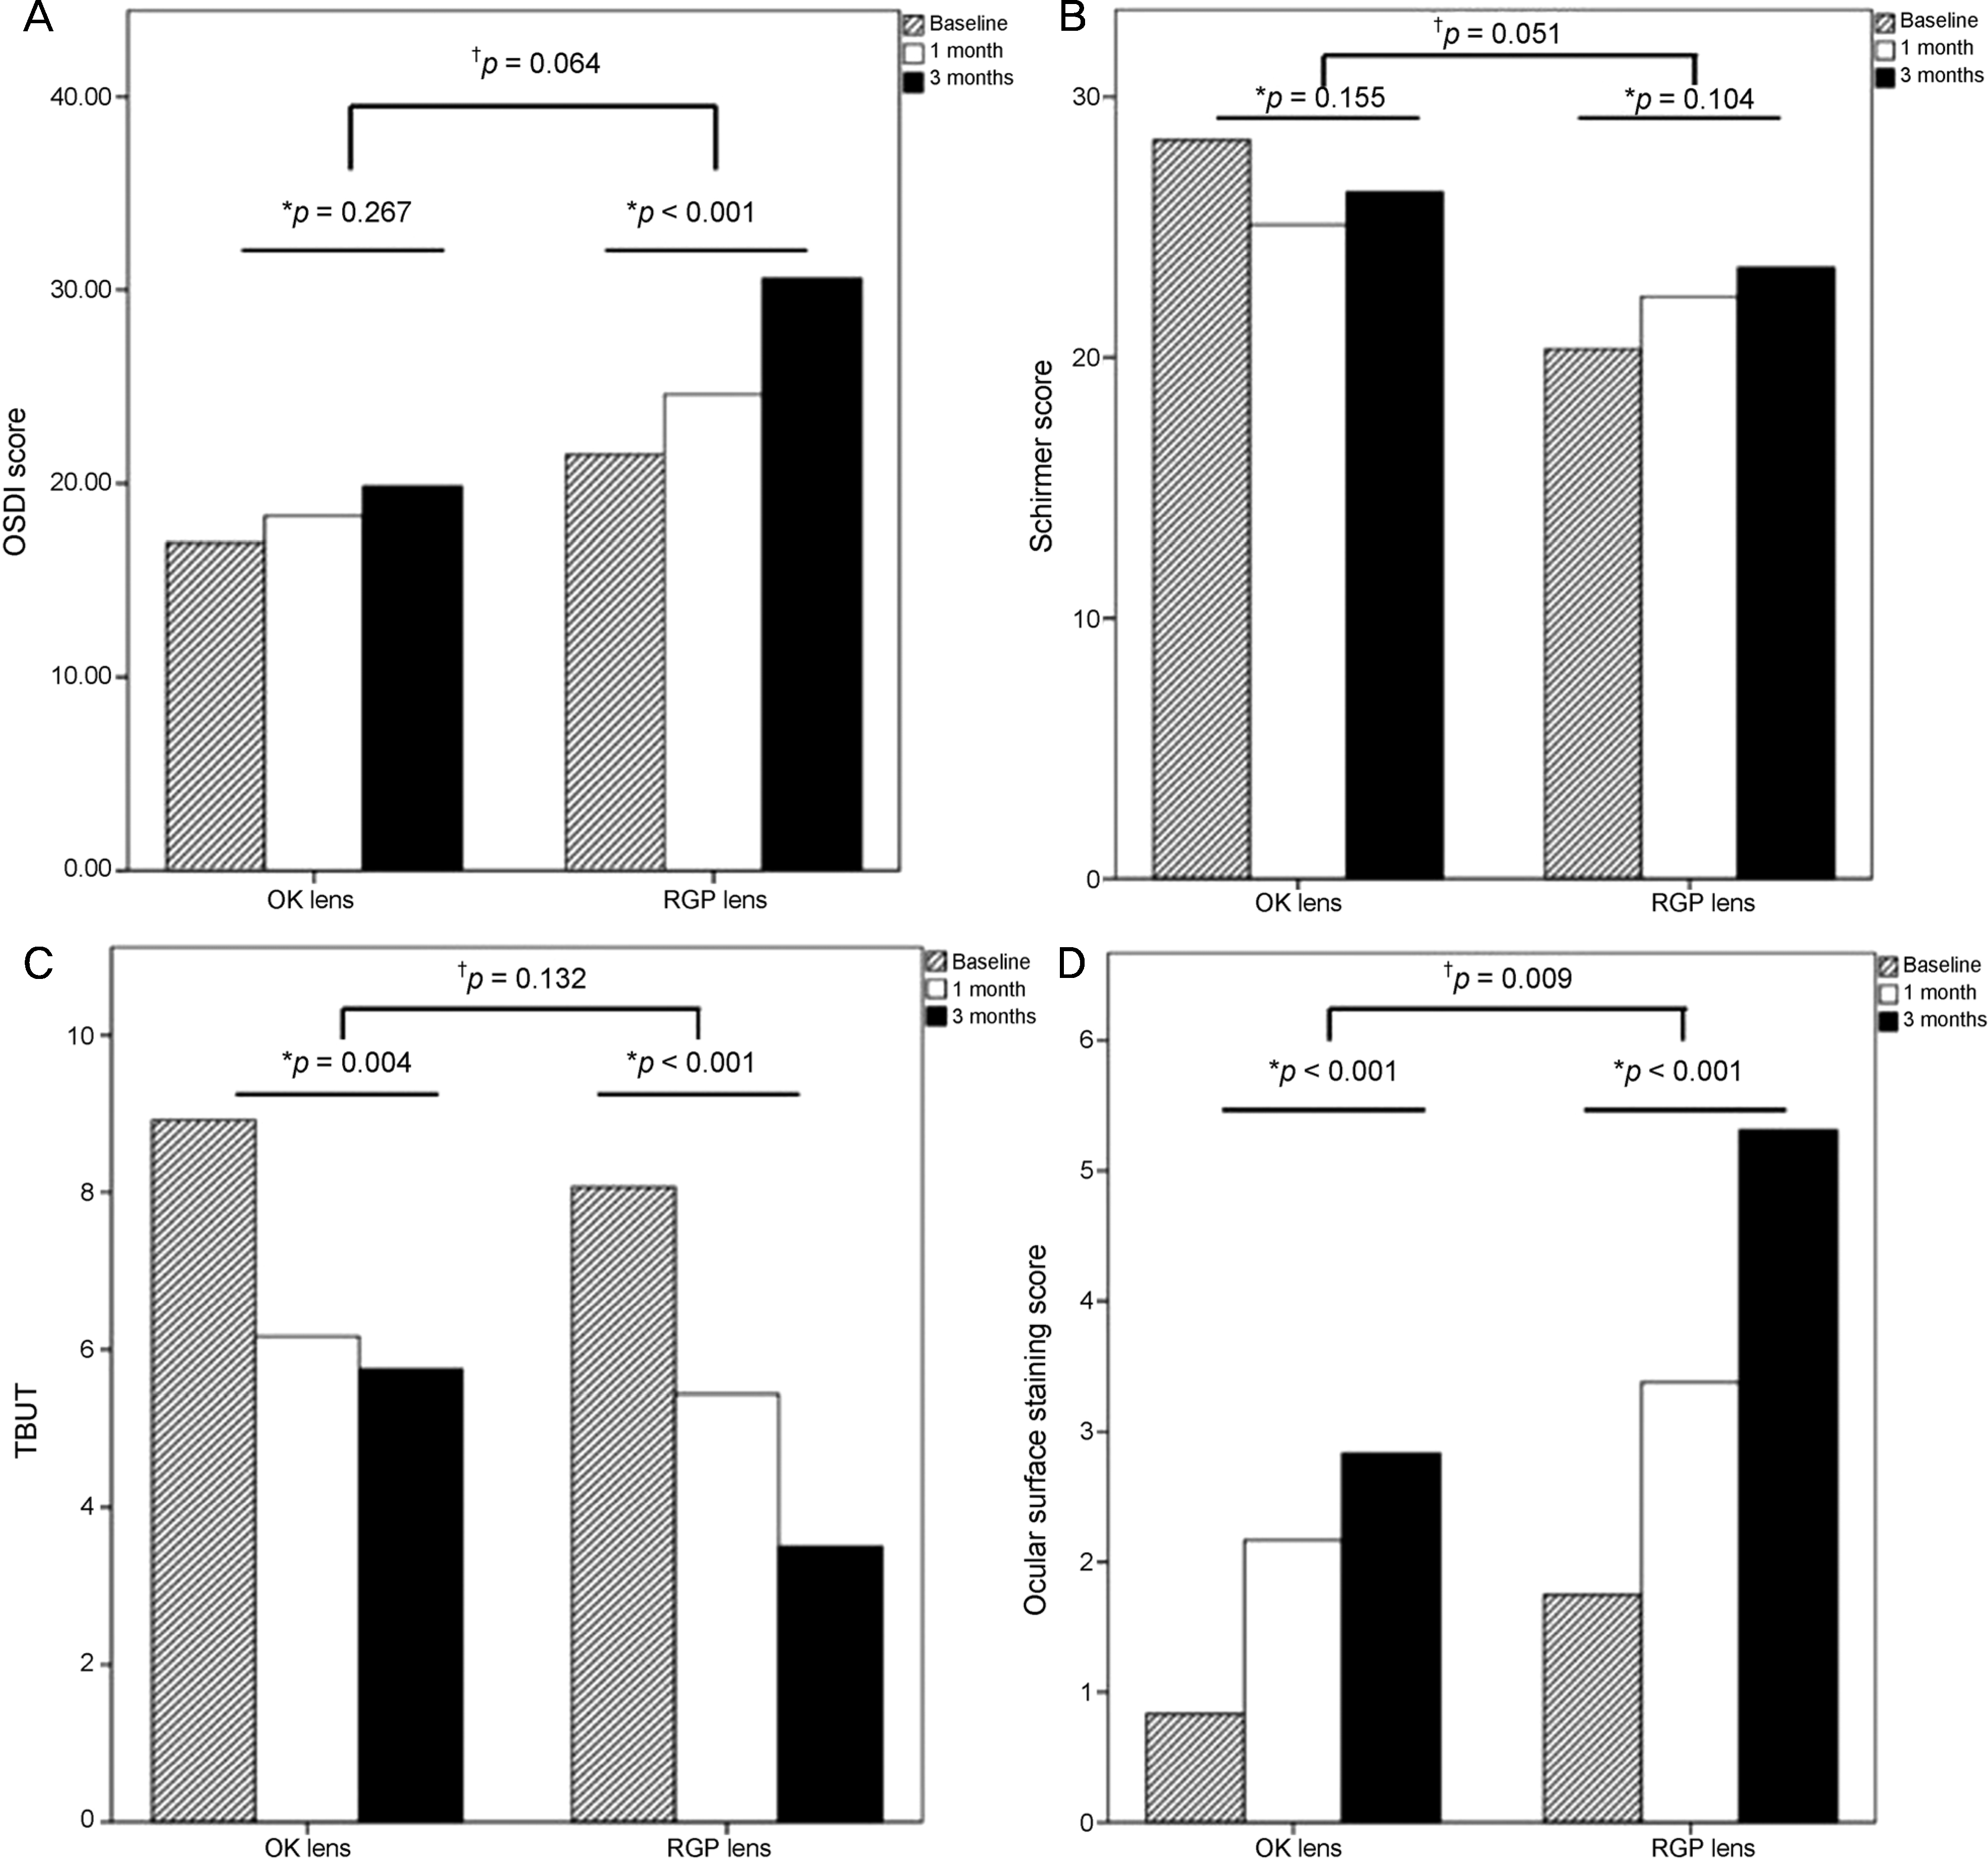
Figure 1.
Comparison of changes in ocular surface parameters after 3 months of lens use between the orthokeratologic (OK) lens group and rigid gas permeable (RGP) lens group: ocular surface disease index (OSDI) (A), Schirmer I score (B), tear break-up time (TBUT) (C), and ocular surface staining score (D). *For changes from baseline to 1 and 3 months of use between the two groups, using repeated-measures analysis of variance (ANOVA) incorporating, where necessary, a Greenhouse-Geisser correction for non-sphericity; †Using a Mann Whitney test to compare the changes between the two groups.

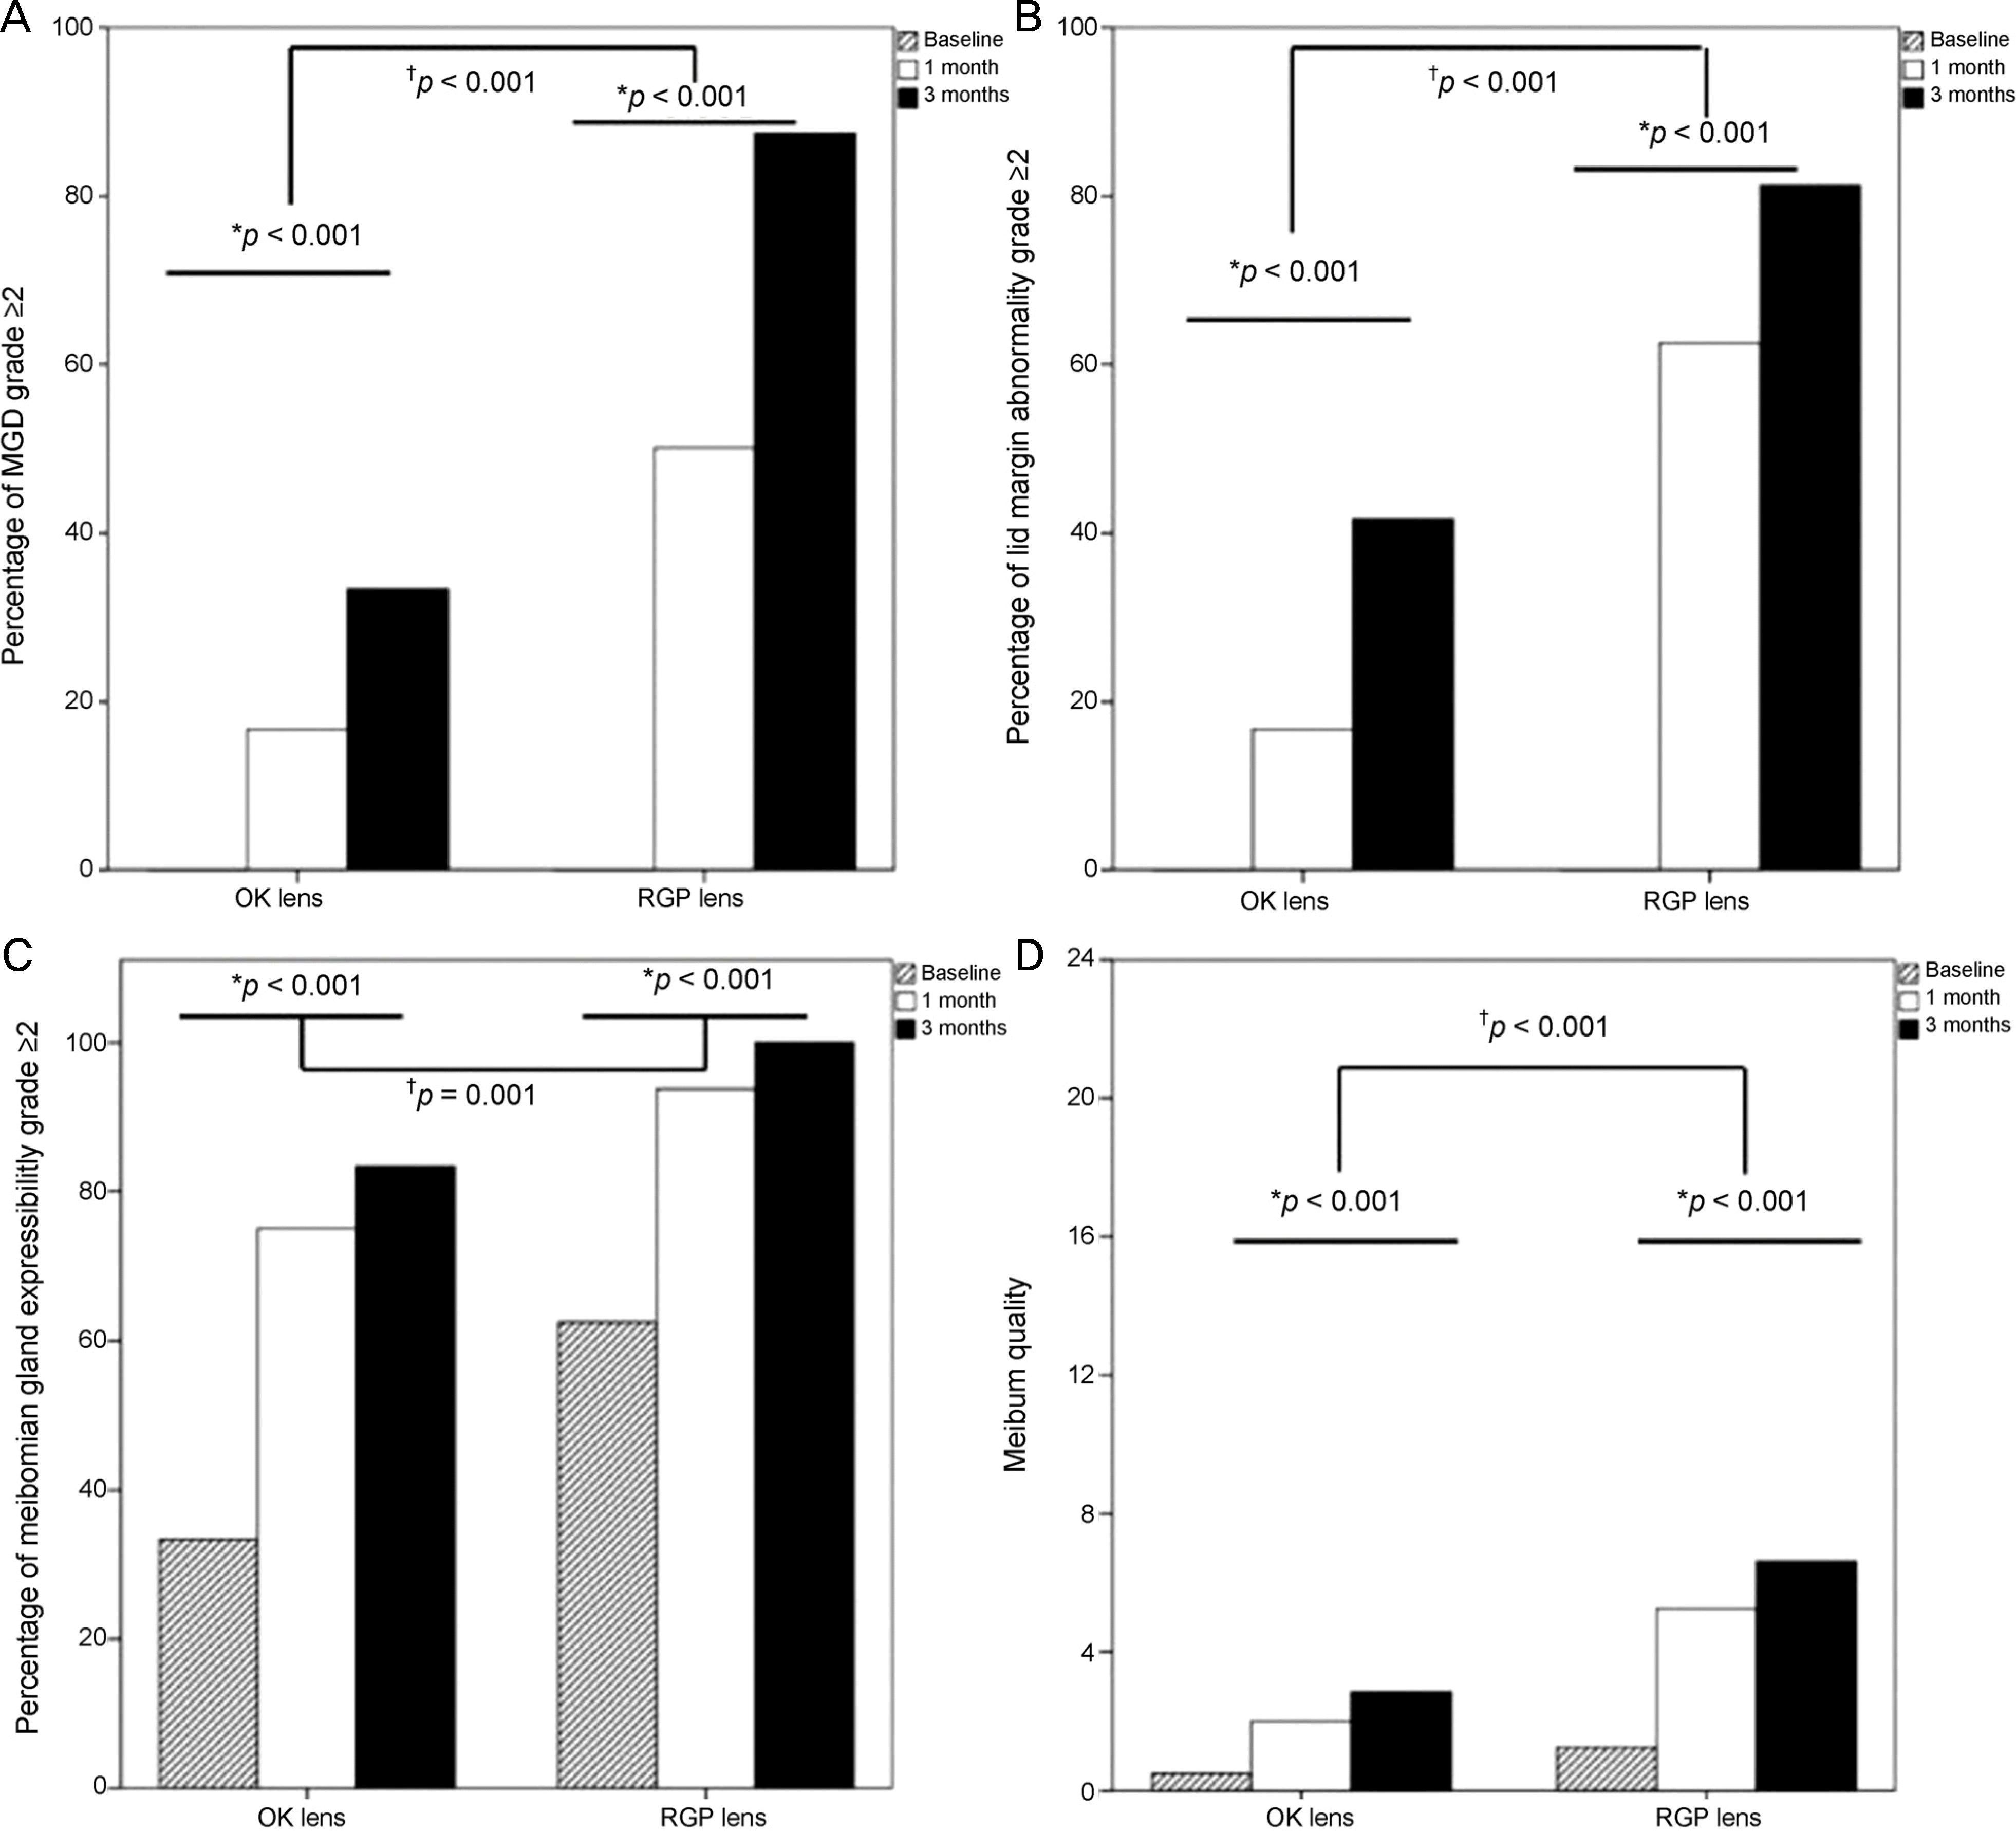
Figure 2.
Comparison of changes in meibomian gland parameters after 3 months of lens wearing in the orthokeratologic (OK) lens group and rigid gas permeable (RGP) lens group: meibomian gland dysfunction (MGD) grade (A), lid margin abnormality (B), meibomian gland expressiblility (C), and meibum quality (D). *For changes between baseline and 1 and 3 months of use between the two groups, using repeated-measures analysis of variance (ANOVA) incorporating, where necessary, a Greenhouse–Geisser correction for non-sphericity; †Generalized estimating equations model for noncontinuous scale values: MGD stage, n (%, proportion ≥ stage 2); Lid margin abnormality, n (%, proportion of ≥2); Meibomian gland expressibility, n (%, proportion of ≥1).

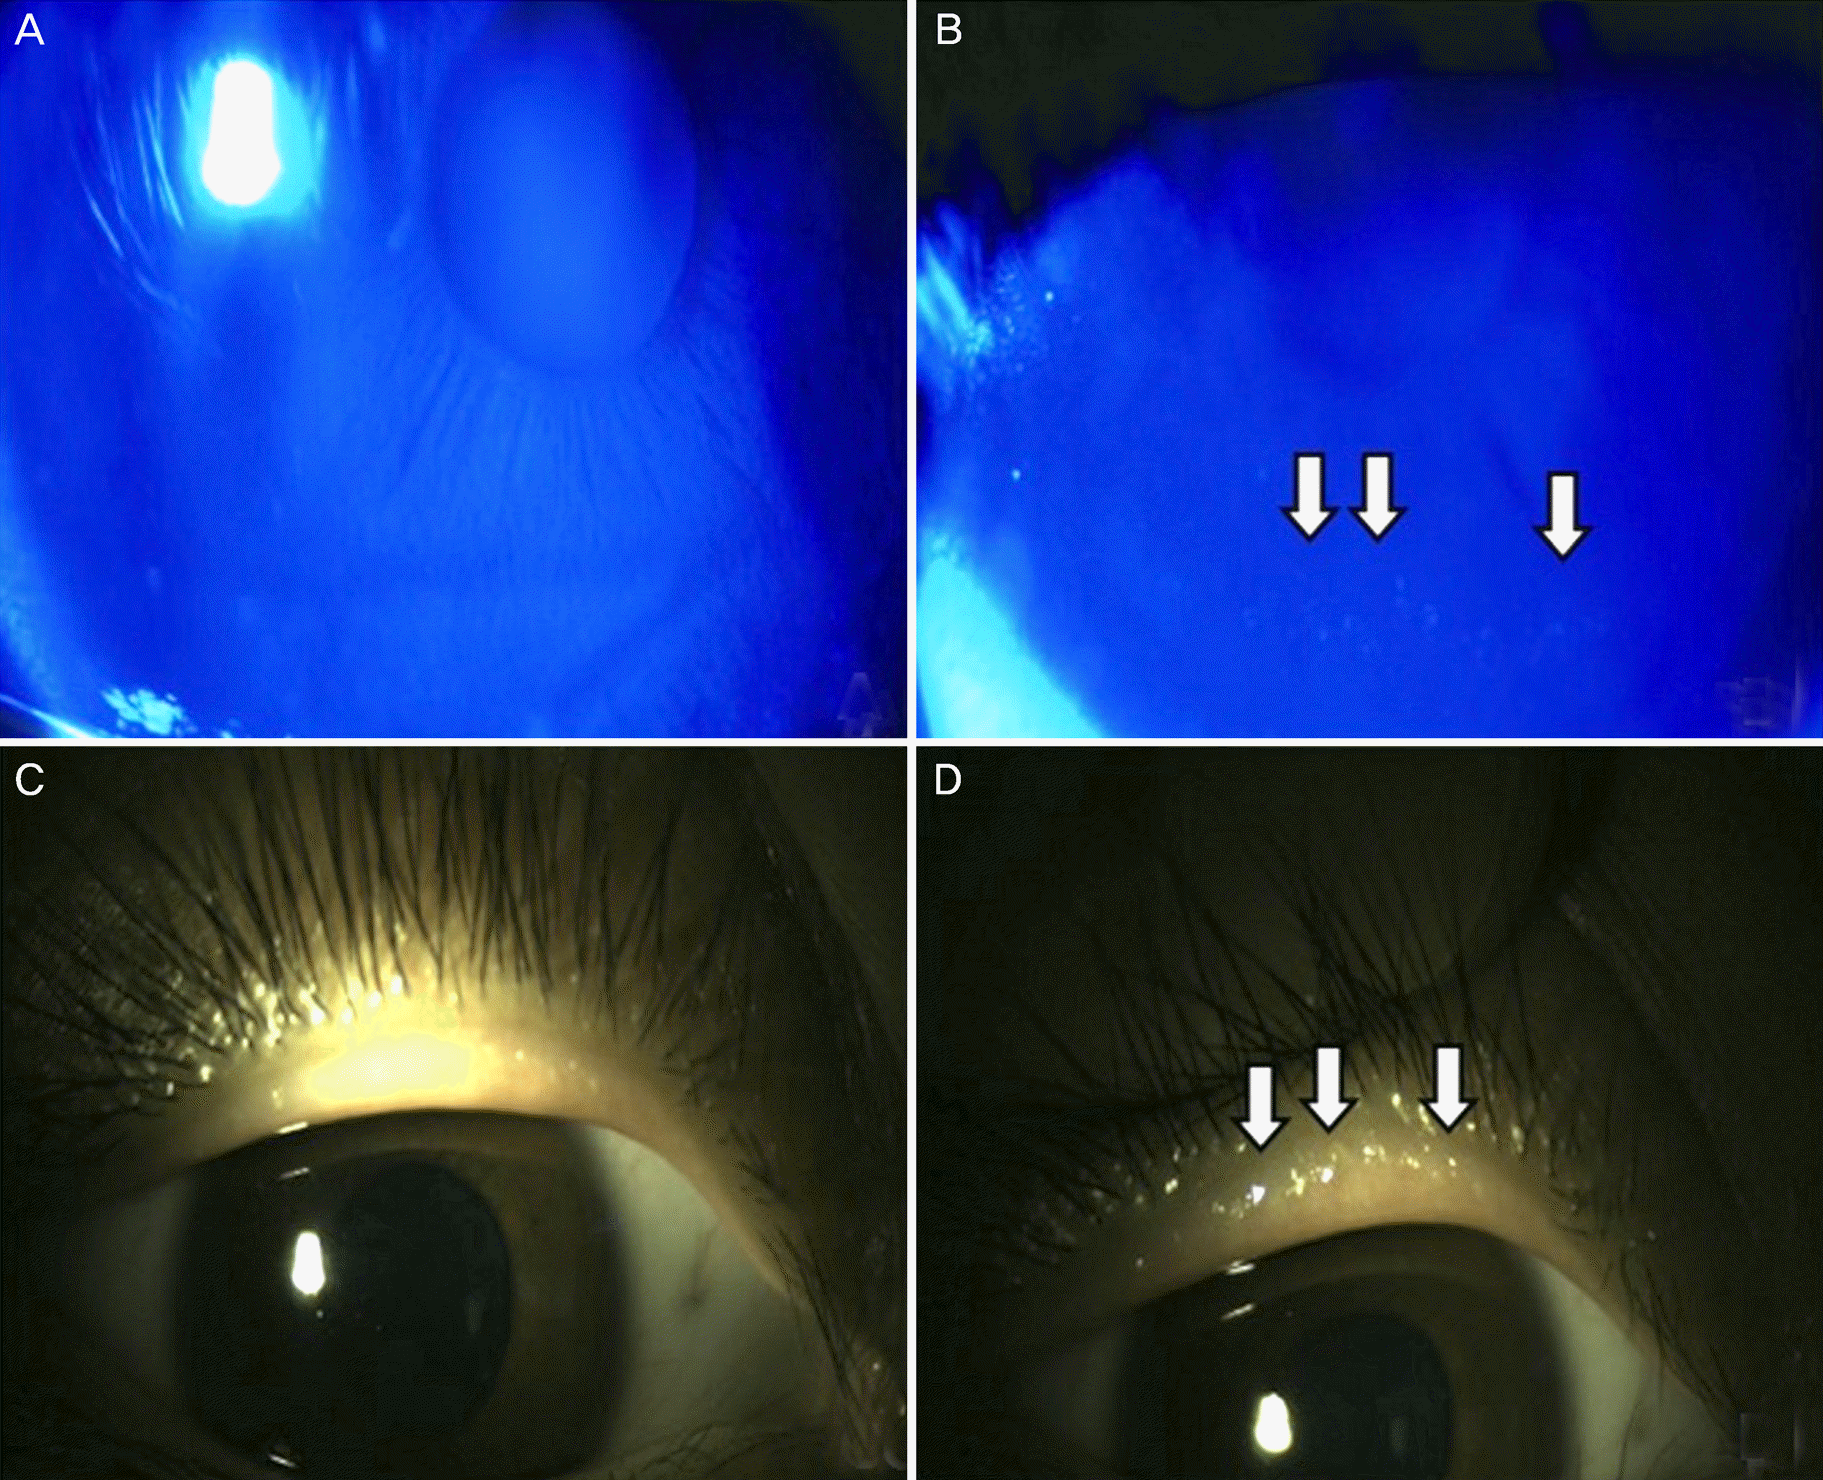
Figure 3.
Changes in ocular surface status in a 17-year-old female who wore an rigid gas permeable (RGP) lens. Increased ocular surface staining was noted before (A) and after 3 months (B; arrows) of RGP lens use. Comparing to baseline (C), meibomian gland plugging and vascular engorgements were developed after 3 months of RGP lens use (D; arrows).

Table 1.
Characteristics of the rigid contact lenses used in this study
| Parameters | OK lens | RGP lens |
|---|---|---|
| Material | Boston XO® (Hexafocon A) | Boston XO® (Hexafocon A) |
| Brand | Contex OK® | Boston SuperVision® II |
| Overall diameter (mm) | 9.5∼11.5 | 8.9∼9.5 |
| Optic zone diameter (mm) | 5.5∼6.5 | 7.5∼8.1 |
| EOP (%) | 18 | 18 |
| Dk* | 100 | 140 |
| Powers (diopter) | −0.50-7.50 | −20.00∼+20.00 |
Table 2.
Demographic characteristics of the subjects in this study
| OK lens group | RGP lens group | p-value* | |
|---|---|---|---|
| Number of eyes | 12 | 16 | |
| Gender (male/female) | 2/10 | 2/14 | |
| Age (years) | 19.3 ± 7.1 | 21.5 ± 5.5 | |
| Median (range) | 19 (11-30) | 21 (12-30) | 0.371 |
| Corneal astigmatism (D) | 0.93 ± 0.46 | 2.05 ± 0.59 | |
| Median (range) | 0.81 (0.5-1.75) | 2.00 (1.00-3.37) | <0.001 |
| Mean keratometric value (D) | 42.39 ± 2.32 | 43.27 ± 1.13 | |
| Median (range) | 42.93 (37.50-44.63) | 43.18 (41.12-44.95) | 0.443 |
| Refractive SE (D) | −2.82 ± 0.63 | −5.16 ± 2.38 | |
| Median (range) | −2.94 (-1.88∼-3.94) | −5.16 (-1.13∼-10.10) | 0.006 |
Table 3.
Comparison of baseline ocular surface status between OK lens and RGP lens groups
| OK lens group | RGP lens group | p-value* | |
|---|---|---|---|
| Ocular surface parameters | |||
| Subjective score (OSDI) | 16.93 ± 12.17 | 21.49 ± 14.31 | |
| Median (range) | 15.84 (0.00-39.58) | 18.75 (0.00-47.50) | 0.260 |
| Schirmer's test value (mm) | 28.33 ± 5.37 | 20.31 ± 10.40 | |
| Median (range) | 30 (20-35) | 20 (5-35) | 0.052 |
| TBUT (seconds) | 8.92 ± 1.78 | 8.06 ± 2.38 | |
| Median (range) | 10 (5-10) | 10 (5-10) | 0.450 |
| Ocular surface staining score (DEWS score, 0-33) | 0.83 ± 1.59 | 1.75 ± 2.18 | |
| Median (range) | 0 (0-4) | 0 (0-6) | 0.347 |
| Evaluation of meibomian gland | |||
| MGD grade (n, %)† | 0 (0) | 0 (0) | > 0.999 |
| Lid margin abnormality (n, %)† | 0 (0) | 0 (0) | > 0.999 |
| Meibomian gland expressibility (n, %)† | 4 (33.3) | 8 (50.0) | 0.051 |
| Meibum quality (0-24) | 0.50 ± 0.79 | 1.25 ± 1.00 | |
| Median (range) | 0 (0-2) | 2 (0-2) | 0.082 |
Table 4.
Changes in ocular surface status and meibomian gland parameters in the OK lens group
| Parameters | Before (baseline) | 1 month | 3 months | p-value* |
p-value† |
|
|---|---|---|---|---|---|---|
| Before vs. 1 month | Before vs. 3 months | |||||
| Ocular surface parameters | ||||||
| Subjective score (OSDI) | 16.93 ± 12.17 | 18.31 ± 11.69 | 19.86 ± 14.71 | |||
| Median (range) | 15.84 (0.00-39.58) | 15.63 (9.09-14.70) | 16.88 (2.08-47.90) | 0.267 | 0.180 | 0.208 |
| Schirmer's test value (mm) | 28.33 ± 5.37 | 25.08 ± 7.05 | 26.33 ± 3.26 | |||
| Median (range) | 30 (20-35) | 29 (9-30) | 28 (21-30) | 0.155 | 0.072 | 0.166 |
| TBUT (seconds) | 8.92 ± 1.78 | 6.17 ± 3.71 | 5.75 ± 2.80 | |||
| Median (range) | 10 (5-10) | 7 (0-10) | 6 (2-9) | 0.004 | 0.021 | 0.006 |
| Ocular surface staining score (0-33), Oxford | 0.83 ± 1.75 | 2.17 ± 2.08 | 2.83 ± 2.17 | |||
| Median (range) | 0 (0-4) | 2 (0-6) | 2 (0-7) | <0.001 | 0.021 | 0.009 |
| Evaluation of meibomian gland | ||||||
| MGD grade (n, %)‡ | 0 (0) | 2 (16.7) | 4 (33.3) | <0.001 | 0.001 | <0.001 |
| Lid margin abnormality (n, %)‡ | 0 (0) | 2 (16.7) | 5 (41.7) | <0.001 | <0.001 | <0.001 |
| Meibomian gland expressibility (n, %)‡ | 4 (33.3) | 9 (75.0) | 10 (83.3) | <0.001 | 0.001 | <0.001 |
| Meibum quality (0-24)* | 0.50 ± 0.79 | 2.00 ± 1.04 | 2.83 ± 1.26 | |||
| Median (range) | 0 (0-2) | 2 (1-4) | 2 (2-5) | 0.002 | 0.006 | 0.018 |
Table 5.
Changes in ocular surface status and meibomian gland parameters in the RGP lens group
| Parameters | Before (baseline) | 1 month | 3 months | p-value* |
p-value† |
|
|---|---|---|---|---|---|---|
| Before vs. 1 month | Before vs. 3 months | |||||
| Ocular surface parameters | ||||||
| Subjective score (OSDI) | 21.49 ± 14.31 | 24.57 ± 12.45 | 30.57 ± 16.03 | |||
| Median (range) | 18.75 (0.00-47.50) | 15.63 (9.09-39.58) | 33.54 (2.08-47.90) | <0.001 | 0.100 | 0.009 |
| Schirmer's test value (mm) | 20.31 ± 10.40 | 22.31 ± 7.53 | 23.44 ± 6.51 | |||
| Median (range) | 20 (5-35) | 25 (10-30) | 27 (11-29) | 0.104 | 0.274 | 0.078 |
| TBUT (seconds) | 8.06 ± 2.38 | 5.44 ± 2.22 | 3.50 ± 1.93 | |||
| Median (range) | 10 (5-10) | 6 (3-9) | 4 (0-6) | <0.001 | <0.001 | <0.001 |
| Ocular surface staining score (0-33), Oxford | 1.75 ± 2.18 | 3.88 ± 2.25 | 5.31 ± 3.48 | |||
| Median (range) | 0 (0-6) | 3 (1-6) | 4 (2-11) | <0.001 | 0.003 | <0.001 |
| Evaluation of meibomian gland | ||||||
| MGD grade‡ | 0 (0) | 8 (50.0) | 14 (87.5) | <0.001 | <0.001 | <0.001 |
| Lid margin abnormality‡ | 0 (0) | 10 (62.5) | 13 (81.3) | <0.001 | <0.001 | <0.001 |
| Meibomian gland expressibility (n, %)‡ | 10 (62.5) | 15 (93.8) | 16 (100) | <0.001 | <0.001 | <0.001 |
| Meibum quality (0-24)* | 1.25 ± 1.00 | 5.25 ± 3.22 | 6.63 ± 2.53 | |||
| Median (range) | 2 (0-2) | 3 (1-9) | 6 (2-9) | <0.001 | <0.001 | <0.001 |


 PDF
PDF ePub
ePub Citation
 Print
Print


 XML Download