Abstract
Purpose
To examine the relationship between the refractive astigmatism by automated refractometry and the corneal astigmatism by a dual Scheimpflug analyzer in pseudophakic eyes.
Methods
Prospectively, 75 patients (100 eyes) were enrolled in the present study. Refractive astigmatism was obtained by automated refraction. Corneal astigmatism was obtained using automated keratometry (ARK-530A®) and dual Scheimpflug scanning analysis (Galilei G4®). All refractive values were converted to the power vector components J0 and J45 for comparison and regression analysis of refractive versus corneal astigmatism. Bland-Altman plots were created to estimate the agreement between measurements.
Results
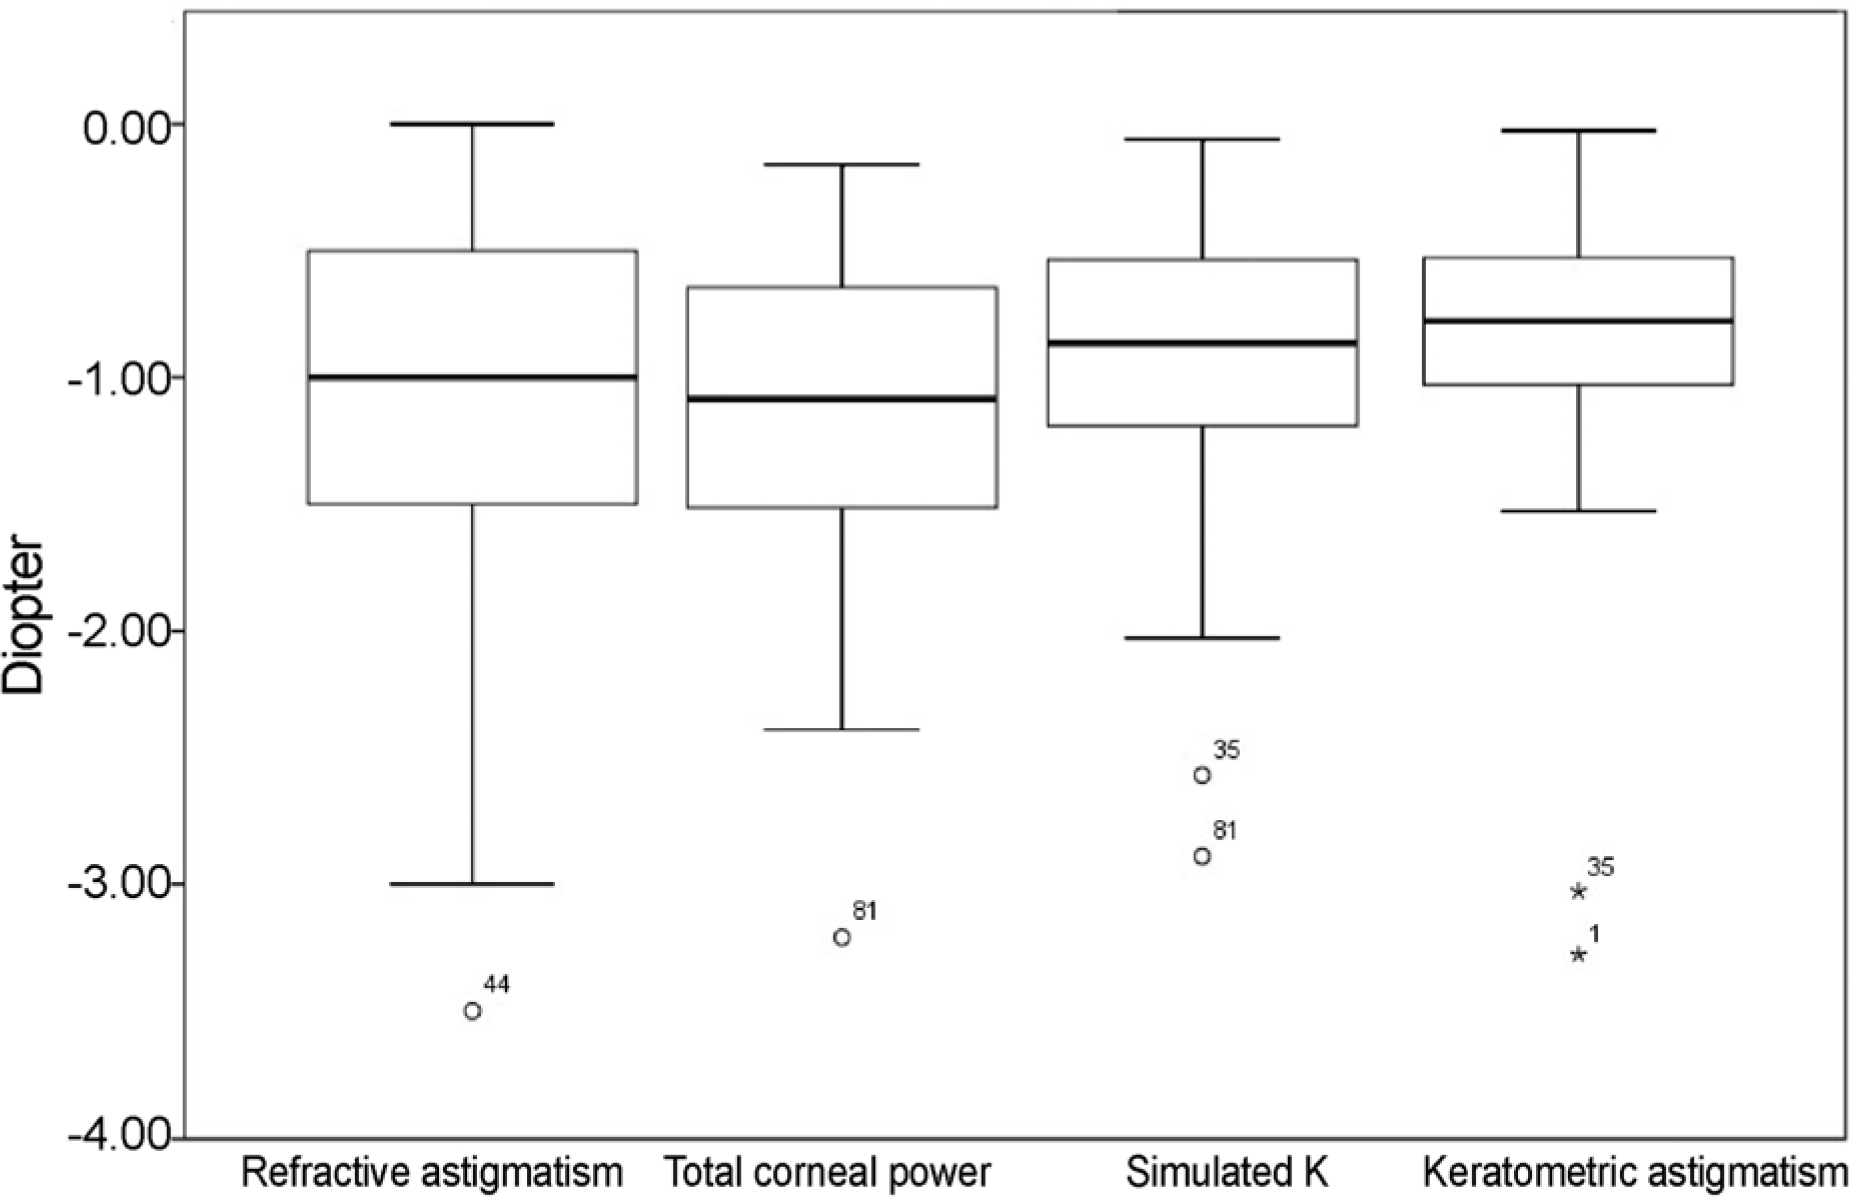
The average astigmatism from each measurement was −1.11 ± 1.44 D (refractive astigmatism from automated refraction), −0.77 ± 1.06 D (corneal astigmatism from automated keratometry), −0.93 ± 1.02 D (simulated K from Galilei G4®), and −1.11 ± 1.48 D (total corneal power from Galilei G4®). Refractive J0 and keratometric J0 were significantly correlated (r = 0.557, p ≤ 0.001), as well as the corresponding J45 values (r = 0.655, p = 0.025). Refractive astigmatism and total corneal power components were also significantly correlated (J0: r = 0.618, p ≤ 0.001; J45: r = 0.608, p = 0.04). In the Bland-Altman plots, keratometric J0 and total corneal power J0 showed the best agreement.
Conclusions
The accuracy of measurements for corneal refraction and astigmatism in pseudophakic eyes is higher using the dual Scheimpflug analyzer, especially for total corneal power. This value of astigmatism can take into account the refractive astigmatism of pseudophakic eyes and can be used in evaluating postoperative corneal astigmatism.
Go to : 
References
1. Ho JD, Liou SW, Tsai RJ, Tsai CY. Effects of aging on anterior and posterior corneal astigmatism. Cornea. 2010; 29:632–7.

2. Teus MA, Arruabarrena C, Hernández-Verdejo JL, et al. Correlation between keratometric and refractive astigmatism in pseudophakic eyes. J Cataract Refract Surg. 2010; 36:1671–5.

3. Shirayama M, Wang L, Koch DD, Weikert MP. Comparison of accuracy of intraocular lens calculations using automated keratometry, a Placido-based corneal topographer, and a combined Placido-based and dual Scheimpflug corneal topographer. Cornea. 2010; 29:1136–8.
4. Butcher JM, O'Brien C. The reproducibility of biometry and keratometry measurements. Eye (Lond). 1991; 5(Pt 6):708–11.

5. Han JM, Choi HJ, Kim MK, et al. Comparative analysis of corneal refraction and astigmatism measured with Autokeratometer, IOL master, and topography. J Korean Ophthalmol Soc. 2011; 52:1427–33.

6. Shirayama M, Wang L, Weikert MP, Koch DD. Comparison of corneal powers obtained from 4 different devices. Am J Ophthalmol. 2009; 148:528–35.e1.

7. Menassa N, Kaufmann C, Goggin M, et al. Comparison and reproducibility of corneal thickness and curvature readings obtained by the Galilei and the Orbscan II analysis systems. J Cataract Refract Surg. 2008; 34:1742–7.

8. Thibos LN, Horner D. Power vector analysis of the optical outcome of refractive surgery. J Cataract Refract Surg. 2001; 27:80–5.

9. Thibos LN, Wheeler W, Horner D. Power vectors: an application of Fourier analysis to the description and statistical analysis of refractive error. Optom Vis Sci. 1997; 74:367–75.

10. Findl O, Drexler W, Menapace R, et al. High precision biometry of pseudophakic eyes using partial coherence interferometry. J Cataract Refract Surg. 1998; 24:1087–93.

11. Koch DD, Ali SF, Weikert MP, et al. Contribution of posterior corneal astigmatism to total corneal astigmatism. J Cataract Refract Surg. 2012; 38:2080–7.

12. Axt JC, McCaffery JM. Reduction of postoperative against-the-rule astigmatism by lateral incision technique. J Cataract Refract Surg. 1993; 19:380–6.

13. Kohnen S, Neuber R, Kohnen T. Effect of temporal and nasal unsutured limbal tunnel incisions on induced astigmatism after phacoemulsification. J Cataract Refract Surg. 2002; 28:821–5.

Go to : 
 | Figure 1.Difference between corneal astigmatism measured by autokerotometer (ARK-530A, NIDEK, Gamagori, Japan) and dual Scheimpflug analyzer in pseudophakic eyes. Note that astigmatism is measured more in total corneal power of Scheimpflug analyzer than keratometric astigmatism of autokerotometer and simulated K of Scheimpflug analyzer (respectively p < 0.001, p < 0.001, paired t-test). |
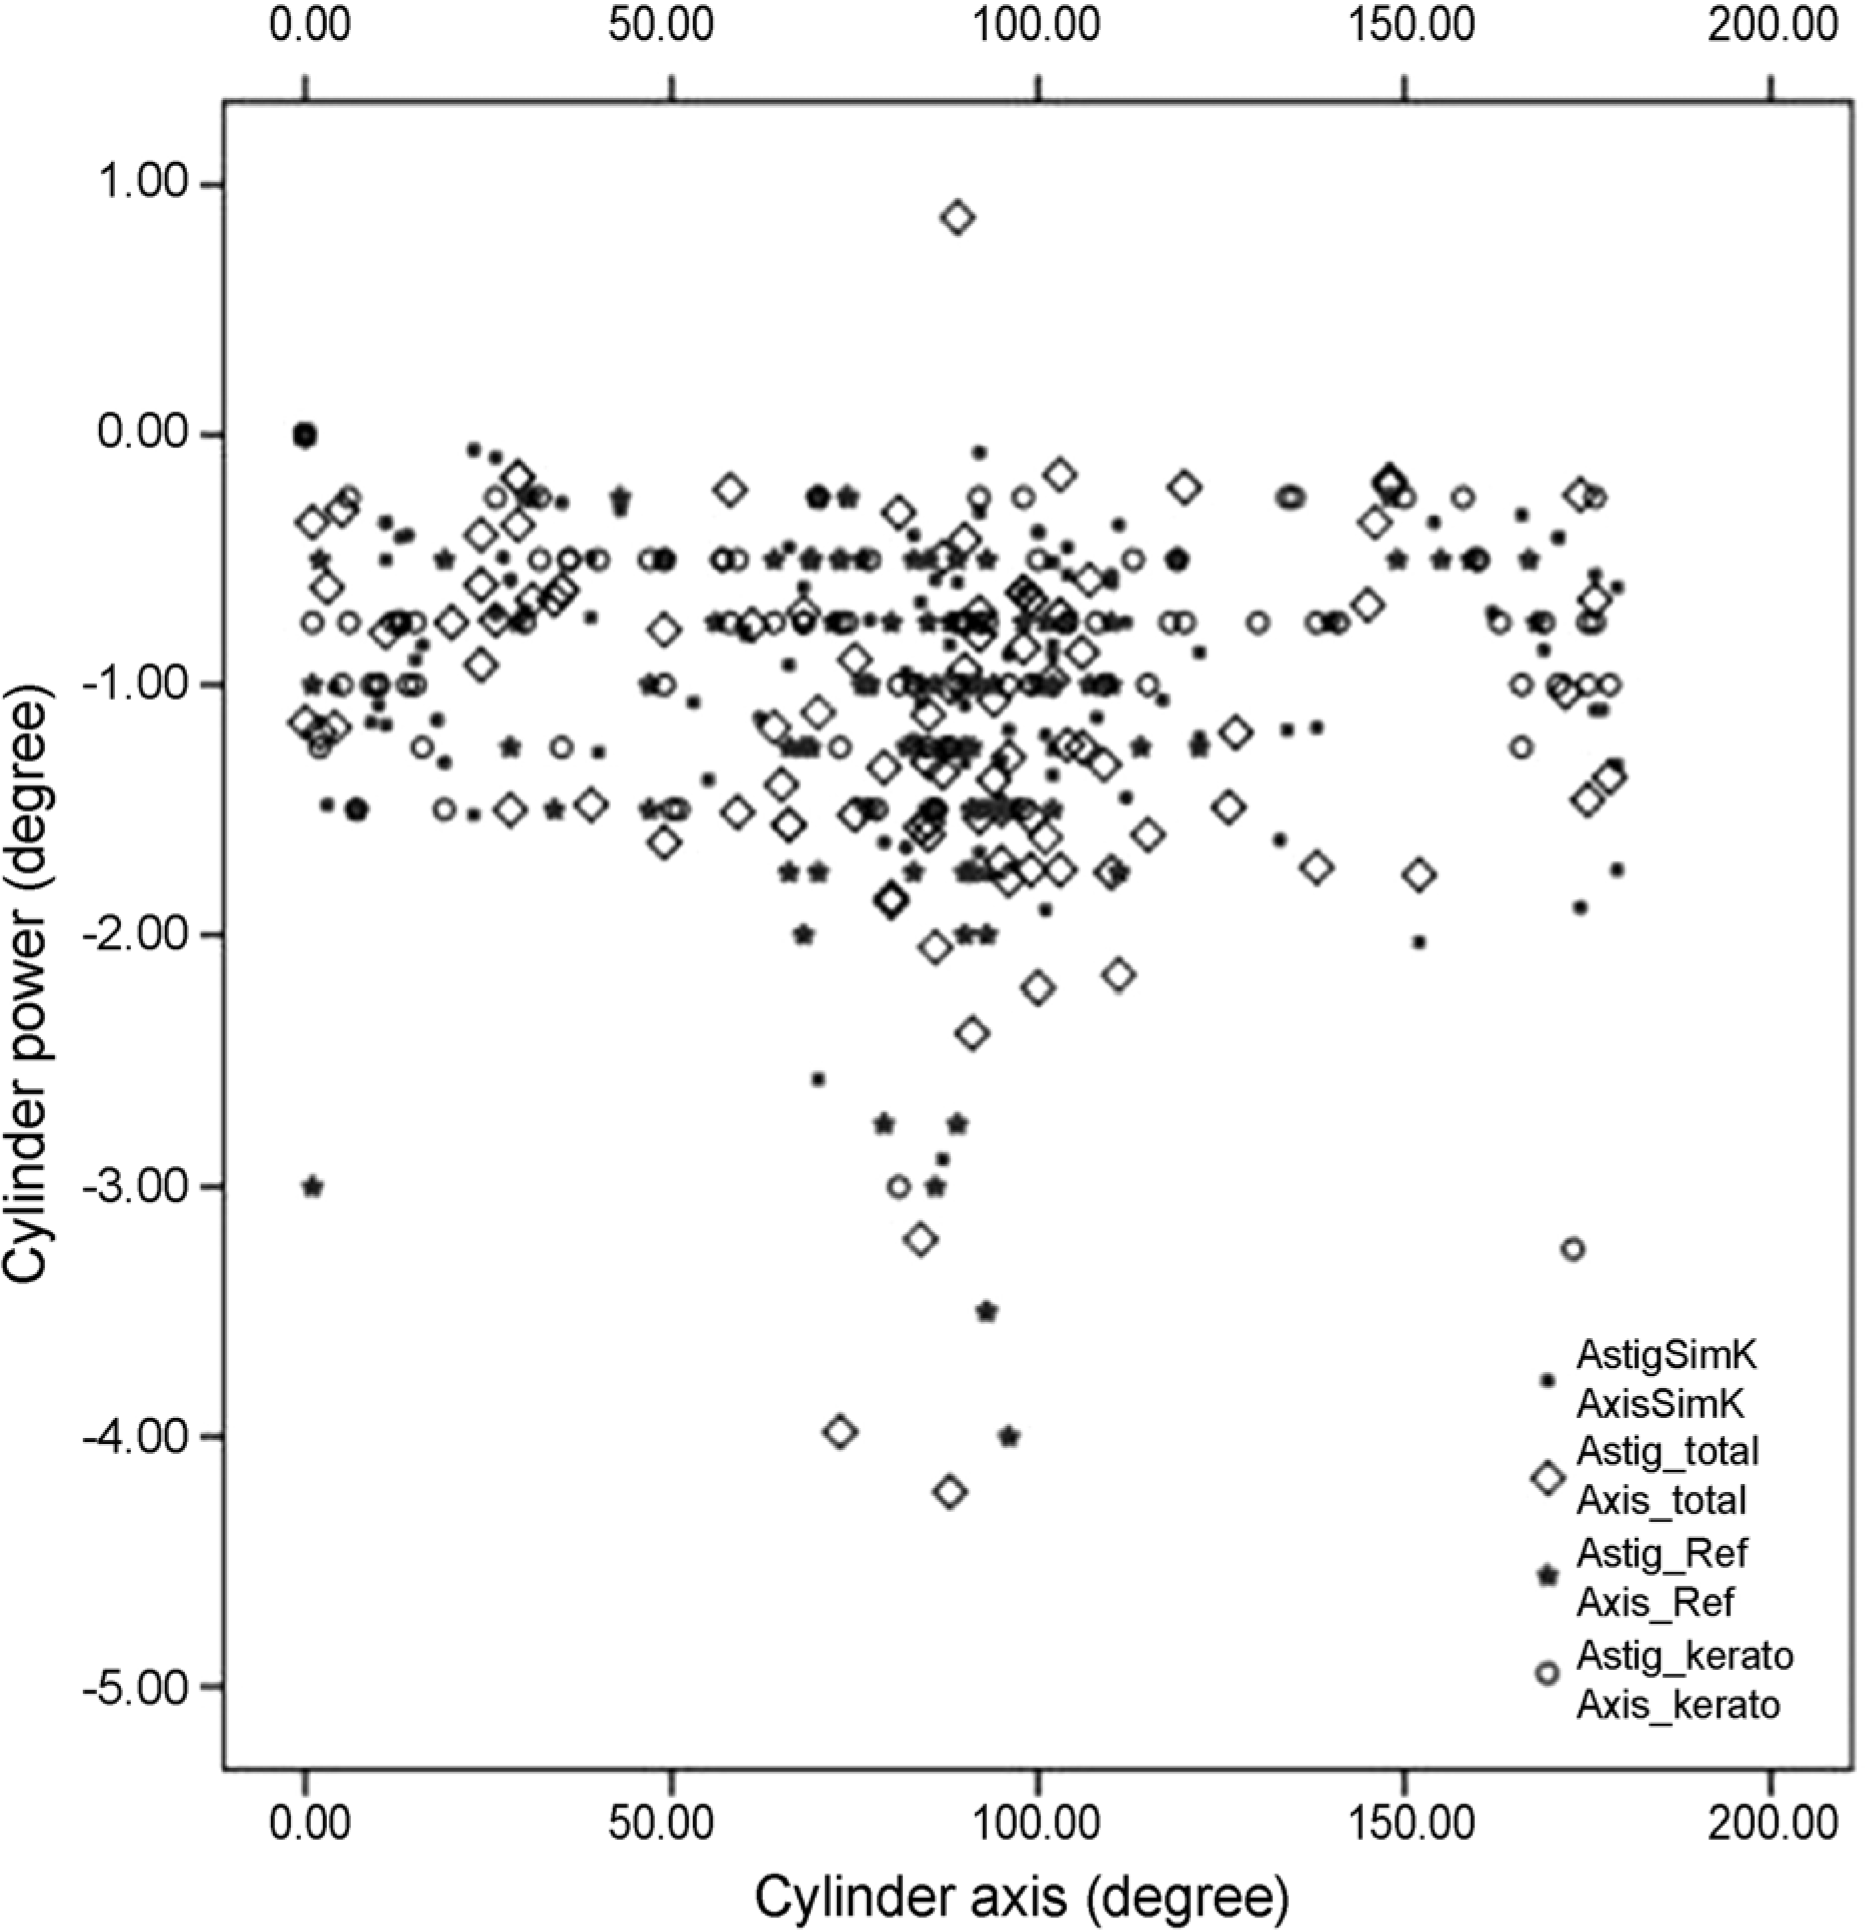
 | Figure 2.Axis distribution (degrees) of refractive astigmatism, keratometric astigmatism, simulated K and total corneal pow er of Scheimpflug analyzer. Most of them are distributed in 90 degree axis and −1.0 diopter astigmatism. Astig = astigmatism; Sim K = simulated K; total = total corneal power; Ref = refractive astigmatism; kerato = keratometric astigmatism. |
 | Figure 3.Regression lines between refractive astigmatism J0 and keratometric astigmatism J0 (A) and J45 (B), refractive astigmatism J0 and Simulated K J0 (C) and J45(D) and refractive astigmatism J0 and total corneal power J0 (E) and J45 (F) by Jackson vector analysis. Refractive and keratometric astigmatism J0 were significantly correlated (r = 0.557, p < 0.001; A), and also the corresponding J45 values (r = 0.655, p = 0.025; B). Refractive and Simulated K astigmatic components were significantly correlated (J0: r = 0.623, p < 0.001; J45: r = 0.585, p = 0.025) (C, D). Refractive and total corneal power astigmatic components were significantly correlated (J0: r = 0.618, p < 0.001; J45: r = 0.608, p = 0.04) (E, F). A R = refractive astigm atism; A K = keratom etric astigmatism; Sim K = simulated K; TCP = total corneal power. |
 | Figure 4.Bland–Altman plots (solid line: mean, dotted lines: mean ± 1.96 SD) of the difference between refractive astigmatism J0 and keratometric astigmatism J0 against their mean (A), between refractive astigmatism J0 and Simulated K J0 against their mean (C), between refractive astigmatism J0 and total corneal power J0 by ray-tracing against their mean (E) and J45 (B, D, F), respectively. Bland-Altman plots show good agreement between refractive and keratometric J0 (difference: −0.78∼ 0.06) and J45 astigmatic components (difference: −0.20∼ 0.20; A, B, respectively). Agreement between refractive and simulated K J0 (difference: −0.66∼0.12) and J45 (difference: −0.20∼ 0.28) astigmatic components was good (C, D, respectively). Agreement between refractive and total corn eal pow er J0 (difference:-0.49∼ −0.31) and J45 (difference: −0.23∼ 0.29) astigmatic components was good E, F, respectively). SD = standard deviation; D= diopters. |
Table 1.
Characteristics of patients included
Table 2.
Difference between dual Scheimpflug analyzer readings and automated K readings
| Parameter |
Difference (D) |
p-value | |
|---|---|---|---|
| Mean ± SD | 95% Confidence interval | ||
| TCP-AR | 0.02 ± 0.65 | −0.11∼0.14 | 0.806* |
| Sim K-AR | 0.20 ± 0.72 | 0.05∼0.33 | 0.01 |
| AK-AR | 0.34 ± 0.78 | 0.20∼0.50 | <0.001 |
Table 3.
The predictive aberration parameters for the total corneal power
| Group | Number | Mean (μm) | SD | p-value | |
|---|---|---|---|---|---|
| Coma | 0.097* | ||||
| 1 | 66 | −0.1121 | 0.31658 | ||
| 2 | 34 | −0.0965 | 0.22625 | ||
| Spherical | 0.086* | ||||
| 1 | 66 | 0.1891 | 0.15227 | ||
| 2 | 34 | 0.1679 | 0.11956 | ||
| Trefoil | 0.223* | ||||
| 1 | 66 | −0.0197 | 0.33013 | ||
| 2 | 34 | −0.0341 | 0.25433 | ||
| Total RMS | 0.124* | ||||
| 1 | 66 | 1.7386 | 0.47463 | ||
| 2 | 34 | 1.5303 | 0.31061 | ||
| 2nd RMS | 0.188* | ||||
| 1 | 66 | 1.4447 | 0.43874 | ||
| 2 | 34 | 1.3441 | 0.30329 | ||
| 3rd RMS | <0.001 | ||||
| 1 | 66 | 0.792 | 0.35752 | ||
| 2 | 34 | 0.605 | 0.1951 | ||
| 4th RMS | 0.095* | ||||
| 1 | 66 | 0.3867 | 0.20496 | ||
| 2 | 34 | 0.2924 | 0.13527 |


 PDF
PDF ePub
ePub Citation
 Print
Print


 XML Download