Abstract
Purpose
To investigate the changes in choroidal thickness in diabetic retinopathy patients after panretinal photocoagulation (PRP).
Methods
This retrospective study included 42 eyes of treatment-naïve, severe non-proliferative diabetic retinopathy or proliferative diabetic retinopathy patients undergoing 3-session PRP. At baseline and 1 and 2 months after completion of the PRP treatments, subfoveal choroidal thickness (SFCT) was measured using enhanced depth imaging optical coherence tomography.
Results
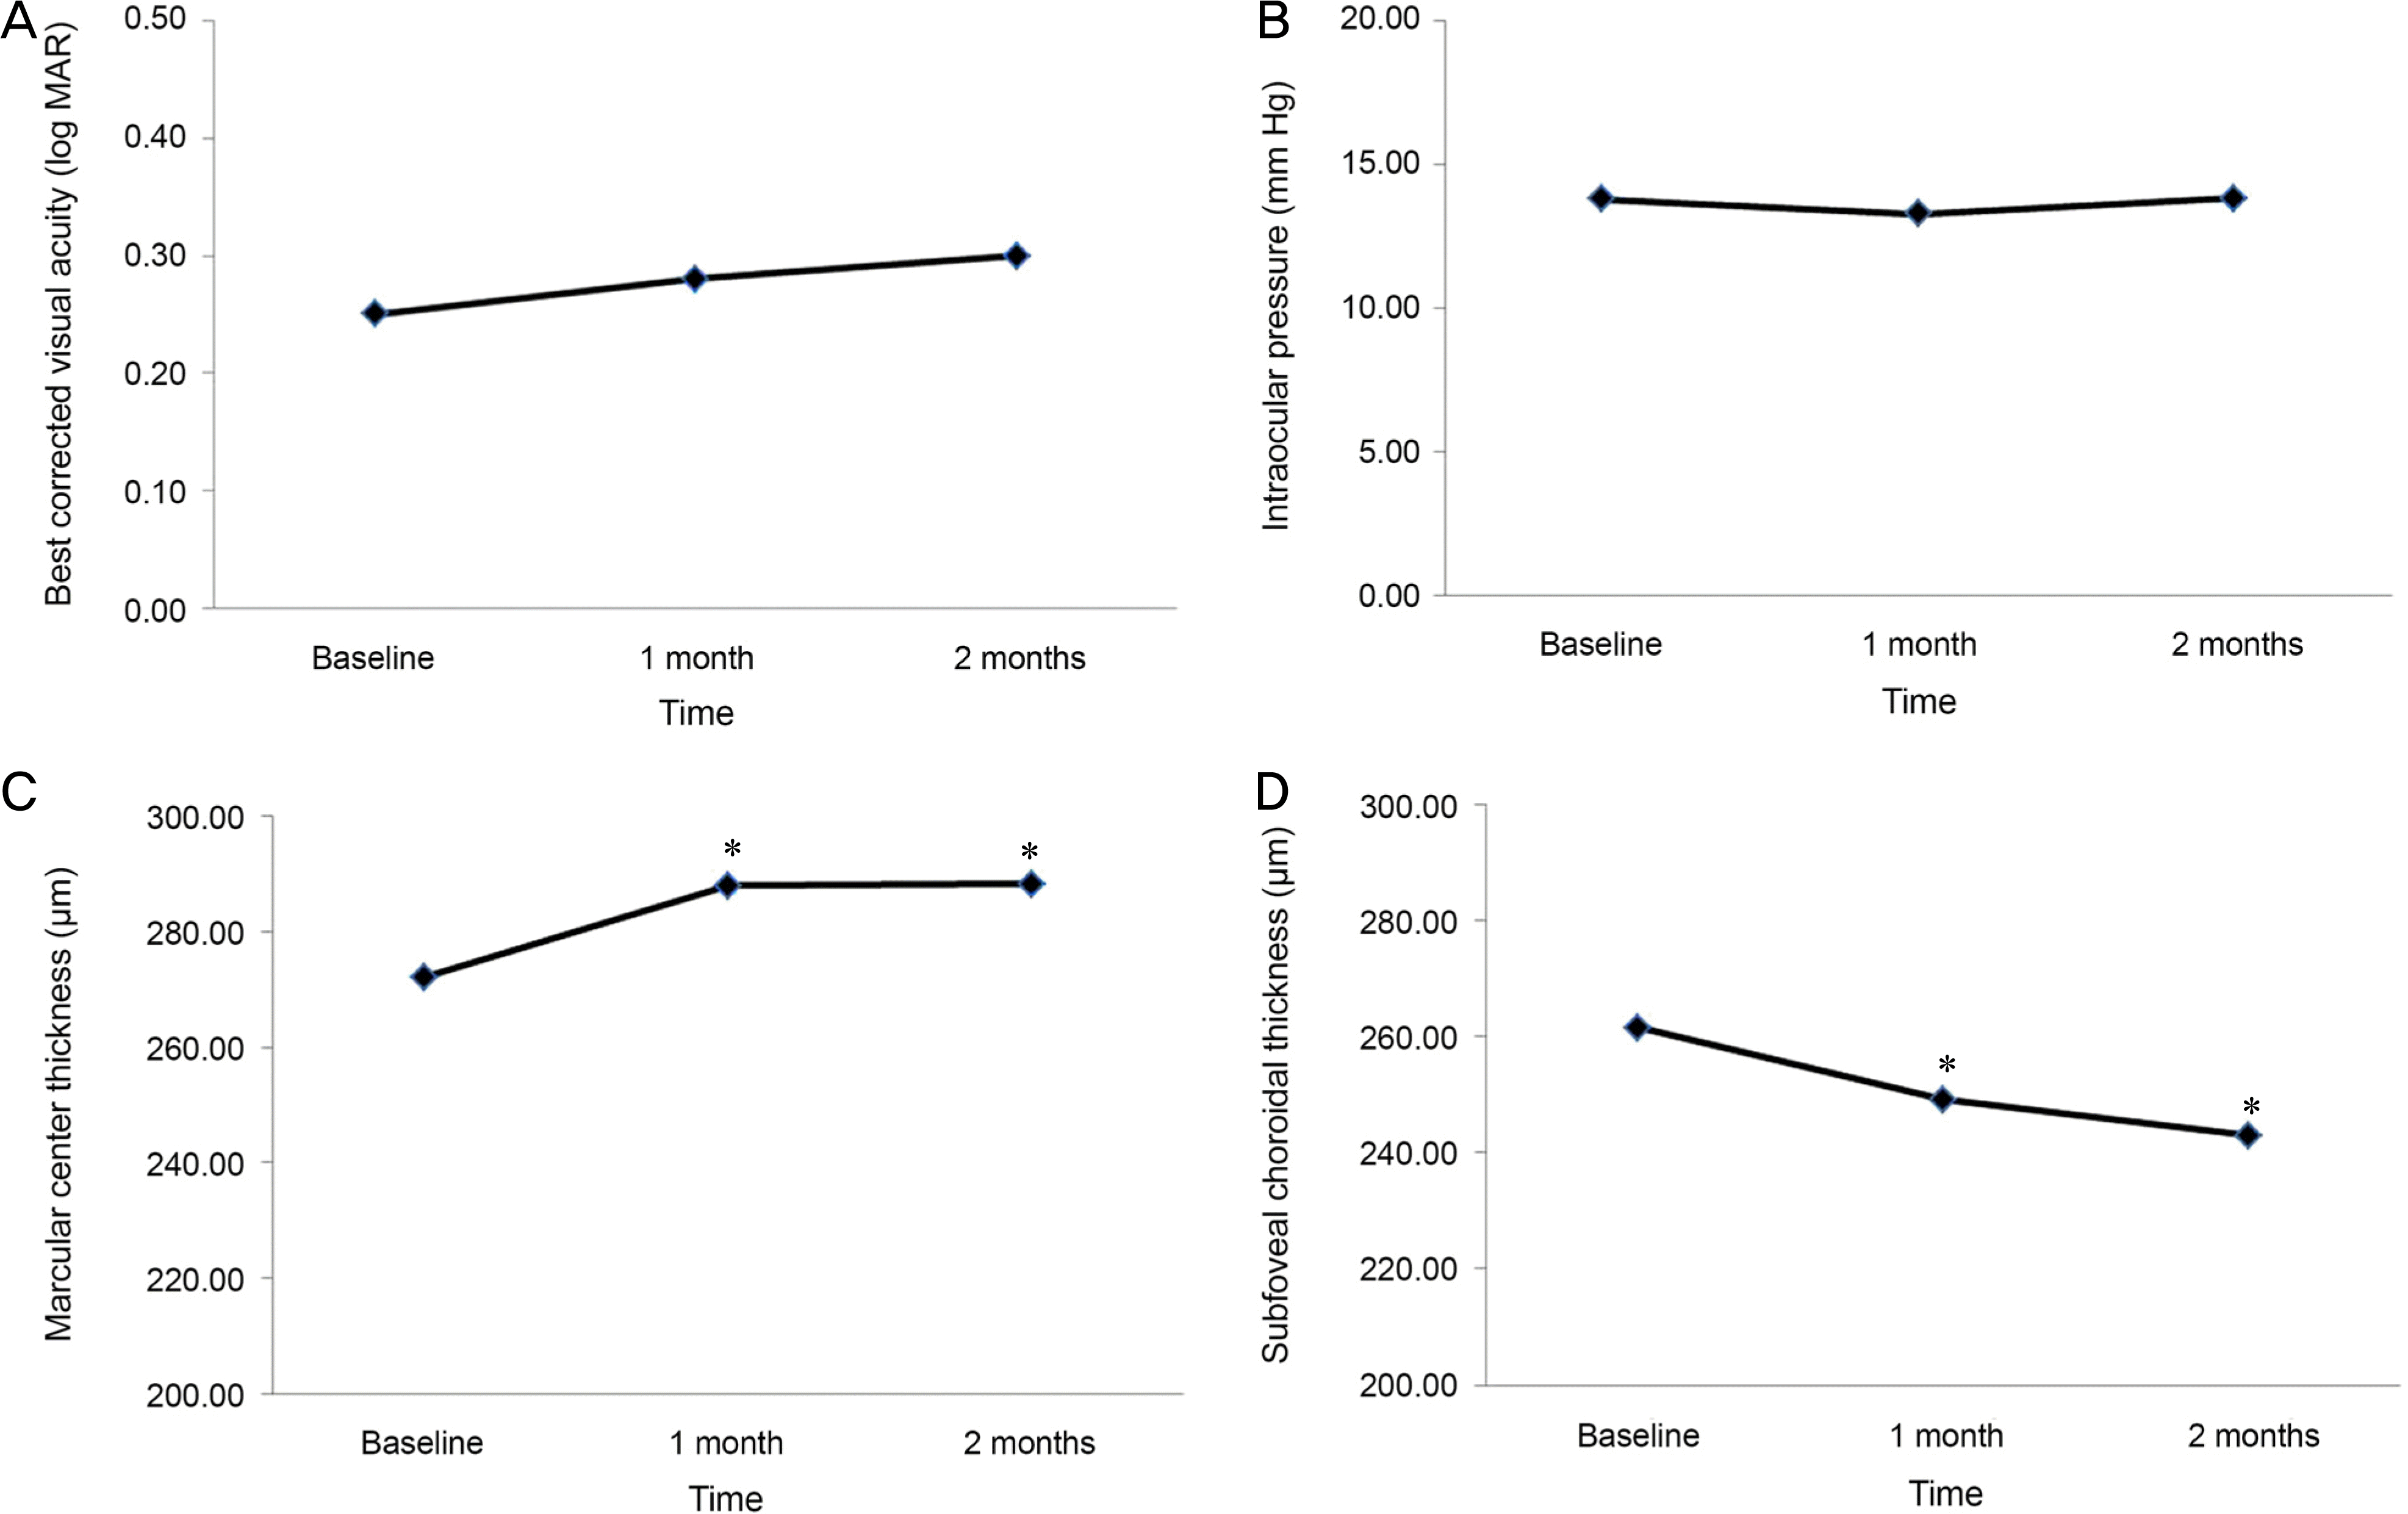
The mean SFCT at baseline was 261.52 ± 77.98 µm, changing to 249.14 ± 72.23 μm and 242.95 ± 70.28 μm at 1 and 2 months, respectively (p < 0.05). The mean central macular thickness (CMT) was increased (>10%) in 9 eyes (21.43%) at 1 month and 8 eyes (19.05%) at 2 months after PRP. The mean SFCT showed no significant difference between increased mean CMT (238.22 ± 57.59 μm and 240.00 ± 67.71 μm at 1 and 2 months, respectively) and stable mean CMT groups (252.12 ± 76.24 μm and 243.65 ± 71.84 μm at 1 and 2 months, respectively; p > 0.05).
Go to : 
REFERENCES
1). Early photocoagulation for diabetic retinopathy. ETDRS report number 9. Early Treatment Diabetic Retinopathy Study Research Group. Ophthalmology. 1991; 98:(5 Suppl). 766–85.
2). Ferris F. Early photocoagulation in patients with either type I or type II diabetes. Trans Am Ophthalmol Soc. 1996; 94:505–37.

3). Bressler NM, Beck RW, Ferris FL 3rd.Panretinal photocoagulation for proliferative diabetic retinopathy. N Engl J Med. 2011; 365:1520–6.

4). Blondeau P, Pavan PR, Phelps CD. Acute pressure elevation following panretinal photocoagulation. Arch Ophthalmol. 1981; 99:1239–41.

5). Lerner BC, Lakhanpal V, Schocket SS. Transient myopia and accommodative paresis following retinal cryotherapy and panretinal photocoagulation. Am J Ophthalmol. 1984; 97:704–8.

6). Pahor D. Visual field loss after argon laser panretinal photocoagulation in diabetic retinopathy: full- versus mild-scatter coagulation. Int Ophthalmol. 1998; 22:313–9.
7). Yuki T, Kimura Y, Nanbu S, et al. Ciliary body and choroidal detachment after laser photocoagulation for diabetic retinopathy. A high-frequency ultrasound study. Ophthalmology. 1997; 104:1259–64.
8). Ryan SJ. Retina. 4th ed.Vol. 1. Philadelphia: Elsevier Mosby;2006. p. 33.
9). Spaide RF, Koizumi H, Pozzoni MC. Enhanced depth imaging spectral-domain optical coherence tomography. Am J Ophthalmol. 2008; 146:496–500.

10). Querques G, Lattanzio R, Querques L, et al. Enhanced depth imaging optical coherence tomography in type 2 diabetes. Invest Ophthalmol Vis Sci. 2012; 53:6017–24.

11). Cho JH, Bae SH, Han JR, et al. Comparison of choroidal thickness in eyes with central serous chorioretinopathy, asymptomatic fellow eyes and normal eyes. J Korean Ophthalmol Soc. 2012; 53:87–93.

12). Kim KH, Kim DG. The relationship among refractive power, axial length and choroidal thickness measured by SD-OCT in myopia. J Korean Ophthalmol Soc. 2012; 53:626–31.

13). Lee SH, Chung HW, Kim HC. Subfoveal choroidal thickness in fellow eyes of patients with central serous chorioretinopathy. J Korean Ophthalmol Soc. 2012; 53:982–7.

14). Kim JW, Kim YT. Changes in subfoveal choroidal thickness in malignant hypertension patients. J Korean Ophthalmol Soc. 2014; 55:840–6.

15). Park JS, Cho YW, Jang JH. Choroid in myopic choroidal neo-vascularization measured using SD-OCT. J Korean Ophthalmol Soc. 2014; 55:1313–9.

16). Kim JH, Kim JS, Lee KW, Lee JH. The posterior choroidal profiles measured by spectral domain optical coherence tomography in healthy Korean children. J Korean Ophthalmol Soc. 2013; 54:1708–14.

17). Park BJ, Chung HW, Kim HC. Effects of diabetic retinopathy and intravitreal bevacizumab injection on choroidal thickness in diabetic patients. J Korean Ophthalmol Soc. 2013; 54:1520–5.

18). Cho GE, Cho HY, Kim YT. Change in subfoveal choroidal thickness after argon laser panretinal photocoagulation. Int J Ophthalmol. 2013; 6:505–9.

19). Margolis R, Spaide RF. A pilot study of enhanced depth imaging optical coherence tomography of the choroid in normal eyes. Am J Ophthalmol. 2009; 147:811–5.

20). Ikuno Y, Kawaguchi K, Nouchi T, Yasuno Y. Choroidal thickness in healthy Japanese subjects. Invest Ophthalmol Vis Sci. 2010; 51:2173–6.

21). Agawa T, Miura M, Ikuno Y, et al. Choroidal thickness measurement in healthy Japanese subjects by three-dimensional high-penetration optical coherence tomography. Graefes Arch Clin Exp Ophthalmol. 2011; 249:1485–92.

22). Tan CS, Ouyang Y, Ruiz H, Sadda SR. Diurnal variation of choroidal thickness in normal, healthy subjects measured by spectral domain optical coherence tomography. Invest Ophthalmol Vis Sci. 2012; 53:261–6.

23). Lee SW, Yu SY, Seo KH, et al. Diurnal variation in choroidal thickness in relation to sex, axial length, and baseline choroidal thickness in healthy Korean subjects. Retina. 2014; 34:385–93.

24). Hidayat AA, Fine BS. Diabetic choroidopathy. Light and electron microscopic observations of seven cases. Ophthalmology. 1985; 92:512–22.
25). Fryczkowski AW, Hodes BL, Walker J. Diabetic choroidal and iris vasculature scanning electron microscopy findings. Int Ophthalmol. 1989; 13:269–79.

26). Regatieri CV, Branchini L, Carmody J, et al. Choroidal thickness in patients with diabetic retinopathy analyzed by spectral-domain optical coherence tomography. Retina. 2012; 32:563–8.

27). Kim JT, Lee DH, Joe SG, et al. Changes in choroidal thickness in relation to the severity of retinopathy and macular edema in type 2 diabetic patients. Invest Ophthalmol Vis Sci. 2013; 54:3378–84.

28). Zhu Y, Zhang T, Wang K, et al. Changes in choroidal thickness after panretinal photocoagulation in patients with type 2 diabetes. Retina. 2015; 35:695–703.

29). Zhang Z, Meng X, Wu Z, et al. Changes in choroidal thickness after panretinal photocoagulation for diabetic retinopathy: a 12-week longitudinal study. Invest Ophthalmol Vis Sci. 2015; 56:2631–8.

30). Shimura M, Yasuda K, Nakazawa T, et al. Quantifying alterations of macular thickness before and after panretinal photocoagulation in patients with severe diabetic retinopathy and good vision. Ophthalmology. 2003; 110:2386–94.

31). Lee SB, Yun YJ, Kim SH, Kim JY. Changes in macular thickness after panretinal photocoagulation in patients with severe diabetic retinopathy and no macular edema. Retina. 2010; 30:756–60.

32). Nagaoka T, Kitaya N, Sugawara R, et al. Alteration of choroidal circulation in the foveal region in patients with type 2 diabetes. Br J Ophthalmol. 2004; 88:1060–3.

33). Takahashi A, Nagaoka T, Sato E, Yoshida A. Effect of panretinal photocoagulation on choroidal circulation in the foveal region in patients with severe diabetic retinopathy. Br J Ophthalmol. 2008; 92:1369–73.

34). Oh IK, Kim SW, Oh J, et al. Inflammatory and angiogenic factors in the aqueous humor and the relationship to diabetic retinopathy. Curr Eye Res. 2010; 35:1116–27.

35). Berkowitz BA, Sato Y, Wilson CA, Juan E. Blood-retinal barrier breakdown investigated by real-time magnetic resonance imaging after gadolinium-diethylenetriaminepentaacetic acid injection. Invest Ophthalmol Vis Sci. 1991; 32:2854–60.
Go to : 
 | Figure 1.Changes in BCVA, IOP, MCT, SFCT after PRP. (A) BCVA did not changed significantly 1 and 2 months after PRP compared with baseline(p > 0.05). (B) IOP did not changed significantly 1 and 2 months after PRP compared with baseline(p > 0.05). (C) MCT increased significantly 1 and 2 months after PRP compared with baseline(p < 0.05). (D) SFCT decreased significantly 1 and 2 months after PRP compared with baseline (p < 0.05). Compared with pre-treatment by repeated measure ANOVA. BCVA =best corrected visual acuity; IOP = intraocular pressure; MCT = macular center thickness; SFCT = subfoveal choroidal thickness; PRP = panretinal photocoagulation; ANOVA = analysis of variance. * p < 0.05. |
 | Figure 2.Comparison of SFCT in ME group and non-ME group. (A) At 1 month, there was no significant difference between two groups (p > 0.05). (B) At 2 months, there was no significant difference between two groups (p > 0.05). Macular edema group means the patients that macular center thickness was increased more than 10% after panretinal photocoagulation. Compared by Mann-Whitney U-test. SFCT = subfoveal choroidal thickness; ME = macular edema. |
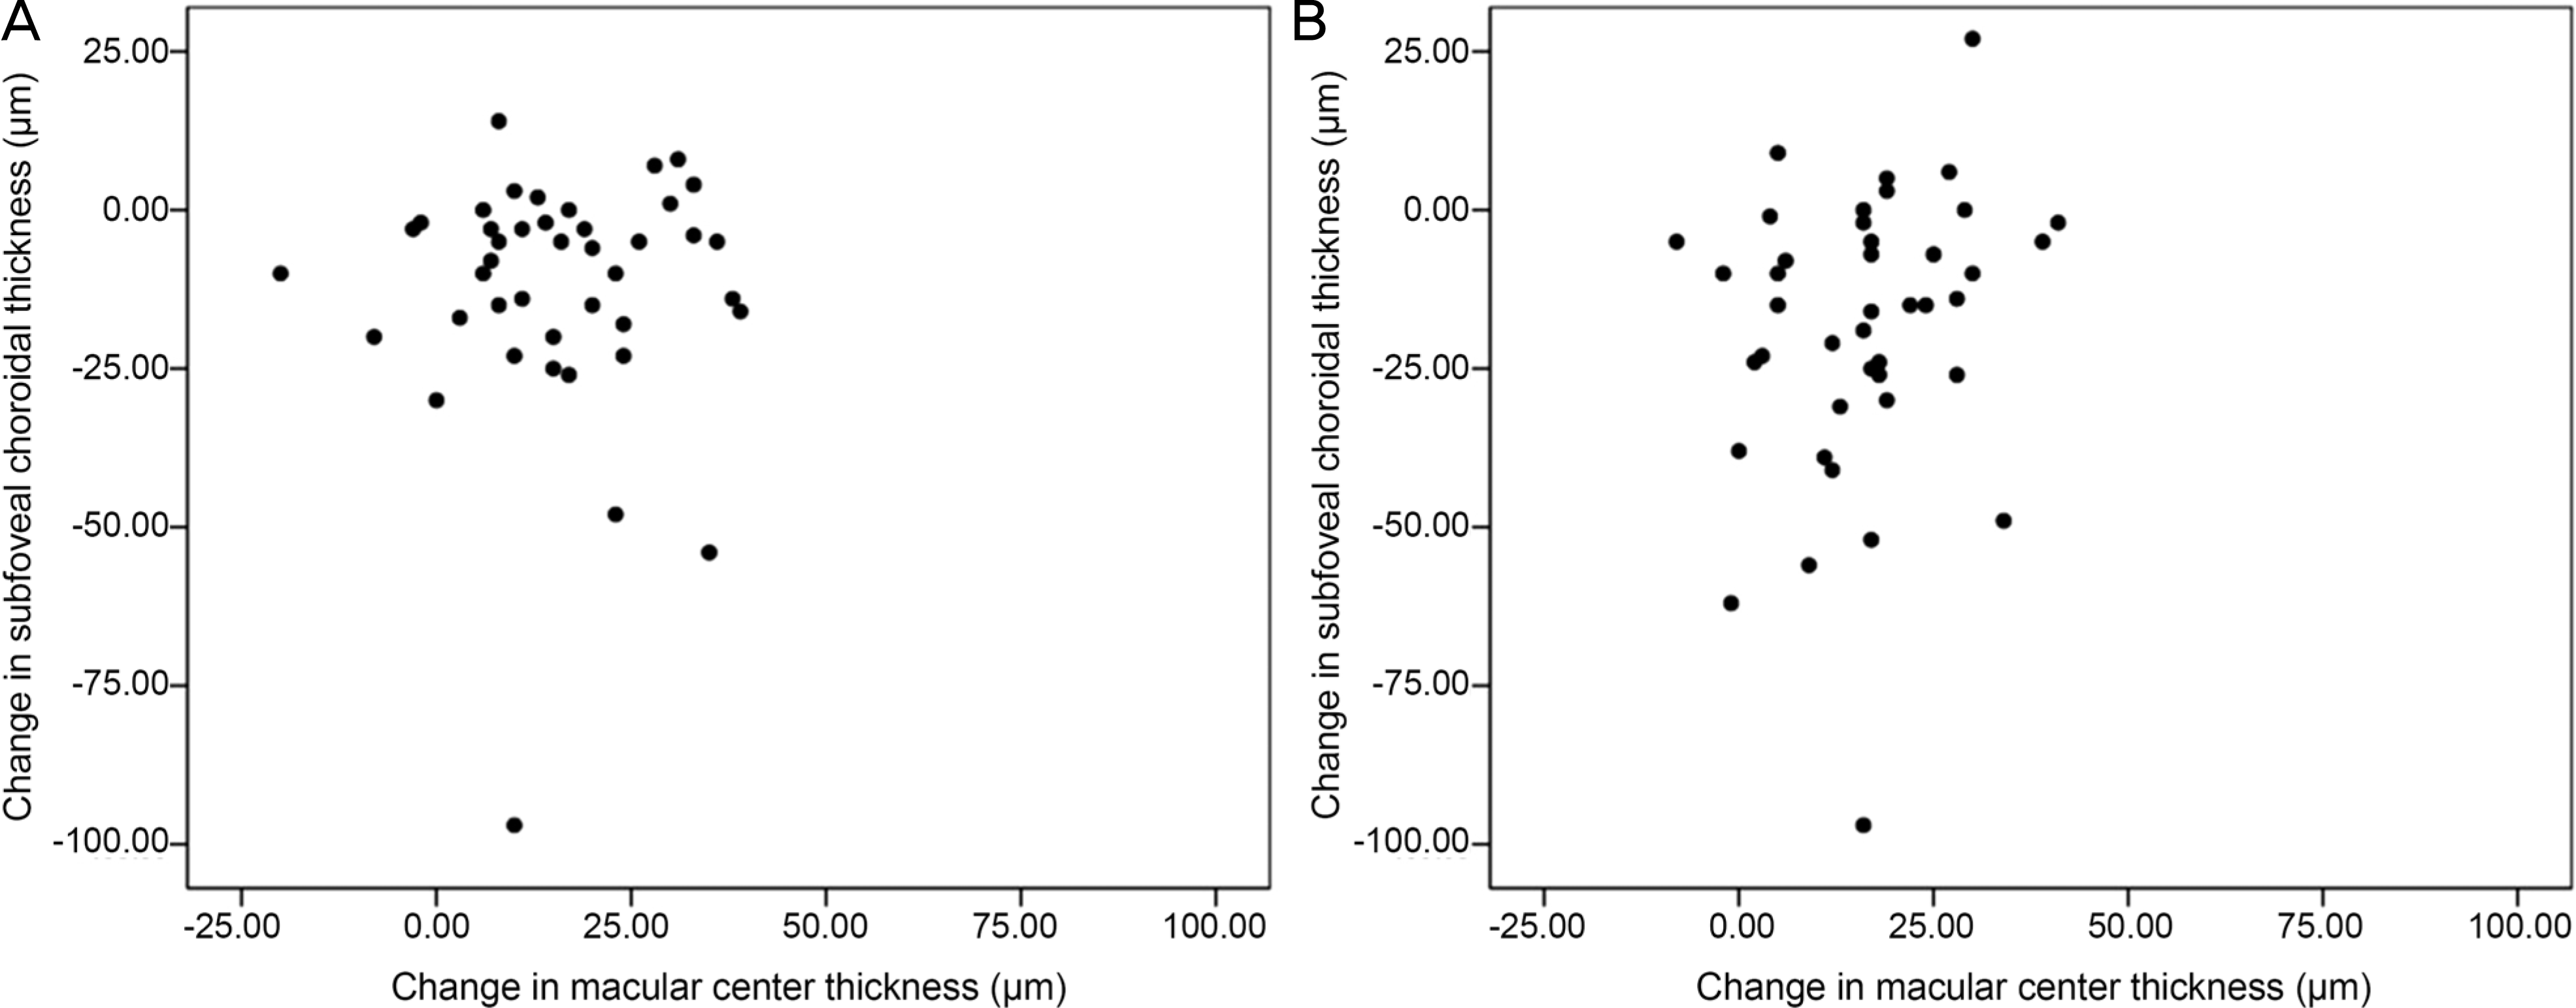
 | Figure 3.Scatter plots for correlation between change in MCT and SFCT. (A) At 1 month, there was no significant correlation between change in MCT and SFCT (r = 0.009, p = 0.957). (B) At 2 month, there was no significant correlation between change in MCT and SFCT (r = 0.201, p = 0.201). Compared by Pearson's correlation analysis. r = coefficient of correlation; MCT = macular center thickness; SFCT = subfoveal choroidal thickness. |
 | Figure 4.Comparison of MCT and SFCT between severe-NPDR and PDR. (A) There was no significant difference in MCT between two groups at baseline, 1 month and 2 months after PRP (p > 0.05). (B) There was no significant difference in SFCT between two groups at baseline, 1 month and 2 months after PRP (p > 0.05). Compared by Mann-Whitney U-test. MCT = macular center thickness; SFCT = subfoveal choroidal thickness; NPDR = non-proliferative diabetic retinopathy; PDR = proliferative diabetic retinopathy; PRP = panretinal photocoagulation. |


 PDF
PDF ePub
ePub Citation
 Print
Print


 XML Download