

 PDF
PDF ePub
ePub Citation
 Print
Print


Abstract
Purpose
In the present study, regular ophthalmic examinations performed in patients taking ethambutol were analyzed and the risk factors for ethambutol optic neuropathy were investigated.
Methods
We retrospectively collected the data of patients diagnosed with tuberculosis at Inje University Sanggye Paik Hospital and referred to the Department of Ophthalmology between October, 2010 and June, 2015. The patients were divided into three groups: group A (patients without visual loss), group B (patients with visual loss who were not diagnosed with ethambutol optic neuropathy), and group C (patients with visual loss who were diagnosed with ethambutol optic neuropathy). We evaluated each patient's glomerular filtration rate, ethambutol daily dosage, duration of ethambutol prescription, change in best corrected visual acuity, Ishihara color test over time, and peripapillary retinal nerve fiber layer thickness based on optical coherence tomography and mean deviation of perimetry.
Results
Group A consisted of 158 patients (86.8%), group B of 12 patients (6.6%), and group C of 12 patients (6.6%). Age was a risk factor for ethambutol optic neuropathy according to logistic regression analysis (p < 0.001) with a cutoff value of 59.5. In group B, visual acuity showed significant difference (p < 0.001) and in group C, visual acuity (p < 0.001) and color vision (p < 0.001) showed significant differences before and after taking ethambutol. When comparing groups B and C, average and temporal thickness of peripapillary retinal nerve fiber layer were not significantly different but mean deviation of perimetry was significantly different (p = 0.010).
Go to : 
References
1. Sadun AA, Wang MY. Ethambutol optic neuropathy: how we can abdominal 100,000 new cases of blindness each year. J Neuroophthalmol. 2008; 28:265–8.
2. Talbert Estlin KA, Sadun AA. Risk factors for ethambutol optic toxicity. Int Ophthalmol. 2010; 30:63–72.

3. Lee EJ, Kim SJ, Choung HK, et al. Incidence and clinical features of ethambutol-induced optic neuropathy in Korea. J Neuroophthalmol. 2008; 28:269–77.
4. Yang HK, Park MJ, Lee JH, et al. Incidence of toxic optic abdominal with low-dose ethambutol. Int J Tuberc Lung Dis. 2016; 20:261–4.
5. Tsai RK, Lee YH. Reversibility of ethambutol optic neuropathy. J Ocul Pharmacol Ther. 1997; 13:473–7.
6. Woung LC, Jou JR, Liaw SL. Visual function in recovered abdominal optic neuropathy. J Ocul Pharmacol Ther. 1995; 11:411–9.
7. Kim KL, Park SP. Visual function test for early detection of abdominal induced ocular toxicity at the subclinical level. Cutan Ocul Toxicol. 2016; 35:228–32.
9. Menon V, Jain D, Saxena R, Sood R. Prospective evaluation of abdominal function for early detection of ethambutol toxicity. Br J Ophthalmol. 2009; 93:1251–4.
10. Chung JK, Park YB, Park SP. Visual function test for early detection of ethambutol-induced ocular toxicity. J Korean Ophthalmol Soc. 2012; 53:694–9.
11. Chen SC, Lin MC, Sheu SJ. Incidence and prognostic factor of ethambutol-related optic neuropathy: 10-year experience in abdominal Taiwan. Kaohsiung J Med Sci. 2015; 31:358–62.
12. Chuenkongkaew W, Samsen P, Thanasombatsakul N. Ethambutol and optic neuropathy. J Med Assoc Thai. 2003; 86:622–5.
13. Fraunfelder FW, Sadun AA, Wood T. Update on ethambutol optic neuropathy. Expert Opin Drug Saf. 2006; 5:615–8.
14. Choi SY, Hwang JM. Optic neuropathy associated with ethambutol in Koreans. Korean J Ophthalmol. 1997; 11:106–10.
15. Sadun AA, Win PH, Ross-Cisneros FN, et al. Leber's hereditary optic neuropathy differentially affects smaller axons in the optic nerve. Trans Am Ophthalmol Soc. 2000; 98:223–32. discussion 232–5.
16. Lindeman RD, Tobin J, Shock NW. Longitudinal studies on the rate of decline in renal function with age. J Am Geriatr Soc. 1985; 33:278–85.
17. Trusiewicz D. Farnsworth 100-hue test in diagnosis of ethambu-tol-induced damage to optic nerve. Ophthalmologica. 1975; 171:425–31.
18. Joubert PH, Strobele JG, Ogle CW, van der Merwe CA. Subclinical impairment of colour vision in patients receiving ethambutol. Br J Clin Pharmacol. 1986; 21:213–6.
19. Yiannikas C, Walsh JC, McLeod JG. Visual evoked potentials in the detection of subclinical optic toxic effects secondary to ethambutol. Arch Neurol. 1983; 40:645–8.
20. Yoon YH, Jung KH, Sadun AA, et al. Ethambutol-induced vacuo-lar changes and neuronal loss in rat retinal cell culture: mediation by endogenous zinc. Toxicol Appl Pharmacol. 2000; 162:107–14.
Go to :
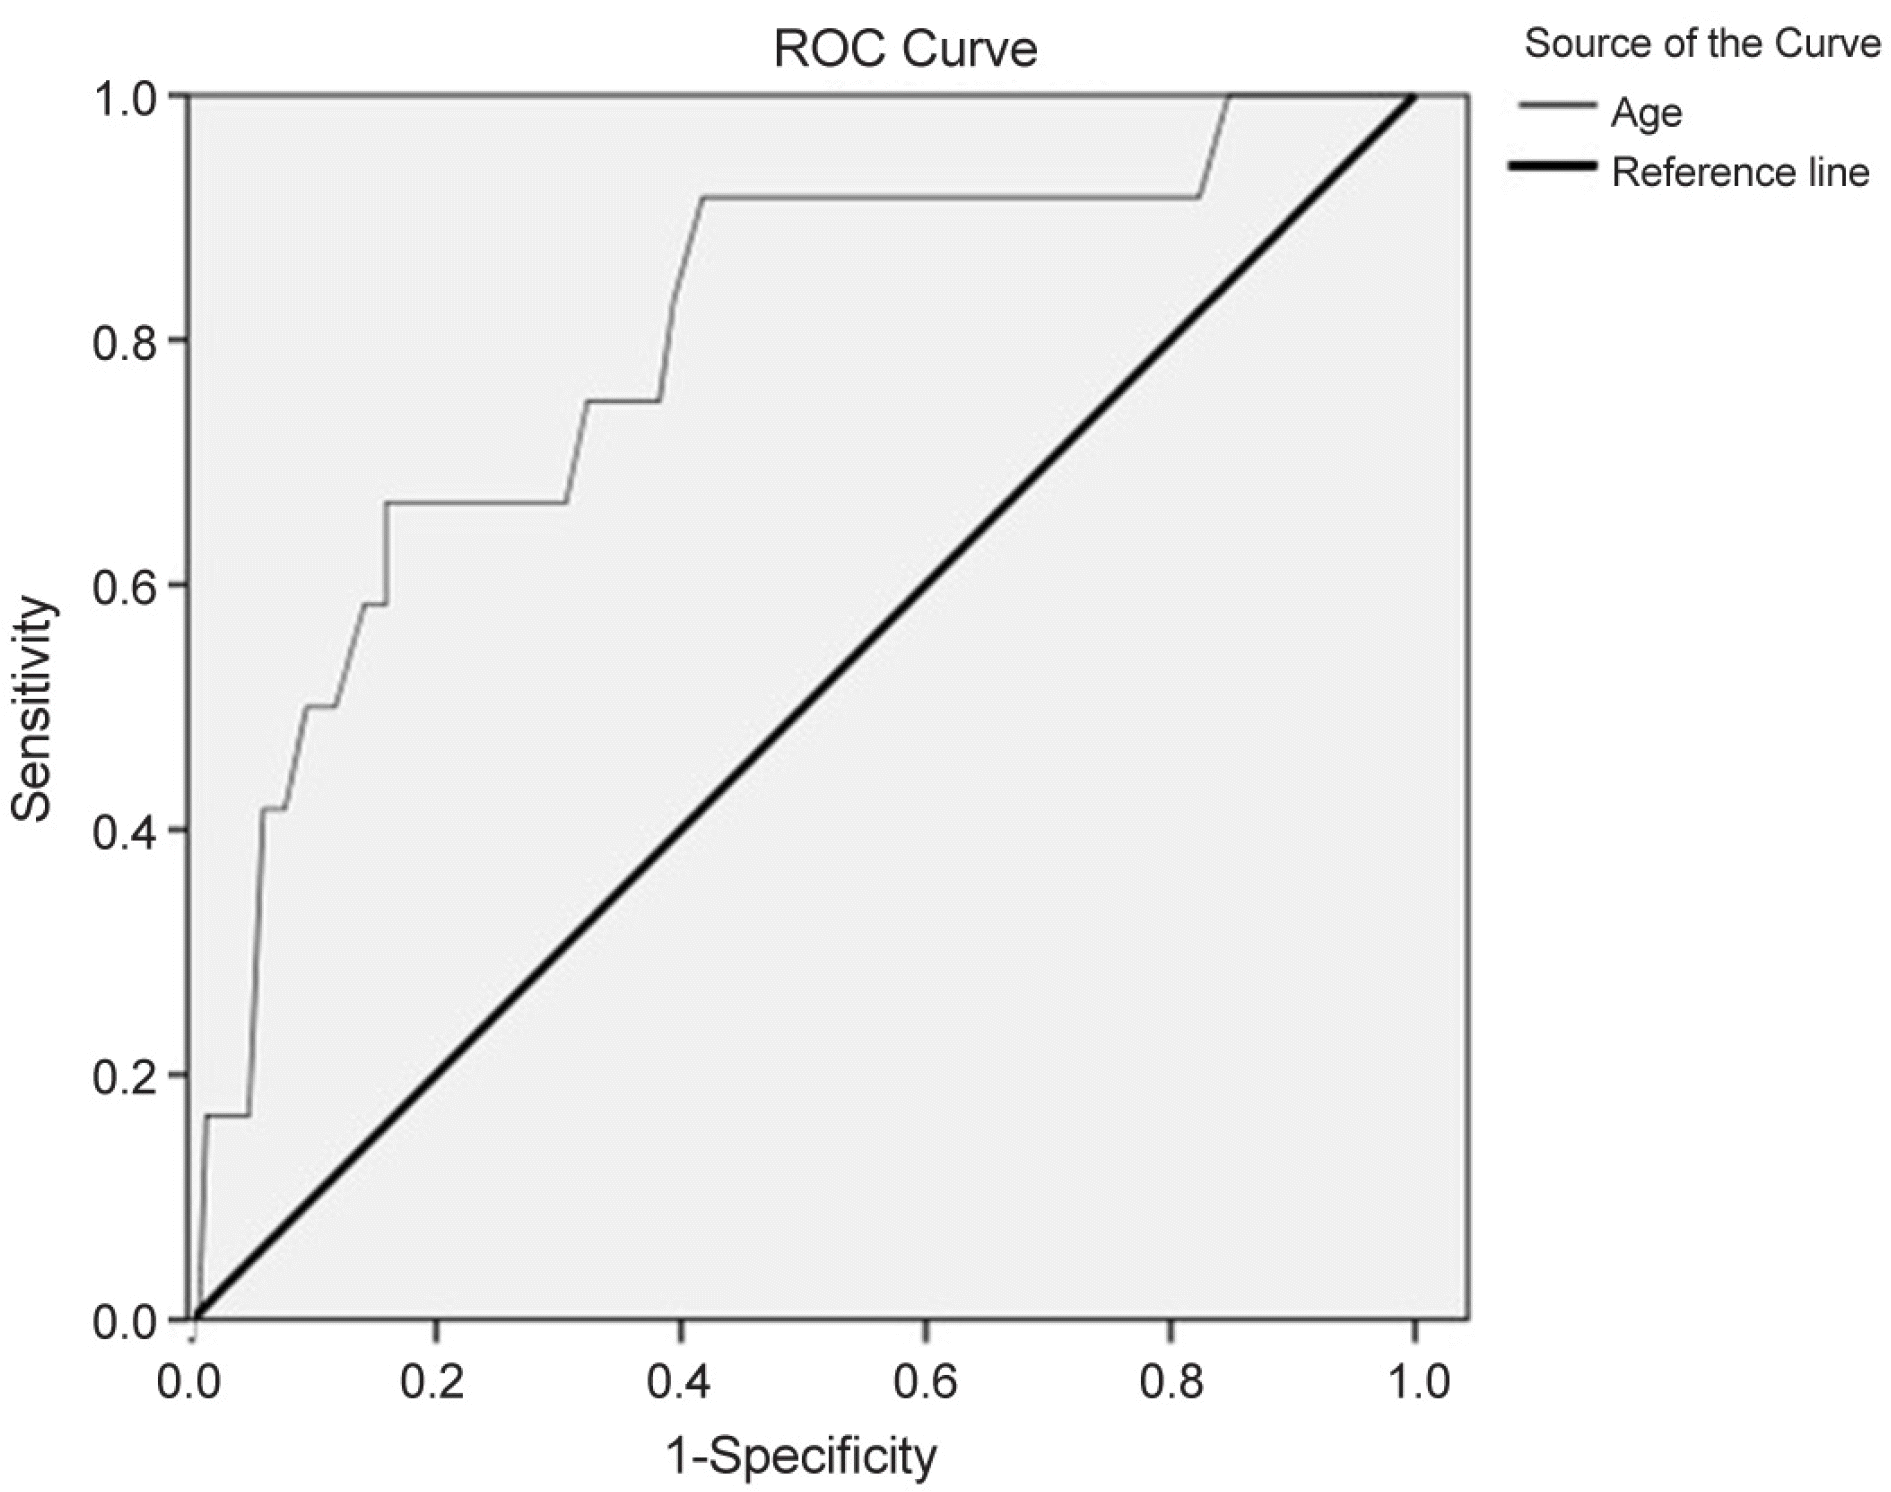 | Figure 1.Receiver operating characteristic (ROC) curve showing the sensitivity and specificity of the age. Area under cover value of age was 0.792 (p = 0.001). |
Table 1.
Demographics of patients in each group
| A (158) | B (12) | C (12) | p-value | Total (182) | |
|---|---|---|---|---|---|
| Sex (M/F) (n, %) | 85 (54)/73 (46) | 8 (67)/4 (33) | 4 (33)/8 (67) | 0.376* | 98 (54)/84 (46) |
| Age (year) | 48.23 ± 19.06 | 56.06 ± 16.10 | 70.63 ± 17.44 | <0.001† | 51.01 ± 19.28 |
| BCVA (log MAR) | 0.12 ± 0.22 | 0.17 ± 0.22 | 0.35 ± 0.20 | <0.001† | 0.13 ± 0.23 |
| Tonometer (mm Hg) | 11.97 ± 2.88 | 11.00 ± 3.26 | 10.63 ± 3.59 | 0.077† | 11.81 ± 2.96 |
| Color test (Isihara) | 23.97 ± 0.22 | 21.92 ± 7.72 | 21.96 ± 6.15 | 0.068† | 23.70 ± 4.45 |
| Past history (n, %) | |||||
| DM | 14 (8.9) | 5 (41.7) | 3 (25.0) | 0.065* | 24 (13.2) |
| HTN | 20 (12.7) | 7 (58.3) | 4 (33.3) | 0.127* | 31 (17.0) |
| Renal disease | 2 (1.3) | 1 (8.3) | 1 (8.3) | 0.057* | 4 (2.2) |
| Ocular history (eyes, %) | |||||
| None | 266 (84.2) | 11 (45.8) | 10 (41.7) | 287 (78.9) | |
| DR | 16 (5.1) | 7 (29.2) | 0 (0) | 23 (6.3) | |
| Glaucoma | 9 (2.9) | 3 (12.5) | 4 (16.7) | 18 (5.0) | |
| Cataract | 9 (2.9) | 3 (12.5) | 1 (4.2) | 13 (3.6) | |
| ARMD | 2 (0.6) | 0 (0) | 2 (8.3) | 4 (1.1) | |
| Etc | 14 (4.4) | 0 (0) | 3 (12.5) | 19 (5.2) | |
| GFR (mL/min) | 94.25 ± 24.70 | 90.89 ± 28.86 | 81.81 ± 27.43 | 0.046† | 93.21 ± 25.21 |
| EMB dosage(mg/d/kg) | 14.96 ± 1.71 | 15.19 ± 1.91 | 15.05 ± 2.78 | 0.582† | 14.93 ± 2.13 |
| EMB duration (mon) | 7.75 ± 4.95 | 8.44 ± 3.49 | 5.40 ± 6.89 | 0.007† | 7.67 ± 4.99 |
| Follow up time (mon) | 6.02 ± 4.95 | 4.16 ± 2.49 | 8.20 ± 7.63 | 0.439† | 6.04 ± 6.70 |
All values are presented as mean ± standard deviation except for sex and past history. M = male; F = female; BCVA = best corrected visual acuity; log MAR = logarithm of minimal angle resolution; DM = diabetes mellitus; HTN = hypertension; DR = diabetic retinopathy; ARMD = age related macular degeneration; GFR = glomerular filtration rate; EMB = ethambutol; n = number of patients; d = day; mon = month.
Table 2.
Analysis of possible factors contributing to ethambutol optic neuropathy (adjusted for variables listed in this table)
| Variables | Adjusted odds ratio |
95% confidence interval |
p-value* | |
|---|---|---|---|---|
| Lower | Upper | |||
| Age | 1.07 | 1.02 | 1.11 | <0.001 |
| Sex | 0.28 | 0.06 | 1.46 | 0.130 |
| HTN | 0.710 | 0.12 | 4.10 | 0.699 |
| DM | 2.41 | 0.45 | 13.05 | 0.307 |
| Renal disease | 23.71 | 0.59 | 961.87 | 0.094 |
| GFR (mL/min) | 1.01 | 0.99 | 1.04 | 0.364 |
| EMB dosage (mg/d/kg) | 0.93 | 0.62 | 1.39 | 0.725 |
| EMB duration (mon) | 0.10 | 0.99 | 1.00 | 0.245 |
Table 3.
Comparison of BCVA and color test in each group
|
BCVA (log MAR) |
Color test (Isihara) |
|||||
|---|---|---|---|---|---|---|
| Initial | Final | p-value | Initial | Final | p-value | |
| A | 0.12 ± 0.22 | 0.12 ± 0.23 | 0.445* | 23.97 ± 0.22 | 24.03 ± 0.22 | 0.690* |
| B | 0.17 ± 0.22 | 0.49 ± 0.61 | <0.001† | 21.92 ± 7.72 | 21.83 ± 1.57 | 0.163† |
| C | 0.35 ± 0.20 | 0.75 ± 0.50 | <0.001† | 21.96 ± 6.15 | 16.42 ± 9.12 | <0.001† |
 XML Download